DECLINE IN NON-AGRICULTURAL EMPLOYMENT
Seyfettin Gürsel
*Gökçe Uysal
∗∗and Ayşenur Acar
∗∗∗Abstract
Seasonally adjusted labor market data shows that non-agricultural unemployment rate increased by 0.1 percentage
point and reached 11.8 percent in the period of May 2013. Increase in monthly non-agricultural labor force slowed
down and non-agricultural employment decreased in this period. Kariyer.net series indicate that non-agricultural
unemployment might increase in the next period.
Increases in both non-agricultural labor force and employment continue to slow down
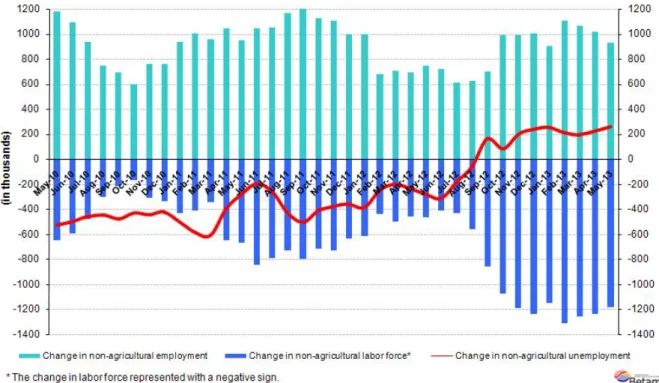
According to the data released by TurkSTAT, non-agricultural labor force increased by 1 million 185 thousand (5.6
percent) and non-agricultural employment increased by 928 thousand (4.9 percent) in the period of May 2013
(Figure 1). We observe a slowdown in the annual trend.
Figure 1 Year-on-year changes in non-agricultural labor force, employment and unemployment
Source: TurkSTAT, Betam
Non-agricultural unemployment increased in the period of April 2013
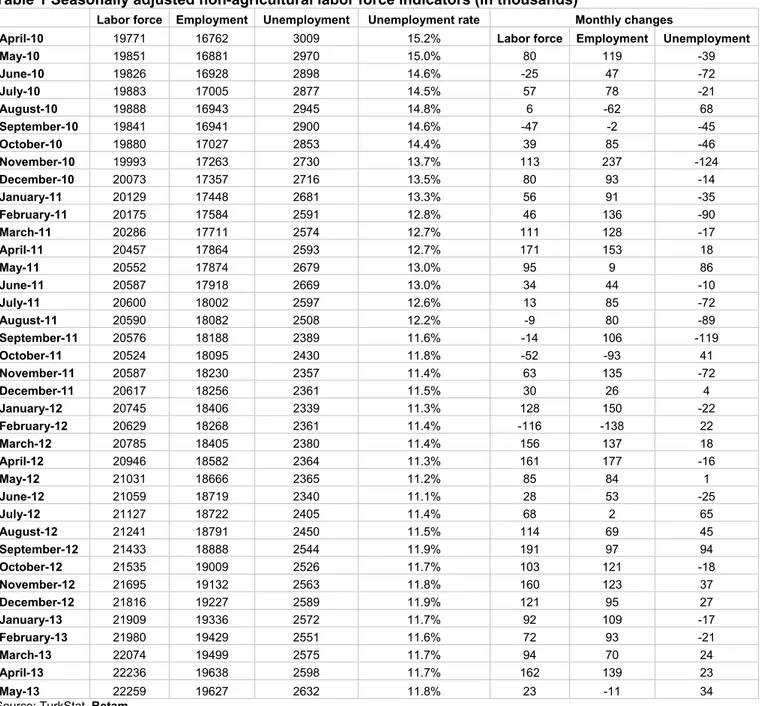
According to seasonally adjusted data, non-agricultural labor force increased by 23 thousand and reached 22
million 259 thousand in the period of May 2013 compared to the period of April 2013 (Figure 2, Table 1).
Non-agricultural employment decreased by 11 thousand and retreated to 19 million 627 thousand. This is the first
decline in seasonally adjusted non-agricultural employment since February 2012. Consequently, the number of
* Prof. Dr. Seyfettin Gürsel, Betam, Director, [email protected]
∗∗ Yrd. Doç. Dr. Gökçe Uysal, Betam, Vice Director, [email protected] ∗∗∗ Ayşenur Acar, Betam, Research Assistant, [email protected]
Labor Market Outlook:
August 2013
www.betam.bahcesehir.edu.tr
2
persons unemployed in non-agricultural sectors increased by 34 thousand and non-agricultural unemployment rate
reached 11.8 percent.
Figure 2 Seasonally adjusted non-agricultural labor force, employment and unemployment
Source: TurkStat, Betam
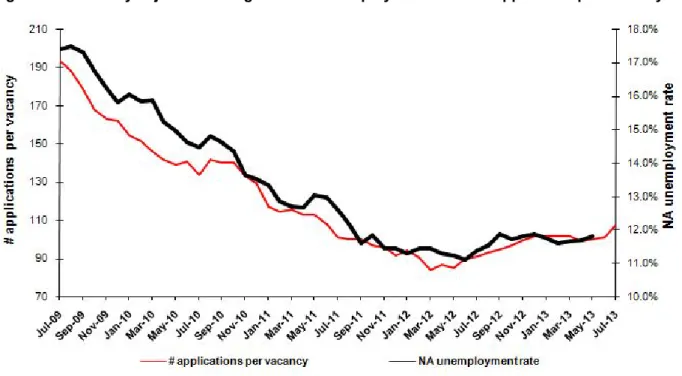
According to Kariyer.net data, non-agricultural unemployment might increase
Application per vacancy statistics calculated using Kariyer.net
1series indicate that non-agricultural unemployment
rate will increase in the period of June 2013.
Figure 1 Seasonally adjusted non-agricultural unemployment rate and application per vacancy
Source: Kariyer.net, TurkStat, Betam
1 Betam has been calculating application per vacancy using series released by Kariyer.net for a while. Seasonal and calendar adjustment
procedure is applied to application per vacancy series. A decrease in applications per vacancy may be caused by an increase in vacancies or by a decrease in the number of applications. An increase in vacancies signals economic growth while decreasing number of applications indicates a decrease in number of people looking for a job.
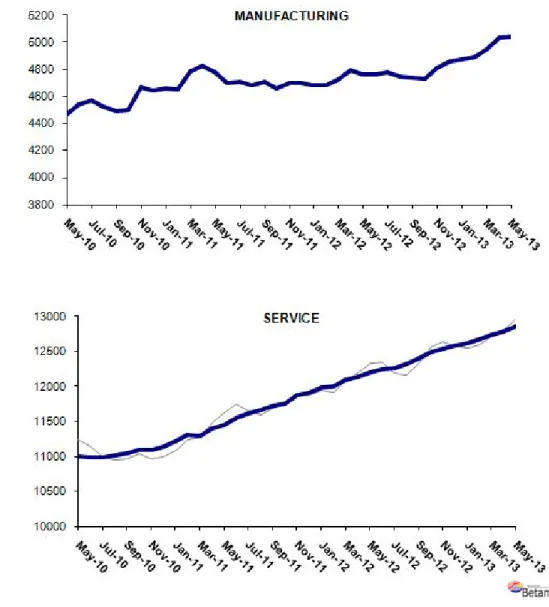
Employment increases in services, declines in construction
Seasonally adjusted series show that increases in service sector continue in the period of May 2013 (Table 2,
Figure 4).
2In this period, employment in service sector increased by 72 thousand. We observe a slight increase in
manufacturing employment (14 thousand), while employment in construction decreased by 97 thousand (5.6
percent). Developments in the construction sector require further research.
2 Employment in each sector is seasonally adjusted separately. Hence the sum of these series may differ from the seasonally adjusted series of
www.betam.bahcesehir.edu.tr
4
Figure 2 Employment by sectors (in thousands)
3Source: TurkStat, Betam
Table 1 Seasonally adjusted non-agricultural labor force indicators (in thousands)
Labor force Employment Unemployment Unemployment rate Monthly changes
April-10 19771 16762 3009 15.2% Labor force Employment Unemployment
May-10 19851 16881 2970 15.0% 80 119 -39 June-10 19826 16928 2898 14.6% -25 47 -72 July-10 19883 17005 2877 14.5% 57 78 -21 August-10 19888 16943 2945 14.8% 6 -62 68 September-10 19841 16941 2900 14.6% -47 -2 -45 October-10 19880 17027 2853 14.4% 39 85 -46 November-10 19993 17263 2730 13.7% 113 237 -124 December-10 20073 17357 2716 13.5% 80 93 -14 January-11 20129 17448 2681 13.3% 56 91 -35 February-11 20175 17584 2591 12.8% 46 136 -90 March-11 20286 17711 2574 12.7% 111 128 -17 April-11 20457 17864 2593 12.7% 171 153 18 May-11 20552 17874 2679 13.0% 95 9 86 June-11 20587 17918 2669 13.0% 34 44 -10 July-11 20600 18002 2597 12.6% 13 85 -72 August-11 20590 18082 2508 12.2% -9 80 -89 September-11 20576 18188 2389 11.6% -14 106 -119 October-11 20524 18095 2430 11.8% -52 -93 41 November-11 20587 18230 2357 11.4% 63 135 -72 December-11 20617 18256 2361 11.5% 30 26 4 January-12 20745 18406 2339 11.3% 128 150 -22 February-12 20629 18268 2361 11.4% -116 -138 22 March-12 20785 18405 2380 11.4% 156 137 18 April-12 20946 18582 2364 11.3% 161 177 -16 May-12 21031 18666 2365 11.2% 85 84 1 June-12 21059 18719 2340 11.1% 28 53 -25 July-12 21127 18722 2405 11.4% 68 2 65 August-12 21241 18791 2450 11.5% 114 69 45 September-12 21433 18888 2544 11.9% 191 97 94 October-12 21535 19009 2526 11.7% 103 121 -18 November-12 21695 19132 2563 11.8% 160 123 37 December-12 21816 19227 2589 11.9% 121 95 27 January-13 21909 19336 2572 11.7% 92 109 -17 February-13 21980 19429 2551 11.6% 72 93 -21 March-13 22074 19499 2575 11.7% 94 70 24 April-13 22236 19638 2598 11.7% 162 139 23 May-13 22259 19627 2632 11.8% 23 -11 34
Source: TurkStat, Betam
6
Table 2 Seasonally adjusted employment by sector (in thousands)
Agriculture Manufacturing Construction Service Monthly changes
April-10 5672 4381 1437 10944 Agriculture Manufacturing Construction Service
May-10 5587 4470 1417 10994 -85 89 -21 51 June-10 5719 4536 1414 10978 132 66 -3 -16 July-10 5687 4575 1453 10977 -31 39 40 -1 August-10 5664 4525 1408 11011 -23 -50 -46 34 September-10 5659 4489 1410 11042 -6 -36 2 32 October-10 5791 4498 1442 11087 133 9 32 44 November-10 5845 4667 1512 11085 54 169 70 -2 December-10 6028 4642 1569 11146 183 -25 57 61 January-11 6033 4656 1582 11210 5 14 13 64 February-11 6178 4652 1627 11305 145 -4 45 95 March-11 6198 4790 1630 11292 19 138 3 -13 April-11 6082 4828 1633 11403 -116 38 3 112 May-11 6036 4777 1652 11445 -46 -51 19 41 June-11 6093 4697 1667 11554 57 -80 15 109 July-11 6115 4710 1673 11619 22 13 6 65 August-11 6192 4682 1742 11659 77 -28 68 40 September-11 6131 4707 1751 11730 -60 25 9 71 October-11 6167 4657 1679 11758 36 -50 -72 28 November-11 6145 4700 1657 11873 -22 43 -22 114 December-11 6045 4701 1645 11910 -100 1 -12 37 January-12 6052 4685 1729 11992 7 -16 84 82 February-12 6033 4684 1588 11996 -19 -1 -141 4 March-12 6027 4721 1585 12100 -6 37 -4 104 April-12 6065 4792 1653 12137 38 71 69 37 May-12 6128 4760 1707 12199 64 -32 54 62 June-12 6055 4761 1719 12240 -74 1 12 40 July-12 6054 4778 1676 12268 0 17 -43 28 August-12 6055 4745 1726 12320 1 -33 50 52 September-12 6155 4735 1758 12395 100 -10 32 75 October-12 6190 4732 1784 12493 34 -3 26 98 November-12 6176 4814 1782 12536 -14 82 -2 43 December-12 6131 4856 1792 12579 -45 42 10 43 January-13 6110 4870 1856 12611 -21 14 64 32 February-13 6135 4886 1860 12683 25 16 5 72 March-13 6120 4948 1814 12737 -14 62 -46 54 April-13 6111 5030 1818 12790 -10 82 3 54 May-13 6051 5044 1721 12862 -60 14 -97 72