devam etmektedir. Bunun nedeni Türkiye’nin AB üzerindeki ağır etkilerinin bekleniyor olmasıdır. Bizim çalışmamız, Türk üreticilerinin maliyet yapılarının ve karlılıklarının AB’ye üyelik sonucunda nasıl değişeceği üzerinde durmaktadır. Böyle bir analiz yapabilmek için de Hesaplanabilir Genel Denge Modeli yaklaşımı bir araç olarak kullanılmış ve değişik versiyondaki senaryoların simulasyon sonucu üretilen sonuçları tartışılmıştır. Modelimiz Türk sanayi sektöründeki eksik rekabet şartlarını dikkate almak ve emek sektöründeki vasıflı-vasıfsız ayrımına gitmek suretiyle daha etkin sonuçlar bulmayı hedeflemektedir. Simulasyon sonuçları, bazı bireysel sektörlerin negatif etkilenmesine rağmen genel olarak AB’nin Türk üreticisine olumlu katkılar sağlayacağı savımızı doğrulamaktadır.
Anahtar Kelimeler: Genel Denge, Avrupa Birliği, Ekonomik
Entegrasyon, Türkiye Ekonomisi
Abstract: The arguments about full membership in the EU became a
priority for Turkey in the last decade, because Turkey=s joining the EU will have a strong impact on Turkey=s and the EU=s macroeconomic structure. This study analyzes how Turkish producers’ profitability and cost of production will be affected by a full integration with EU. In order to analyze this, a computable general equilibrium (CGE) model has been developed and the results of various policy scenarios have been compared. The model developed considers the imperfect competition in the Turkish manufacturing sector, and distinguishes the labor into two different categories: skilled and unskilled labor force. Simulation results show that full membership appears to be the most beneficial scenario for the Turkish economy, even though some sectors are actually become worse off.
Keywords: General Equilibrium, European Union, Economi
Integration, Turkish Economy
I.Introduction
Strengths or weaknesses of a country’s economic development can be explained by its fiscal constraints, and the current account balances. Countries experiencing a current account balance deficit have difficulty attracting new foreign investments. The effects of financial deficits become even more important when economic integration is involved. Choosing economic integration with other countries affects the country’s macroeconomic variables such as imports, exports, prices, investment level, wage rate, and even
(*) Yrd. Doç. Dr. Muğla Üniversitesi İİBF İktisat Bölümü
population. Since all these issues are closely related to fiscal independency of a country, pre-evaluation of such policy decisions should be made very carefully. Appropriate forecasting of such policy results will improve the current and future policy making capabilities of the countries.
The economic theory suggests that an instant integration may result in very extensive social and economic problems for the countries involved, especially if they have differing levels of economic development. Thus, it should include a preparation process. As is the case for most developing countries, Turkey is facing difficulties in maintaining these problems for several years, but the challenge became even more severe by joining the European customs union in 1996. Even before the customs union agreement, Turkey had a very close relationship with the European Union (EU) countries. Although 52 percent of Turkish external trade is conducted with the EU, and more than 60 percent of foreign investments in Turkey came from the EU countries, there are still major problems with complete integration. The inflation rate, increasing unemployment, large government and large internal and external debt are major problems to be dealt with by Turkish officials. By accepting the Common Custom Tariff (CCT) agreement, Turkey would lower its import tariffs on EU exports and adjust itself to the common commercial policy applied by member countries of the EU on third countries.
Even though Turkey is self-sufficient and may compete with the European Union countries in the services and manufacturing sectors, some empirical analyses such as Yeldan (1986), and Harrison et, al. (1996) show that Turkey’s contribution to the EU will be less than the burden that the EU will experience. Also, the relatively low per capita GNP of Turkey will put more strains on the EU’s budget. The impact of intra-community trade would likely be significant in the manufacturing sector, but limited in the agricultural sector (Musto, 1990).
Mercenier and Michel’s (1994) inter-temporal computable general equilibrium (CGE) model results showed that the best policy for international integration is to remove non-tariff barriers as well as tariff barriers. Within this context, it has been suggested that Turkey should remove both tariff, and non-tariff barriers to improve social welfare. Failure to adopt this policy is much worse than the implementation of no policy at all (Yeldan, 1997), given that it opens new markets to Turkey including textiles, clothing, petroleum products, iron and steel.
Considering these explained facts, this paper analyzes the impacts of an economic integration with EU on the Turkish producers. In other words, how this integration might affect their profits and production costs. In order to achieve this objective a single country-multi sectoral general equilibrium model has been developed, and various integration scenarios have been analyzed.
II. The Model
This section explains the analytical framework and mathematical construction of a computable general equilibrium (CGE) model for the Turkish economy. The model is exactly taken from Bekmez (2002), and illustrates the impacts of Turkey’s full accession into the European Union with different scenarios, and compares the results with customs union regarding sectoral profits and cost of production.
A) Theoretical Model:
The model is constructed under the neo-classical framework. A two-stage cooperative game is assumed to capture the impacts of integration. The first stage of the game determines the protection tools, and the second stage determines the level of the protection. Bargaining process starts in the second stage of the game. If anything fails in this stage, trade warfare occurs.
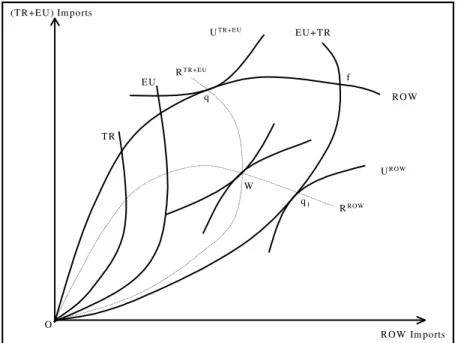
Figure 1: Economic Integration and Partnership Game
Figure 1 shows the implications of Turkish-EU integration and explains the rationale behind this integration. The analysis begins with a three-country, two-commodity economy, which can be expanded to the n commodity case. The offer curves of the rest of the world, Turkey, and the EU are denoted as ROW, TR, and EU, respectively. The offer curve of the EU with inclusion of
TR EU EU+TR UTR+EU UR OW RROW RTR+EU f W q q1 RO W ROW Im ports O (TR+EU ) Im ports
Turkey is also denoted by TR+EU. The trade indifference curves are denoted by UROW, and UTR+EU for the rest of the world and the EU with Turkey, respectively. Since the implications of an integration between Turkey and the EU is considered, individual trade indifference curves are combined for the sake of simplicity, and thus, the trade indifference curves of these countries are analyzed jointly. The free trade equilibrium will be point f. If ROW imposes its optimal tariff and the Expanded EU (EEU) trades freely, q will be the equilibrium point; and if the EEU imposes its optimal tariff and ROW trades freely, the equilibrium point will be q1.
If bargaining between ROW and the EEU fails in the second stage of the game, we need to determine the tariff reaction curves of each country. These curves are RROW and RTR+EU. The intersection of these curves, W, will be
the equilibrium point for tariff warfare. The quota warfare equilibrium is no trade at all (point O). In international trade, if there is no free trade agreement and/or integration, a protection imposed by a country is usually retaliated with an equivalent protection by other trading partners. As a result, the tariff warfare equilibrium point between ROW and the EEU will be point W.
The integration between Turkey and the EU will allow us to combine their offer curves. Turkey and the EU will not use any trade protection tools against each other, but put restrictions for the other countries (ROW). As Gul (1989) mentioned, this situation can be called partnership game. In other words, the EU and Turkey will act cooperatively regarding restrictions on others, but not on each other. The theoretical implication of this partnership game is an expectation of an increase in welfare for both EU and Turkey. B. The Empirical Model
The empirical model is an extended version of Kose (1996) and Yeldan (1997). The model has two important specifications. First of all, it considers imperfect competition in the Turkish manufacturing sector. With this important specification, the commodity market can be differentiated as perfect and imperfect competition, and highlights the policy implications in terms of these two criteria. Beverage, Tobacco, Petroleum, Class, Iron/Steel/Metal, Non-electrical Machinery, and Transport Equipment sectors are considered as monopolistic sectors. The second important specification of the model is to consider differentiated factors in the production process. As we know, capital and labor are used in the production process as primal factors. Labor is differentiated as “formal labor” and “marginal/informal labor” (Kose, 1996). With this specification we can analyze the basic characteristics of two different labor markets, and show the linkages between them. This specification becomes even more important when the cost of production is analyzed.
The decision processes of the model are differentiated as public and private, and Armington and small country assumptions are recognized
Vi AVi i s Li s i s Ki s
s
i i i
= {
∑
δ , ⋅ −,ρ +(1−∑
δ , ) −ρ}−1/ρthroughout the model. The import demand for each sector is determined in two stages. In the first stage, domestic production and sectoral import demands are solved in terms of relative prices and exchange rates. In the second stage, the import demand found in the first stage is differentiated into two origins: EU and non-EU imports. This differentiation in the imports in terms of origin makes the analysis of full access of Turkey into the EU much easier. Since Turkey has to remove all import duties levied on the EU commodities and not on non-EU commodities, the custom taxes collected from the EU countries and non-EU countries will be put into different categories in order to capture the impacts of the accession to the EU. However, our model is a static formulation of the general equilibrium modeling, and thus, it may not capture medium term dynamics.
The production technology is assumed to have multi-level constant elasticity of substitution (MLCES), and the intermediate input demand is defined as Leontieff technology, where inputs should be used in a constant proportional way to produce a certain amount of output. This technology can be formulated as: i i i i i i i i A V N Q
α
βα
β 1/β ) ). 1 ( . ( + − = − (1) where Ai represents the scale parameter showing the returns to scale, Virepresents value added factors (capital and labor), Ni represents composite
intermediate commodities,
α
i represents the distribution parameter,β
irepresents substitution parameter, and
ξ
i =1/(1+β
i) represents the elasticity of substitution between factors and intermediates.The value added factors in equation (1) can be expressed as follows:
(2)
where AVi represents the scale parameter, Li,s represents labor categories, Ki
represents capital,
δ
i,s represents share parameter, andϕ
i =1/(1+ρ
)i represents the elasticity of substitution between primal production factors (capital and labor).The subsequent step of the model is to determine the optimal factor use. The model considers four types of inputs: non-mobile capital, Leontieff technology intermediate input, marginal labor, and organized (formal) labor. Labor supply is assumed constant for both labor categories. Wages in the organized labor market are elastic. If the wage rate in this sector is sufficiently high with respect to the equilibrium level, the remaining excess supply of labor
enters the marginal labor market and creates unemployment in this sector As a result, the wage rate in the marginal labor market decreases (Kose, 1996).
The producers try to choose the optimal level of physical and intermediate inputs in order to minimize their production cost. If the prices and technological constraints are given, the optimum level of input choice of producers can be formulated as:
Min Pi.Qi(1−tax)=PVi.Vi +PNi.Ni (3) subject to Equation 1 and 2. In equation 3, Pi represents the price of good i, PVi
represents price of primary inputs, and PNi represents price of intermediate
inputs, and tax is the rate of tax that government imposes on firms. The rate of return for capital in each sector can be calculated as follow:
∑
− = s s s i s i i i i PV.Q L,λ
,Wϖ
(4) whereϖ
i represents sectoral returns of capital, Li,s represents labor categories,s i,
λ
represents wage differences between sectors for the same kind of labor force and shows the distortions in the labor markets, and Ws wage rates in thetwo labor categories. Within this framework, the prices in monopolistic sectors can be formulated in the following way:
Pi = (1+mi) . AVCi (5)
∑
+ = s ik is i i i W L PN N TVC (λ
, ) (6) AVCi = TVCi/Qi (1-taxi) (7) where AVC and TVC represent average and total variable costs respectively, and m stands for a constant that implies higher prices. This constant m implies that monopolistic sectors do produce under their full capacity and transmit the higher costs directly to consumers if the demand curve is sufficiently inelastic. Value added produced (Vi) in the monopolistic sectors is assumed a function of “capacity used ratio” (Ui). The capacity can be interpreted as the relationship between the changes in the market demands and value added produced in the market. This relationship can be expressed as:) , , ( F M i i U f K L L V = (8) where LF is formal labor, LM is marginal labor, and Ui = Capacity Used / Full
Capacity.
Consumers attempt to minimize their cost, and this minimization process can be formulated as:
MinPCi.CCi =PDi.DCi +PMi.Mi (9) subject to
(10)
where CCi, Mi and DCi represent composite commodity, imported commodity,
and domestically produced commodity, respectively; Ci represents a shift
parameter,
φ
i represents the share parameter and 1/(1+Νi) = Φi represents theelasticity of substitutions between domestic and imported goods. PD and PM represent domestic and imported good prices, respectively.
As mentioned earlier, exports and imports are distinguished in terms of their source, and assumed that they are limited substitutes for each other. The formulation of this process for imported goods is:
(11)
where MEU and MRW represents imports from the EU and imports from ROW, respectively; and
γ
i represents the share parameter,Ωirepresents the shift parameter, andε
i =1/(1+τ
i) represents the elasticity of substitution between different origin imported goods.Given different origin imported good prices and degree of elasticity of substitution, the optimization problem of the consumers follows:
MinPMi.Mi = PMEUi.MEUi +PMRWi.MRWi (12) subject to Equation 6. In Equation 12, PMRW and PMEU represent the import price of the rest of the world and the import price of the EU, respectively.
In the import side of the economy, a small country assumption and perfectly elastic EU and non-EU import supply assumptions are made. If the exchange rate (ER) and foreign trade taxes are known, the domestic market price of the commodities can be determined as follows:
ER tfeu tmeu PW PMEUi MEU i i i(1+ + ). = (13) ER tfrw tmrw PW PMRWi MRW i i i(1+ + ). = (14)
where PMEU, PMRW and PW stand for domestic price of EU imports, domestic price of ROW imports, and world price, respectively. The terms tmeu, tfeu, tmrw, and tfrw represent the EU and non-EU custom taxes and funds, respectively. Fund rates in the model indicate non–tariff barriers on imports. These rates are considered as exogenous and used as policy parameters in the model.
The export supply side of the model can be formulated similar to the import supply function:
(15) where Di represents the shift parameter, Ei represents the commodity
exported,
µ
i represents the share parameter, andς
i =1/(1+vi)represents the transformation elasticity. The maximization problem becomes:[
]
M
i=
Ω γ
i iMEU
i−τi+
(
1
−
γ
i)
MRW
i−τi −1/τiMax PQi · QSi = PDi · DCi + PEi · Ei (16) subject to equation 10.
Following the specification of the maximization problem, the origin of the exports must be determined. Since we have specified two different origins as exports to the EU and exports to the ROW, the Armington function for this problem can be formulated as:
i i i i i i i i i aEEU a ERW E
ψ
η η 1/η ] ) 1 ( [ − − − − + = (17)where EEUi and ERWi represent exports to the EU and ROW, respectively; ai
represents the share parameter;
ψ
irepresents the shift parameter, and )1 /(
1 i
i
η
ω
= + represents the elasticity of substitution between exported goods to different origins.The private income (YH) consists of gains from value added production from the private sector, transfers from government and the rest of the world, and factor incomes. The private sector value added can be obtained by subtracting government factor income and corporation tax.
YH = [(PVA · V) - FIG - TAXCAP] + T + (FIP - PTROW) ER (18) where FIG, and FIP represents factor income of the government and private
sector, respectively, TAXCAP represents corporation tax ratio, T represents
transfers to the private sector, PTROW represents private income transfers to the
ROW.
The public sector is another independent component of the economy. That is why the public sector should be considered carefully in order to make a model complete. Mis-specification of the public sector income creates serious drawbacks in the model. Public income is shown as:
GREV = TARIFF + TAXIND + TAXHH + TAXCAP + FIG + GFIROW · E (19) where GREV represents government revenue; TAXIND and TAXHH represent
indirect tax and income tax, respectively. Here TAXIND is the total tax in the
amount of PQ*Q*tax, and TAXHH is directly proportional to YH. GFIROW
represents the government’s factor income from the rest of the world. TARIFF is an advalorem type tax imposed on all goods and services imported into the country, and is an exogenous variable for our modeling purposes since they are determined by the international agreements.
III- Calibration and Data
The model calibration and benchmark equilibrium was obtained by using De Santis and Ozhan’s (1995) social accounting matrix (SAM) with certain modifications. When calibrating the scale and share parameters, we make use of Rutherford’s (1999) method implemented with GAMS/MINOS5 non-linear solver package. The model starts with a balanced Social Accounting matrix, which is considered as a reference equilibrium point of the model. The
elasticities needed for model calibration have been obtained from the available empirical studies such as Harrison et. al., (1996, 1993) and de Santis and Ozhan (1997).
Since the data used for the base year (1990) do not include quantities, only monetary data are used in the process. For that reason the most common method used is to assume that all prices are equal to one. In other words, physical quantities in the base solution are obtained by assuming the price level for each category is equal to unity. After determining the functional forms to be used in the model, the calibration process begins. Although there are different techniques to determine parameter values, the calibration method is the most appropriate technique, because it is much simpler and does not require econometric estimations.
In the first step of the calibration the matrix collects the quantities appearing in the equations. In the second step, relative prices in that year fix the slope of the isoquant at that point. The elasticities, which show the curvature of the isoquant are used in the last step of the calibration.
IV- Policy Scenarios
The simulation analysis has been conducted under the following four scenarios, through which changes in production cost and profitability in the Turkish economy can be investigated.
1) Customs Union with the EU: This scenario considers the obligations that Turkey and the EU have made, and assumes both sides fulfill their obligations. These obligations are determined by the European Council and Common External Tariff rules.
2) Full Membership to the EU: This scenario considers Turkey’s full accession
into the EU. According to the agreement between Turkey and the EU, Turkey will lower tariff rates for EU imports, but continue to impose higher tariff rate for the non-EU countries. This reduction in tariff rates causes the Turkish government to lose tariff revenues coming from the EU. However, the EU will compensate the Turkish government for a portion of these losses.
3) Full Membership plus Replacement Tax: This scenario analyzes the impacts
of full membership with the assumption of an increase in the domestic indirect tax rate. Under this scenario, government loss due to tariff reduction is compensated with an increase in the rate of indirect tax. By increasing indirect tax rate, the government can finance the budget deficit.
4) Free Trade: This scenario analyzes the option of free trade. Under this scenario, Turkey will reduce tariff rates for all countries. This reduction in tariff rates does not necessarily mean that tariff rates for all countries should be zero. Tariff rates on average should be asymptotically zero. The reductions are made not only in the tariff rates but also in non-tariff barriers such as funds should be eliminated completely under this scenario.
The customs union scenario assumes that import tariff rates on EU manufacturing goods are reduced completely, but the manufacturing and services sectors remained the same. However, import tariffs on non-EU goods are reduced by 30% in the agricultural sector and 40% in the manufacturing and services sectors. The full membership scenario requires complete elimination of tariffs on EU goods for all sectors. However, only 50% of tariffs will be reduced on non-EU goods. As can be expected, all tariffs are removed under the free trade scenario.
V. Sectoral Profit Rates and Cost Structure
This section analyzes both changes in profit rates and production costs under different integration policy scenarios. Two criteria have been used for sectoral profit analyses: profit-capital ratio for each individual sector and the change in sectoral profits with respect to base year. The reason a profit-capital ratio is used along with the change in sectoral profits is because it is easier to analyze real changes in profits with this ratio. Changes in average variable cost have been used to investigate the impacts of sectoral production costs under mentioned scenario assumption. This analysis has been done, because changes in cost structure will change the distribution of trade and affect domestic levels of production.
A. Customs Union Scenario:
A customs union will have impacts on all sectors. The following sectors will experience a decrease in profits: tobacco (-17.3%), transportation equipment (-8.2%), petroleum products (-4.1%), paper and publishing (-3.2%), services (-3%), and electrical machinery (-2.6%). Profit rates decreases in these sectors due to the high current protection levels in these sectors. Elimination of tariffs in the manufacturing sector results in an increase in the demand for imported goods. The domestic price of EU imported goods will be relatively lower than that of domestic goods. This situation causes a shift from domestic products to EU products in these sectors. However, domestic sectors experience profit increases with respect to their base year values. These profit increases take place for two reasons: i) increase in domestic demand and ii) increase in exports. Exports in all sectors increase with the customs union. Among these sectors, the highest profit increase can be seen in wearing apparel (11.8%), textiles (10.1%), mining (8.8%), leather and fur products (9.6%), and the metal industry (4.9%). The remaining sectors also experience profit increases, but the magnitude will be relatively smaller. The sectors experiencing higher profits are already very competitive in the international markets.
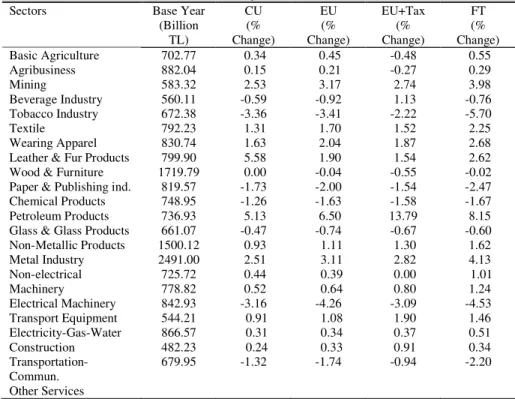
Table 1: Sectoral Average Variable Cost Structure
Sectors Base Year
(Billion TL) CU (% Change) EU (% Change) EU+Tax (% Change) FT (% Change) Basic Agriculture Agribusiness Mining Beverage Industry Tobacco Industry Textile Wearing Apparel Leather & Fur Products Wood & Furniture Paper & Publishing ind. Chemical Products Petroleum Products Glass & Glass Products Non-Metallic Products Metal Industry Non-electrical Machinery Electrical Machinery Transport Equipment Electricity-Gas-Water Construction Transportation-Commun. Other Services 702.77 882.04 583.32 560.11 672.38 792.23 830.74 799.90 1719.79 819.57 748.95 736.93 661.07 1500.12 2491.00 725.72 778.82 842.93 544.21 866.57 482.23 679.95 0.34 0.15 2.53 -0.59 -3.36 1.31 1.63 5.58 0.00 -1.73 -1.26 5.13 -0.47 0.93 2.51 0.44 0.52 -3.16 0.91 0.31 0.24 -1.32 0.45 0.21 3.17 -0.92 -3.41 1.70 2.04 1.90 -0.04 -2.00 -1.63 6.50 -0.74 1.11 3.11 0.39 0.64 -4.26 1.08 0.34 0.33 -1.74 -0.48 -0.27 2.74 1.13 -2.22 1.52 1.87 1.54 -0.55 -1.54 -1.58 13.79 -0.67 1.30 2.82 0.00 0.80 -3.09 1.90 0.37 0.91 -0.94 0.55 0.29 3.98 -0.76 -5.70 2.25 2.68 2.62 -0.02 -2.47 -1.67 8.15 -0.60 1.62 4.13 1.01 1.24 -4.53 1.46 0.51 0.34 -2.20
CU: Customs Union, EU: Full Membership, EU+Tax: Revenue Replacement Tax, and FT: Free Trade. The percentage changes are with respect to the base year values.
Under the customs union scenario, there will be a decrease in average variable cost (AVC) in a few sectors. However, this decrease is very small and can be ignored in most of the sectors. The largest decrease in the AVC is in the tobacco industry with 3.3% of its base value. The remaining sectors will experience either a very small decrease or increase in the average variable cost. The model considers capital as fixed so that the only variable cost for the producers is the labor payments. As can be seen in the Table 1, marginal labor using sectors such as mining (2.5%), metal (2.5%), and agriculture (0.34%) will have increases in the average variable cost due to wage rate increases in the marginal labor market. In addition, the cost structure of the same sectors that rely extensively on organized labor will change in a negative way. Although the average wage rate does not change in the organized labor market, the increases in the average costs of some sectors such as leather and fur products (5.5%) can be explained by an increased demand for marginal labor. The wage rate in the marginal labor market will increase with the custom union scenario. This will also be one of the reasons for increased cost because some of marginal labor
will be trained and move to the higher wage organized labor market. Moreover, due to an increased demand for organized labor in some sectors, producers might provide additional non-wage opportunities such as fewer and more flexible working hours, vacation opportunities and a better environment for qualified laborers. This may also be one of the reasons for average variable cost increases.
B. European Union Scenario (Full Access):
Full membership into the EU has similar, but much stronger impacts on the Turkish economy, because protection levels will be completely eliminated on EU products, and Common External Tariffs will be adopted for the ROW. This results in trade creating impacts on the Turkish economy, but the impact will be stronger on EU products. With this reality, profit rates increase in the competitive sectors, and decrease in the highly protected sectors. Profit losses can be seen in tobacco 17.5%), transportation equipment 11%), petroleum (-4.7%), and paper and publishing (-3.2%). The highest profit increases will be experienced in wearing apparel (14.6%), textiles (12.8%), leather and fur products (11.8%), and mining (11.1%). Table 2 shows sectoral profit rates and the results are consistent with sectoral profit-capital ratios shown in Table 3. Profit rate increasing sectors experience an increase in the profit-capital ratio, and profit decreasing sectors experience a decrease in the profit-capital ratio under all experiments. Thus, both tables indicate very similar results.
The full accession scenario implies that no trade barriers exist between Turkey and the EU. The average variable cost under this scenario will increase in many sectors. The reason for this is explained in the customs union scenario. Changes in the labor demand and wage rate affect the cost structure of the sectors. Under the full accession scenario, the average variable cost (AVC) will increase in all competitive sectors. However, previously monopolistic sectors (beverage, tobacco, glass products, and transportation equipment) experience a small decrease in average variable cost. The highest AVC increase can be seen in petroleum, with a rate of 6.5%; mining, and metal, with a rate of 3.1%; and metal, with a rate of 2.5%. The reason for the increase in average variable cost in the monopolistic sectors is because they don’t operate at their optimal point. Thus, when full membership exists, these sectors must become competitive in order to enter European markets.
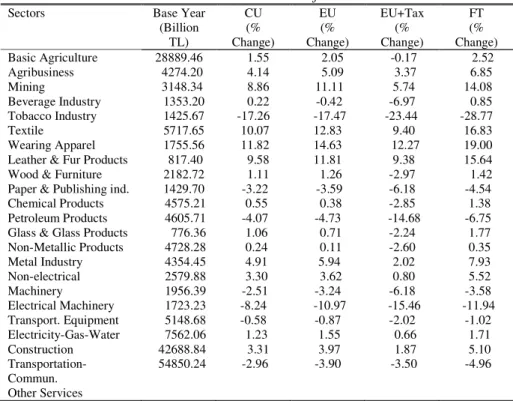
Table 2: Sectoral Profits
Sectors Base Year
(Billion TL) CU (% Change) EU (% Change) EU+Tax (% Change) FT (% Change) Basic Agriculture Agribusiness Mining Beverage Industry Tobacco Industry Textile Wearing Apparel Leather & Fur Products Wood & Furniture Paper & Publishing ind. Chemical Products Petroleum Products Glass & Glass Products Non-Metallic Products Metal Industry Non-electrical Machinery Electrical Machinery Transport. Equipment Electricity-Gas-Water Construction Transportation-Commun. Other Services 28889.46 4274.20 3148.34 1353.20 1425.67 5717.65 1755.56 817.40 2182.72 1429.70 4575.21 4605.71 776.36 4728.28 4354.45 2579.88 1956.39 1723.23 5148.68 7562.06 42688.84 54850.24 1.55 4.14 8.86 0.22 -17.26 10.07 11.82 9.58 1.11 -3.22 0.55 -4.07 1.06 0.24 4.91 3.30 -2.51 -8.24 -0.58 1.23 3.31 -2.96 2.05 5.09 11.11 -0.42 -17.47 12.83 14.63 11.81 1.26 -3.59 0.38 -4.73 0.71 0.11 5.94 3.62 -3.24 -10.97 -0.87 1.55 3.97 -3.90 -0.17 3.37 5.74 -6.97 -23.44 9.40 12.27 9.38 -2.97 -6.18 -2.85 -14.68 -2.24 -2.60 2.02 0.80 -6.18 -15.46 -2.02 0.66 1.87 -3.50 2.52 6.85 14.08 0.85 -28.77 16.83 19.00 15.64 1.42 -4.54 1.38 -6.75 1.77 0.35 7.93 5.52 -3.58 -11.94 -1.02 1.71 5.10 -4.96
CU: Customs Union, EU: Full Membership, EU+Tax: Revenue Replacement Tax, and FT: Free Trade. The percentage changes are with respect to the base year values. C. European Union plus Revenue Replacement Tax Scenario
The revenue replacement tax scenario will create a reduction in both profit rates and profit-capital ratios for all sectors compared to full membership assumptions. However, some sectors such as wearing apparel (12.2%), textiles (9.4%), mining (5.7%), and agribusiness (3.4%) still have profit increases compared to base year numbers. Again, these sectors already have a highly competitive structure in the world market. The remainder of the sectors experience profit decreases. The highest profit losses will be in the tobacco industry, with a rate of 23.5%; transportation equipment, with a rate of 15.5%; petroleum products, with a rate of 14.7%; electrical machinery, and paper, with a rate of 6.2%, and chemical products, with a rate of 3%. Other sectors experience small decreases in their profit rates.
Under this scenario, the average variable cost increases by 13.8% in the petroleum industry; 2.8% in the metal industry; 2.7% in the mining industry, 1.9% in the energy sector, 1.8% in wearing apparel, and 1.5% in the textile industry. Some of the sectors also experience a decrease in the average variable
cost. This shows that the tax burden imposed by the government is transmitted to the consumers in some sectors such as in the transportation equipment, tobacco, chemical products, and paper and publishing.
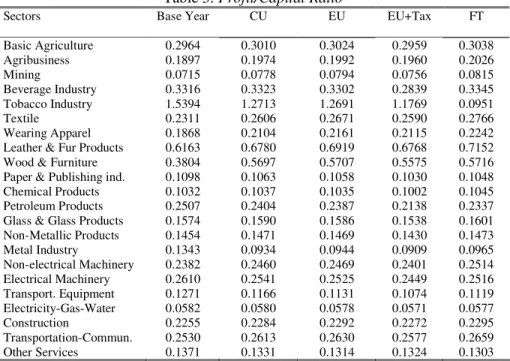
Table 3: Profit/Capital Ratio
Sectors Base Year CU EU EU+Tax FT
Basic Agriculture Agribusiness Mining Beverage Industry Tobacco Industry Textile Wearing Apparel Leather & Fur Products Wood & Furniture Paper & Publishing ind. Chemical Products Petroleum Products Glass & Glass Products Non-Metallic Products Metal Industry Non-electrical Machinery Electrical Machinery Transport. Equipment Electricity-Gas-Water Construction Transportation-Commun. Other Services 0.2964 0.1897 0.0715 0.3316 1.5394 0.2311 0.1868 0.6163 0.3804 0.1098 0.1032 0.2507 0.1574 0.1454 0.1343 0.2382 0.2610 0.1271 0.0582 0.2255 0.2530 0.1371 0.3010 0.1974 0.0778 0.3323 1.2713 0.2606 0.2104 0.6780 0.5697 0.1063 0.1037 0.2404 0.1590 0.1471 0.0934 0.2460 0.2541 0.1166 0.0580 0.2284 0.2613 0.1331 0.3024 0.1992 0.0794 0.3302 1.2691 0.2671 0.2161 0.6919 0.5707 0.1058 0.1035 0.2387 0.1586 0.1469 0.0944 0.2469 0.2525 0.1131 0.0578 0.2292 0.2630 0.1314 0.2959 0.1960 0.0756 0.2839 1.1769 0.2590 0.2115 0.6768 0.5575 0.1030 0.1002 0.2138 0.1538 0.1430 0.0909 0.2401 0.2449 0.1074 0.0571 0.2272 0.2577 0.1324 0.3038 0.2026 0.0815 0.3345 0.0951 0.2766 0.2242 0.7152 0.5716 0.1048 0.1045 0.2337 0.1601 0.1473 0.0965 0.2514 0.2516 0.1119 0.0577 0.2295 0.2659 0.1303 CU: Customs Union, EU: Full Membership, EU+Tax: Revenue Replacement Tax, and FT: Free Trade.
D. The Free Trade Scenario
The free trade scenario will create an increase in profit rates and profit-capital ratio for most of the sectors. However, due to elimination of all trade barriers, previously protected sectors will have profit losses. Higher profit losses will be seen in tobacco (28.8%), transportation equipment (11.9%), petroleum products (6.7%), services (5.0%), and paper and publishing (4.6%). Also, domestic production for these sectors decreases due to the higher quality of the EU products and lower prices of imported goods. The sectors experiencing profit increase are wearing apparel (19%), the textile industry (16.8%), leather and fur products (15.6%), mining (14.1%), and agribusiness (6.8%). The changes in the remaining sectors will be relatively small.
The free trade scenario and the full access scenario provide similar logical information for average variable cost structure of the Turkish economy. Fluctuations in the average variable cost are in the same direction with the full
membership scenario. However, the free trade scenario will have a greater impact on the cost of production.
VI- Conclusions
This paper examined the effect of full membership of Turkey to the EU in terms of cost of production and profitability. Since the full membership decisions are made politically, Turkish policy makers need to know how to concentrate their efforts over the transition period, and produce policies accordingly. In order to obtain the results sought, under the lights of neoclassical macroeconomic closure, a single country multi sectoral CGE model with implicit inclusion of the EU and ROW has been developed, and various policy scenarios were adopted.
With the different change rates, all competitive sectors will increase their profits shares, while monopolistic sectors will lose their profits. Although increased rates in sectoral average variable cost is higher under full membership scenario, sectoral profits increase as well. This is not a contradictory result, because increases in total production will allow Turkish producers to earn more on average. Turkish consumers, also, will enjoy buying various new and higher quality products at cheaper prices. The government will compensate its losses by receiving revenue assistance from the EU. Thus, the Turkish economy as a whole will be better off with a full membership, even though some sectors individually lose a portion of their profits.
References
Bekmez, S. (2002) “Sectoral Impacts of Turkish Access to the European Union: A Computable
General Equilibrium Analysis” Eastern European Economics, March-April 2002, Vol: 40 No: 2 pp: 57-84.
Bekmez, S, Genc, I. H. and Kennedy, P. L. (2002) “A Computable General Equilibrium
Model for the Organized and Marginal Labor Markets in Turkey”
Southwestern Economic Review, Spring 2002, vol: 29 No:1 pp: 97-109
de Santis, R. A. and Ozhan, H. G. (1997) “A Social Accounting Matrix for Turkey 1990.” Economic System Research, 9, 281-285.
de Santis, R. A. and Ozhan, H. G. (1995) “The Impacts of a Customs Union with the EU on Turkey’s Welfare, Employment and Income Distribution: An AGE Model with Alternative Labor Market Structures” Inforum Working Papers, Department of Economics of University of Maryland at College Park, n.1.
Gul, F. (1989) “Bargain Foundations of Sharpley Value” Econometrica (57), 81-95
Harrison, G. H., Rutherford, T. F., and Tarr, D. G. (1996) “Economic Implications for Turkey of a Customs Union with the European Union.”
World Bank Policy Research Working Papers, n.1599.
Harrison, G. H., Rutherferd, T. F., and Tarr, D. G. (1993) “Trade Reform in the
Partially Liberalized Economy of Turkey.” The World Bank Review
7(2), 191-217.
Kose, A. H. (1996) “Gumruk Birliginin Turkiye Ekonomisi Uzerine Etkileri: Bir Hesaplanabilir Genel Denge Modeli Calismasi” (The Impacts of the Customs Union on the Turkish Economy: A Computable General Equilibrium Analysis) Unpublished Ph.D. Dissertation, Ankara University, Sosyal Bilimler Enstitusu, Ankara.
Mercenier, J. and Yeldan, E. (1997) “On Turkey’s Trade Policy: Is a Customs Union with Europe Enough?” European Economic Review 41, 871-880. Musto, S. (1990) ΑTurkey and the European Community: Policies, Problems, and Future Aspects,≅ in Institutional Aspects of Economic Integration
of Turkey into the European Community, Evin, A. and Denton, G., eds,
Verleg Weltarchiv GmbH: Hamburg.
Rutherford, T. F. (1999) “Applied General Equilibrium Modeling with MPSGE as a GAMS Subsystem: An Overview of the Modeling Framework and Syntax” Computable Economics, 14, 1-46.
Sadoulet, E. and de Janvry, A. (1995) Quantitative Development Policy
Analysis. Johns Hopkins University Press: London.
Togan, S. (1994) Foreign Trade Regime and Trade Liberalization in Turkey
During the 1980s. Ashgate press: England.
Yeldan, A. E. (1997) “Financial Liberalization and Fiscal Repression on Turkey: Policy Analysis in a CGE Model with Financial Markets.”
Journal of Policy Modeling 19(1), 79-117.
Yeldan, E. A. (1986) ΑA Computable General Equilibrium Models for Development Policy Analysis.≅ Analysis.≅ Economic Development Center, University of Minnesota, Department of Economic, and Applied