Original Paper
tional License (CC BY-NC-ND) (http://www.karger.com/Services/OpenAccessLicense). Usage and distribution for commercial purposes as well as any distribution of modified material requires written permission.
Erythropoietin Protects the Kidney by
Regulating the Effect of TNF-α in
L-NAME-Induced Hypertensive Rats
a
Mete Ozkurt
aKubilay Uzuner
aNilufer Erkasap
bGokhan Kus
aRumeysa Ozyurt
cOnur Uysal
dIbrahim Akyazi
aOzden Kutlay
aDepartment of Physiology, Medical Faculty, Eskisehir Osmangazi University, Eskisehir, bDepartment
of Health, Program Open Faculty, Anadolu University, Eskisehir, cCellular Therapy and Stem Cell
Production, Application and Research Center ESTEM, Eskisehir Osmangazi University, Eskisehir,
dDepartment of Physiology, Veterinarian Faculty, Istanbul University, Istanbul, Turkey
Key Words
Darbepoetin-α • Erythropoietin • Hypertension • Kidney injury • Remicade • TNF-α
Abstract
Background/Aims: Hypertension is the leading cause of death worldwide. Chronic high blood pressure induces inflammation. Tumor necrosis factor (TNF)-α plays a major role in inflammation and also depresses the synthesis of erythropoietin, which exerts protective effects on tissue; however, the mechanism is still unclear. We investigated the protective effect of erythropoietin against tissue damage caused by hypertension in the kidney and whether this effect was suppressed by TNF-α. Methods: First, we detected the optimum chronic dose for darbepoetin-α (Depo), which is a long-acting erythropoietin analog for rats. We separated 60 female adult rats into 6 groups: control, Nω-nitro-L-arginine methyl ester hydrochloride (L-NAME), L-NAME+Depo, L-NAME+Remicade (an anti-TNF-α antibody), L-NAME+Depo+Remicade, Depo, and control. After 1 month of treatment, we measured cardiovascular parameters, took blood samples, sacrificed the rats, and removed kidneys for analyses. Results: The apoptotic index and the plasma and kidney mRNA levels of TNF-α increased in the L-NAME group and decreased in all other treatment groups. Macrophage
accumulationincreased in the L-NAME and L-NAME+Remicade groups, while it decreased in
the Depo group. The mRNA abundance of TNF receptor 1 (TNFR1) decreased slightly in the Depo groupand TNFR2 increased significantly in the same group. Conclusion: Erythropoietin protects kidney tissue against hypertension by preventing the apoptotic effects of TNF-α by blocking macrophage accumulation, decreasing TNF-α levels, and switching the TNF-α receptors from the apoptotic receptor TNFR1 to the proliferative receptor TNFR2.
Dr. Mete Ozkurt (PhD) Eskisehir Osmangazi Universitesi, Tip Fakültesi, Fizyoloji AD, 26480, Odunparazi, Eskisehir (Turkey) E-Mail [email protected]
© 2018 The Author(s) Published by S. Karger AG, Basel
Introduction
Worldwide, cardiovascular diseases are the leading cause of death, and hypertension
is the most common cardiovascular disease [1]. Studies aiming to maintain blood pressure
within physiological limits have used many different pharmacological agents, but it should
be debated whether these agents are beneficial in light of their many known side effects.
According to a report published in 2016, among the men and woman with hypertension,
uncontrolled high blood pressure is 58, 1% and 45, 5% respectively in USA [2].
The local and systemic inflammatory response to chronic high blood pressure in
hypertension causes degeneration in the kidney, leading to a worsening of hypertension. A
study by Gonzales et al. showed that urine tumor necrosis factor (TNF)-α levels were higher
in patients with hypertension and left ventricular hypertrophy than in healthy controls, and
this excess α was produced in the kidney [3]. A more recent study showed that
TNF-alpha plays an important role in kidney damage in a high fat diet model – which is one of
the main reason of hypertension- of mice [4]. Many studies have reported that hypertension
causes apoptosis in the heart, kidney, and brain, while TNF-α is thought to be responsible for
the induction of apoptosis in hypertension [5, 6].
TNF-α is a cytokine that plays a dominant role in the inflammatory response and is
synthesized by many cells, most commonly macrophages. The apoptotic and proliferative
effects of TNF-α are thought to be mediated through two distinct receptors; apoptosis is
induced when TNF receptor 1 (TNFR1) is stimulated, whereas proliferation occurs when
TNFR2 is stimulated [7]. Jelkmann reported that TNF-α suppresses erythropoietin (Epo)
synthesis in the kidney [8], which is considered to be the cause of the anemia that occurs
in chronic inflammatory diseases. La Ferla et al. reported that this effect was achieved via
nuclear factor (NF)-κB [9]. A more recent study by Rivkin et al. showed the inhibition of Epo
synthesis by NF-κB and TNF-α in different in vivo and in vitro models [10].
Epo, which is synthesized from peritubular fibroblasts in the kidney, is delivered to
the bone marrow through the blood circulation and induces erythropoiesis by stimulating
multipotent blood stem cells through the homodimer receptor EpoR. However, Epo protects
erythrocytes against apoptosis.
To date, Epo and EpoR mRNAs have been detected in many
tissues and organs, including cardiovascular organs, but the function of Epo in these tissues
and organs is not clear [11]. In a myocardial rat model generated by Lipsic et al., Epo, at a
dose that did not increase the hematocrit level, increased cardiovascular parameters and
suppressed caspase 3 activity [12]. Sharples et al., using an ischemia-reperfusion model in
rat kidney, showed that Epo protected the kidney in terms of urodynamic and histological
parameters and again suppressed caspase 3 activity [13]. Epo also increased the glomerular
filtration rate in the kidney according to a study performed by Uzuner et al. [14].
The kidney, which is a vital organ for the long-term regulation of blood pressure, is
responsible for the synthesis of Epo, even though the kidney has no role in erythropoiesis
during any stage of life. This role of Epo synthesis of the kidney is based on the fact that 20%
of the blood coming from the heart goes to the kidney, and the partial oxygen pressure in
the kidney tissue falls from 50 mmHg to 5 mmHg from the cortex to the medullary tissue,
making the kidney an ideal organ for monitoring tissue oxygenation [15]. Could it be that
the purpose of Epo synthesis in the kidney, which plays an important role in the long-term
regulation of blood pressure and is damaged by high blood pressure, is for the protection of
the kidney?
In this study, we investigated the protective effect of Epo against kidney damage caused
by hypertension and whether this effect was suppressed by TNF-α. For this reason, we
used darbepoetin-α (Depo), a long-acting Epo analog, at a dose that would not increase the
hematocrit value, and Remicade (Rem), an anti-TNF-α antibody, in a rat model of hypertension
Materials and Methods
The Eskisehir Osmangazi University Institutional Local Animal Care and Use Committee (302/2013) approved all experimental procedures. A total of 120 adult female rats (250–350 g) were purchased from the Medical and Surgical Experimental Research Center (TICAM/Eskişehir Osmangazi University) and housed at 22°C with lights on from 07:00 to 19:00 daily. All animals had free access to food and water. All injections were made via the intraperitoneal route.
Design
Dose study. To detect the appropriate dose of Depo (Aranesp; AMGEN, Thousand Oaks, CA, USA) we
randomly divided 60 female adult rats into 6 groups: L-NAME (20 mg/kg/day; Sigma Aldrich, St. Louis, MO, USA) alone, L-NAME + 0.1 µg/kg Depo, L-NAME + 0.25 µg/kg Depo, L-NAME + 0.5 µg/kg Depo, L-NAME + 2.5 µg/kg Depo, and L-NAME + 10 µg/kg Depo. Due to the half-life of Depo, it was injected once every 3 days. According to the survival and blood parameters, 0.25 µg/kg Depo was determined as the highest dose that did not change the blood parameters and was used as the treatment dose throughout the rest of the study (Table 1).
Treatment study. We randomly separated 60 female adult rats into 6 groups and we injected the study
drugs for 30 days: Control (1 mL/kg/day saline); L-NAME (20 mg/kg/day); L-NAME (20 mg/kg/day) + Depo (0.25 µg/kg once every 3 days); L-NAME (20 mg/kg/day) + Rem (5 mg/kg/day infliximab [Inf]; Janssen Biotech, Inc., Horsham, PA, USA); L-NAME (20 mg/kg/day) + Depo (0.25 µg/kg once every 3 days) + Rem (5 mg/kg/day); and Depo (0.25 µg/kg once every 3 days).
Surgical procedure
After 30 days of receiving the injections, the rats were anesthetized by intraperitoneal injection of 50 mg/kg ketamine hydrochloride (50 mg/mL Ketalar®; Parke-Davis, Istanbul, Turkey) and 10 mg/kg xylazine hydrochloride (23.32 mg/mL Rompun® 2%; Bayer, Istanbul, Turkey). Rectal temperature was maintained at 37 ± 0.5°C with a radiant heat lamp connected to a temperature controller. The left femoral vein and artery were cannulated with polyethylene-50 tubing. Systolic and diastolic blood pressure (SBP and DBP, respectively) were measured with a pressure transducer (Biopac Systems, Inc., Santa Barbara, CA, USA) and monitored, along with heart rate, using a data acquisition system (MP 100; Biopac Systems, Inc.). Mean arterial pressure was calculated using the formula (SBP + [2 × DBP])/3. At the end of the experiment, arterial blood samples were collected in EDTA tubes to assess complete blood count parameters and plasma TNF-α and Epo levels. We removed and weighed the right kidney. Then, we removed the left kidney and divided it longitudinally into two pieces; half of which was stored in formaldehyde for immunohistochemistry staining, while the other half was stored in TriPure solution (Roche Diagnostics, Mannheim, Germany) for TNF-α, TNFR1, TNFR2, and EpoR mRNA abundance analysis.
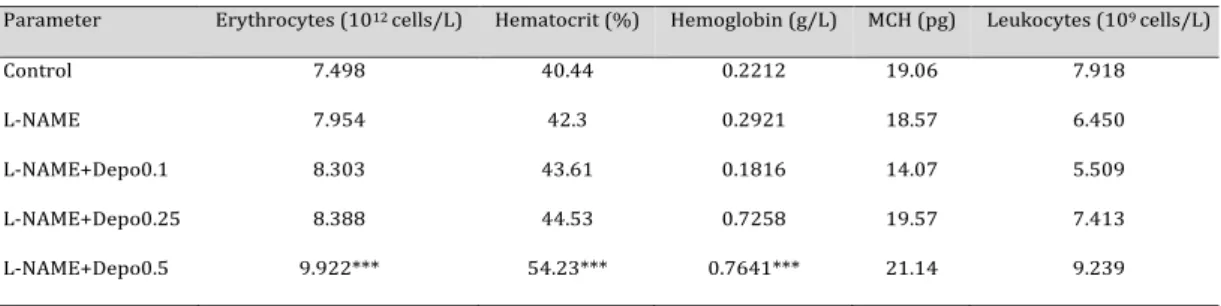
Table 1. Effect of different doses of Depo on rat blood parameters. The administration of 0.1 µg/kg and 0.5
µg/kg doses of Depo showed slight hematopoietic effects, while this increase was not significant; however, a 0.5 µg/kg dose of Depo significantly increased erythrocyte, hematocrit, and hemoglobinvalues. We found that the 0.25 µg/kg dose of Depo was the highest dose that does not affect hematopoiesis. MCH: mean corpuscular hemoglobin n = 10; ***P < 0.001
1
Parameter Erythrocytes (1012 cells/L) Hematocrit (%) Hemoglobin (g/L) MCH (pg) Leukocytes (109 cells/L)
Control 7.498 40.44 0.2212 19.06 7.918
L-NAME 7.954 42.3 0.2921 18.57 6.450
L-NAME+Depo0.1 8.303 43.61 0.1816 14.07 5.509
L-NAME+Depo0.25 8.388 44.53 0.7258 19.57 7.413
Determination of Epo and TNF-α plasma concentrations by enzyme-linked immunosorbent assay
Plasma Epo and TNF-α concentrations were determined using commercially available rat-specific enzyme-linked immunosorbent assay (ELISA) kits (Eastbiopharm, Hangzou, China and Affymetrix, Santa Clara, CA, USA, respectively) as recommended by the manufacturers. Concentrations were calculated using a plate reader system (RT-2100C; Rayto, Shenzhen, China).
Measurement of blood parameters
Blood samples were collected in EDTA tubes and homogenized for 5 min. Complete blood count parameters were measured using a blood analyzer system (Abacus Junior Vet Blood System; Diatron, Budapest, Hungary).
Measurement of Epo, TNF-α, TNFR1, and TNFR2 mRNA levels by using quantitative reverse transcription PCR
Total RNA was isolated from kidney tissue stored at -80°C in TriPure solution. Total RNA concentrations were measured using a NanoDrop 1000 (Thermo Scientific, Waltham, MA, USA). The RNA was diluted to approximately 1000 µg/mL. cDNA was synthesized from each RNA sample using a thermal cycling machine and a reverse transcriptase cDNA synthesis kit (Roche Nano Lightcycler; Roche Diagnostics) according to the manufacturer’s instructions. Epo, TNF-α, TNFR1, and TNFR2 mRNA levels were analyzed using β-actin as a reference gene. FAM-labeled primers/probes of the target genes and reference gene were amplified in a 20-μL reaction volume in 0.2-mL PCR tubes. Amplification was detected by using Dual Label TaqMan probes, and the measurements were performed using a Nano LightCycler (Roche Diagnostics). Final calculations were performed using the 2-ΔΔct relative quantification method.
Immunohistochemical detection of tissue injury, ED-1, NF-κB, and apoptotic cell index
Excised right kidney tissue was fixed in a 10% neutral-buffered formalin solution. Kidney tissue was dehydrated in a graded alcohol series and embedded in paraffin. The sections (3 µm) were stained with hematoxylin and eosin (H&E). The sections were examined in the cortex and medulla for glomerular damage, tubular damage, vascular injury, and interstitial inflammation.
Kidney sections (3 µm) were stained with periodic acid-Schiff’s (PAS) stain to show polysaccharides, neutral mucopolysaccharides, and glycoproteins in epithelial tubular membranes and to identify glomerulosclerosis. The sections were treated with periodic acid for 5 min and washed with distilled water. Subsequently, the sections were incubated with Schiff’s reagent for 15 min and counter-stained with hematoxylin for 30 s. Kidney sections were also stained with Masson’s trichrome, which stains collagen-rich areas in blue and cellular elements in red.
For ED-1 staining, 5-μm sections were taken from formalin-fixed and paraffin-embedded tissues and stained with avidin-biotin complex after antigen retrieval. Endogenous peroxidase activity was blocked with 10% horse serum (ScyTek Laboratories, Logan, UT, USA). To assess macrophage infiltration, the sections were incubated with a monoclonal mouse anti-rat ED1 antibody (1:200 dilution; Serotec, Raleigh, NC, USA). The results were scored semi-quantitatively in the perivascular and peritubular areas: 0, none; 1, mild distribution; 2, medium distribution; and 3, severe distribution.
For immunohistochemical staining of NF-κB, after the sections (3 µm) were deparaffinized and rehydrated, 3% H2O2 was added to methanol to block endogenous peroxidase activity. The sections were
then incubated with goat serum (1:5 dilution; Dakopatts, Milan, Italy), and incubated overnight at 4°C with an anti-NF-κB antibody (rabbit polyclonal, 1:50 dilution; Santa Cruz Biotechnology, Dallas, TX, USA). The sections were washed in a 0.1 M Tris buffer solution (pH 7.4) and incubated with avidin-biotin horseradish peroxidase complex (ABC kit; Dakopatts). The sections were immersed in 0.05% of 3, 3′-diaminobenzidine tetrahydrochloride and 0.03% H2O2. All sections were counterstained with hematoxylin, dehydrated, and
covered. Control reactions were assessed in the absence of the primary antibody. Cellular distribution in the glomerulus, tubular epithelial cells, infiltrated cells, endothelium, and vein wall were scored semi-quantitatively as: 0, none; 1, mild distribution; 2, medium distribution; and 3, severe distribution.
The degree of apoptotic cell death was assessed using an in situ cell assay kit (ApopTag Plus Peroxidase Kit, Cat. No. 7101; Chemicon International, Temecula, CA, USA). Tubular epithelial nuclei in 4-μm sections obtained from the right kidney were labeled with the TUNEL method. Brown-stained nuclei were accepted
2
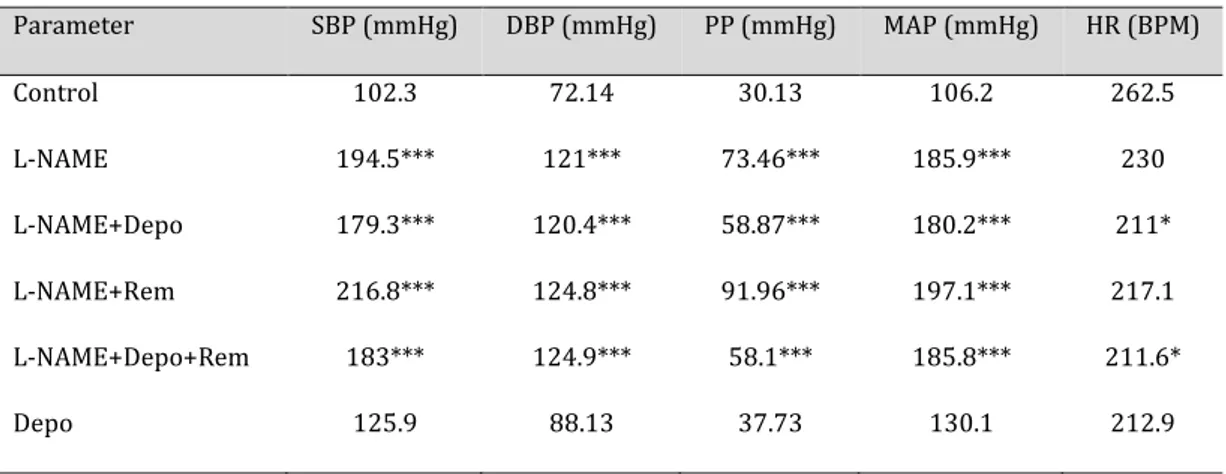
Parameter SBP (mmHg) DBP (mmHg) PP (mmHg) MAP (mmHg) HR (BPM) Control 102.3 72.14 30.13 106.2 262.5 L-NAME 194.5*** 121*** 73.46*** 185.9*** 230 L-NAME+Depo 179.3*** 120.4*** 58.87*** 180.2*** 211* L-NAME+Rem 216.8*** 124.8*** 91.96*** 197.1*** 217.1 L-NAME+Depo+Rem 183*** 124.9*** 58.1*** 185.8*** 211.6* Depo 125.9 88.13 37.73 130.1 212.9as TUNEL-positive. TUNEL-positive nuclei in the cortex were counted in 10 randomly selected optical fields with a ×40 lens. The apoptotic index of the counted nuclei was calculated as: apoptotic index = (number of TUNEL-positive tubular epithelial nuclei)/(number of total tubular epithelial nuclei).
Statistical analysis
Statistical analysis was performed by using GraphPad software. Data are presented as the mean ± standard error of the mean or median (25%, 75%). The data were analyzed by the Kruskal-Wallis test or one-way analysis of variance with a post hoc Tukey’s or Dunn’s test. Differences with P-values < 0.05 were considered significant.
Results
Systolic, diastolic, mean arterial, and pulse pressures were increased in all of the
L-NAME-treated groups, and heart rate was decreased in only the L-NAME+Depo groups
(Table 2).
Glomerular hypertrophy, glomerular fibrosis, glomerulosclerosis, and fibrinoid
necrosis detected by H&E staining were increased in the L-NAME-treated groups, except the
L-NAME+Depo+Rem group (Fig. 1). Collagen accumulation shown by Masson’s trichrome
staining was increased in the L-NAME-treated groups; however, in the L-NAME+Depo+Rem
group, this accumulation showed a slight decrease in comparison with the other
L-NAME-treated groups (Fig. 2).
Tissue injury parameters detected by PAS staining were seen in different degrees in all of
the groups, except the control group. There was a slight decrease of tissue injury parameters
in the Depo- and Rem-treated groups in comparison with the L-NAME group, but this did not
reach statistical significance (Fig. 3).
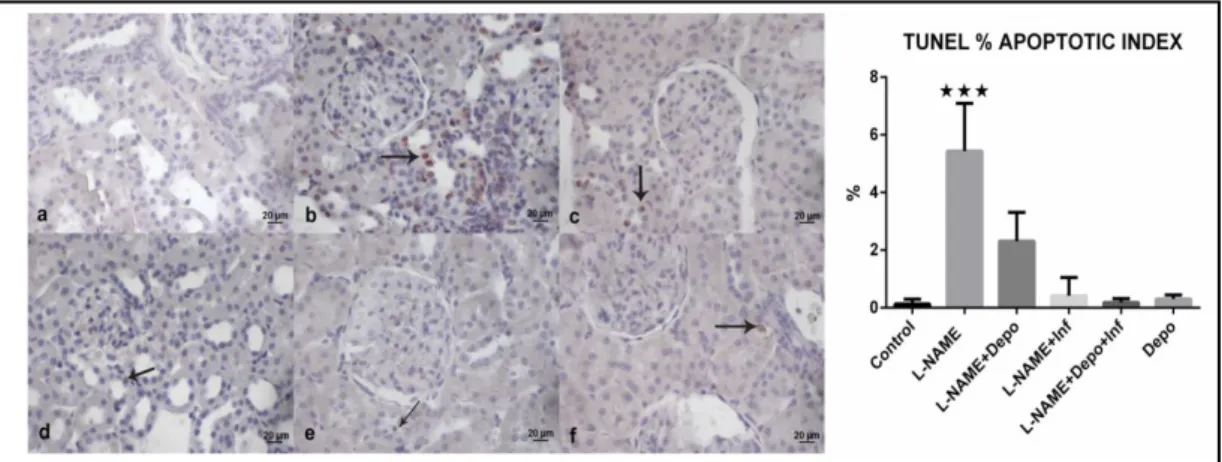
The apoptotic index was increased in the L-NAME group, but it was decreased in all
treatment groups (Fig. 4). As measured by ED-1 staining, macrophage accumulation, which
causes an increase in TNF-α levels, was increased in the L-NAME and L-NAME+Rem groups
(Fig. 5).
Table 2. Cardiovascular changes in the groups. L-NAME increased all blood pressure parameters. The
Depo-alone group showed a slight increase in these parameters, but not significantly so. Heart rate decreased in the L-NAME+Depo-treated rats.SBP: systolic blood pressure; DBP: diastolic blood pressure; PP: pulse pressure; MAP: mean arterial pressure; HR: heart rate; BPM: beats per minute. n = 10; *P < 0.05; ***P < 0.001
Fig. 1. H&E staining of kidney tissue.
a) Normal view of kidney cortex in the control group. b) Glomerulosclerosis (asterisk), a protein cast (arrowhead), and sloughing of tubular epithelial cells (arrow) at the cortex in the L-NAME group. c) A protein cast (asterisk) and sloughing of tubular epithelial cells (arrow) at the cortex in the L-NAME+Depo group. d) Sloughing of tubular epithelial cells (arrow) and a protein cast (asterisk) at the cortex in the L-NAME+Rem group.
e) Sloughing of tubular epithelial cells (arrow) and tubular vacuolization (arrowhead) at the cortex in the L-NAME+Depo+Rem group. f) Sloughing of tubular epithelial cells (arrowhead) and a protein cast (asterisk) at the cortex in the Depo group. Glomerular injury indicating a significant increase of glomerular hypertrophy, glomerular fibrosis, glomerulosclerosis, and fibrinoid necrosis in the L-NAME-treated groups, except the L-NAME+Depo+Rem group, suggesting that there may be a synergistic effect on glomerular injury parameters. 40× magnification; scale bar: 10 µm.
Figure H&E staining of kidney tissue
Fig. 2. Masson’s trichrome staining
of kidney tissues. a) Normal view of kidney cortex in the control group. b) Accumulation of collagen (arrow) at the cortex in the L-NAME group. c) Accumulation of collagen (arrow) at the cortex in the L-NAME+Depo group. d) Accumulation of collagen (arrow) at the cortex in the L-NAME+Rem group. e) Accumulation of collagen (arrow) at the cortex in the L-NAME+Depo+Rem group. f) Accumulation of collagen (arrow) at the
cortex in the Depo group. Collagen accumulation shown by Masson’s trichrome staining was increased in the L-NAME-treated groups. However, in the L-NAME+Depo+Rem group, this accumulation showed a slight decrease in comparison with the L-NAME-treated groups. 20× magnification; scale bar: 20 µm.
Figure Masson’s trichrome staining of kidney tissues.
Fig. 3. PAS staining of kidney tissue.
a) Normal view of kidney cortex in the control group. b) Separation from the basal membrane (arrow head) and a hyaline cast (asterisk) at the cortex in the L-NAME group. c) Separation from the basal membrane (arrowhead), a hyaline cast (asterisk), and basal membrane thickening (arrow) at the cortex in the L-NAME+Depo group. d) A hyaline cast (asterisk), separation from the basal membrane (arrowhead), and basal membrane thickening (arrow)
at the cortex in the L-NAME+Rem group. e) Separation from the basal membrane (arrow) at the cortex in the L-NAME+Depo+Rem group. f) Separation from the basal membrane (arrow) and basal membrane thickening (arrowhead) at the cortex in the Depo group. Tissue injury parameters detected by PAS staining were observed at different levels in all groups, except the control group. There was a slight decrease in the tissue injury parameters in the Depo- and Rem-treated groups in comparison with the L-NAME group, but this did not reach statistical significance. 40× magnification; scale bar: 10 µm.
NF-κB was increased in all groups, except the L-NAME+Rem group (Fig. 6). Although
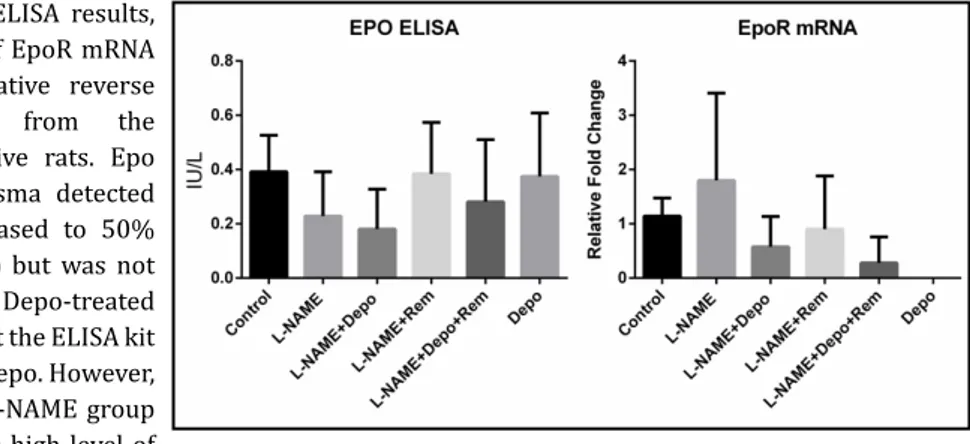
ELISA showed no significant difference between the groups, Epo was decreased to 50% in
the L-NAME group compared with the control group. However, blockage of TNF-α in the
L-NAME+Rem group increased the level of Epo to that of the control group. The lack of an
increase in Epo in the Depo-treated groups may be because of the insensitivity of the
anti-Epo antibody to Depo (Fig. 7).
The plasma TNFα concentration detected by ELISA and the mRNA abundance of TNF-α
were increased by 3-fold in the L-NAME group compared with the control group, and were
decreased in the L-NAME+Depo group below the level of the control group (Fig. 8).
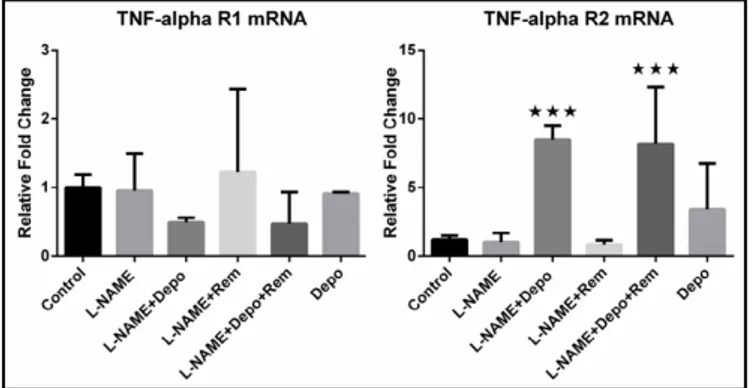
The mRNA level of TNFR1, which stimulates apoptosis, was decreased by 50% in the
L-NAME+Depo groups compared to the control group, but this did not reach statistical
significance (Fig. 9). Conversely, the level of TNFR2 mRNA, which stimulates anti-apoptotic
pathways, was increased significantly in the L-NAME+Depo groups (Fig. 9). The level of EpoR
mRNA was increased slightly in the L-NAME group due to an increased demand for Epo, and
Fig. 4. TUNEL staining and % apoptotic index of kidney tissue. a) Normal view of kidney cortex in the
control group. b) Apoptotic cells (arrow) at the cortex in the L-NAME group. c) Apoptotic cells (arrow) at the cortex in the L-NAME+Depo group. d) Apoptotic cells (arrow) at the cortex in the L-NAME+Rem group. e) Apoptotic cells (arrow) at the cortex in the L-NAME+Depo+Rem group. f) Apoptotic cells (arrow) at the cortex in the Depo group. Amount of apoptotic cells, stained red, was increased significantly in the L-NAME group, while treatment with Depo and/or Rem decreased the number of apoptotic cells significantly to the control level. 20× magnification; scale bar, 20 µm; n = 10; ***P<0.001.
Figure 4. TUNEL staining and ap ptotic index of kidney tissue
Fig. 5. ED-1 staining view of kidney tissue.
a) ED1(+) cells showing a mild distribution at the peritubular area in the control group (arrow). b) ED1(+) cells showing a moderate distribution at the peritubular area in the L-NAME group (arrow). c) ED1(+) cells showing a mild distribution at the peritubular area in the L-NAME+Depo group (arrow). d) ED1(+) cells showing a severe distribution at the peritubular area in the L-NAME+Rem group (arrow). e) ED1(+) cells showing a mild distribution
at the peritubular area in the L-NAME+Depo+Rem group (arrow). f) ED1(+) cells showing a moderate distribution at the peritubular area in the Depo group (arrow). Macrophage accumulation detected by ED-1 staining showed a significant increase in the L-NAME and L-NAME+Rem groups. Depo treatment in the L-NAME+Depo, L-NAME+Depo+Rem, and Depo groups decreased macrophage accumulation to the control level. 40× magnification; scale bar: 10 µm; n = 10.
as this demand was not present in the Depo-treated groups, the level of EpoR mRNA was
decreased in these groups, but not significantly so (Fig. 7).
Fig. 7. Epo plasma ELISA results,
and the abundance of EpoR mRNA detected by quantitative reverse transcription PCR from the kidney of hypertensive rats. Epo concentration in plasma detected by ELISA was decreased to 50% in the L-NAME group but was not increased in the Depo-treated groups, indicating that the ELISA kit was not sensitive to Depo. However, the decrease in the L-NAME group may be related to the high level of
TNF-α in that group. Epo mRNA abundance was decreased in all Depo-treated groups. n = 10.Fi ure . Epo plasma ELISA results, and the abundance of EpoR mRNA detected bquantitative reverse tr nscription PCR fr m the kidney of hypertensive rats.
Fig. 8. ELISA results for plasma
TNF-α, and TNF-α mRNA abundance detected by quantitative reverse transcription PCR from the kidney of hypertensive rats. Plasma TNF-α concentration was increased by 2-fold in the L-NAME group and was decreased to the control level in the Depo- and/or Rem-treated groups. However, these changes were not significant. Similar to the ELISA, TNF-α mRNA was increased by 2-fold in the L-NAME group and
was decreased in the treatment groups. n = 10.
Fi ure . ELISA results for plasma TNF-α, and TNF-α mRNA abundance detected by quantitative reverse tr nscription PCR fr m the kidney of hypertensive rats
Fig. 6. NF-κB staining of kidney tissue.
a) NF-κB(+) cells showing a severe distribution at the glomerulus (arrowhead) and tubular epithelial cells (arrow) in the control group. b) NF-κB(+) cells showing a moderate distribution at the tubular epithelial cells (arrow) in the L-NAME group. c) NF-κB(+) cells showing a severe distribution at the tubular epithelial cells (arrow) in the L-NAME+Depo group. d) NF-κB(+) cells showing a moderate distribution at the tubular epithelial cells (arrow) in the L-NAME+Rem group. e)
NF-κB(+) cells showing a severe distribution at the tubular epithelial cells (arrow) in the L-NAME+Depo+Rem group. e) NF-κB(+) cells showing a moderate distribution at the tubular epithelial cells (arrow) in the Depo group. The level of NF-κB was increased in all groups, except the L-NAME+Rem group, in comparison to the control group. 40× magnification; scale bar: 10 µm; n = 10.
Discussion
Chronic high blood pressure causes the emergence of an inflammatory response [3,
16]. TNF-α, secreted from active macrophages, causes apoptosis that is characterized by
tissue degeneration in the kidney, as seen in many other organs,
as well as inhibition of
Epo secretion from the kidney. In the L-NAME-induced hypertension rat model,
both the
blockade of TNF-α and the endogenous Epo-analog Depo inhibited apoptosis and preserved
kidney tissue damage.
Although many studies on Depo have been conducted, our study is the first to report
a chronic dose of Depo in rats that does not affect blood parameters. Initially, we assessed
5 different doses of Depo according to previous studies [17, 18]. The 2.5 µg/kg and 10 µg/
kg dose groups did not survive for 30 days, while the 0.5 µg/kg dose group did survive, but
had a significant increase in erythrocyte, hematocrit, and hemoglobin parameters (Table 1).
Therefore, we determined that the highest chronic dose of Depo that does not affect blood
parameters in rats was 0.25 µg/kg. Body and kidney weights did not show any significant
changes, except in the Depo alone-treated group (Table 3). Treatment with Depo alone
increased body weight significantly, which was consistent with previous studies [19].
As in many chronic hypertension models, we inhibited nitric oxide (NO) synthesis with
L-NAME for 30 days. Operative approaches to induce hypertension, such as the Goldblatt
method, cause direct damage to the kidney [20]. The progression of renal failure is reported
in spontaneous hypertensive rats and rats given DOCA or a high-salt diet [21]. NO is one of
the key elements in inflammation and is known to have tissue protective properties [22].
However, NO also has a dual effect as it induces peroxynitrite synthesis. Wang et al. reported
that the synthesis of high levels of NO by endothelial cells and macrophages causes adrenal
insufficiency [23]. TNF-alpha is one of the key elements triggering NO production. Therefore,
blocking TNF-alpha while blocking NO production allows the impact of Epo to be seen more
clearly. We suggest that a hypertension method deemphasizing this dual effect of NO is the
most advantageous for a study focusing on tissue protection parameters.
Increased stress in hypertension leads to an increase in reactive oxygen species, which
impair the vascular endothelium. The lipoproteins that pass into the subendothelial tissue
from damaged vascular endothelium are oxidized and stimulate TLR4 receptors on T cells,
and the interferons secreted by the stimulated T cells enable the activation and accumulation
of macrophages in the tissue. TNF-α, released intensely from macrophages, suppresses the
synthesis of Epo, which is synthesized mainly in the kidneys. Although Epo has been shown
to have a tissue protective effect in many studies, the mechanism has not been explained
fully [24, 25].
Oxidative stress triggers apoptosis and NF-κB activation [26, 27]. Hypertension increases
the level of NF-κB, which is evident in the kidney [28]. High levels of NF-κB may be related to
apoptosis; however, an anti-apoptotic effect of NF-κB has also been shown. This dual effect
is thought to be related to cell type and stimulant. NF-κB shows its anti-apoptotic effect by
decreasing caspase 3 levels (Fig. 6) [26, 27].
Fig. 9. mRNA abundance of TNFR1
and TNFR2 from kidney detected by quantitative reverse transcription PCR. mRNA abundance of TNFR1, which is the apoptotic receptor of TNF-α, was decreased by 50% in the L-NAME+Depo groups, while there was a significant increase in the mRNA abundance of TNFR2, which is the proliferative receptor for TNF-α, in the same groups. n = 10; ***P<0.001.
Fi ure mRNA abundance of TNFR1 and TNFR2 fr m kidney detected b quantitative reverse tr nscription PCR
Even
though
histological tissue
injury parameters,
such as glomerular
injury, collagen
accumulation, or
basal membrane
separation, were
present in all groups,
except the control
group, the TUNEL
results showed that
the large number
of apoptotic cells
detected in the
L-NAME group was
decreased in all treatment groups, suggesting that Epo treatment and TNF-α blockage
protected the kidney against apoptosis (Figures 1, 2, 3, 4). The high levels of NF-κB in the
Epo-treated groups may suggest that NF-κB exerts an anti-apoptotic effect in those groups.
The suppressive effect of TNF-α on Epo synthesis was reported by Jelkmann et al. [29],
who revealed why anemia appears in patients with chronic inflammatory diseases. However,
the association of TNF-α with the protective effect of Epo on the kidney, which has been shown
in many different studies, was shown in vivo
for the first time in the present study. A different
approach by Rivkim et al., who blocked microRNA-122, indicating that this microRNA is the
responsible element for depressing Epo synthesis during inflammation [10]. We blocked
TNF-α with an antibody, which is used for the treatment of chronic inflammatory diseases,
and increased the level of Epo with a simpler approach than that used by Rivkim et al.
In this study, the plasma TNF-α concentration increased in the L-NAME-treated group
compared to the control group (Fig. 8). This result was consistent with the level of TNF-α
mRNA detected in the kidney (Fig. 8). In the present L-NAME-induced hypertension
model, the amount of TNF-α increased in the plasma and kidney. In addition, macrophage
accumulation in the kidney tissue determined by ED-1 staining was increased in the
L-NAME-treated group, suggesting the source of the increased TNF-α (Fig. 5). The amount of
Epo measured in plasma decreased in the L-NAME group, and increased to the control level
in the TNF-α-suppressed Rem-treated groups (Fig. 7). Plasma Epo concentration did not
change in the Depo-treated groups due to the lack of a Depo-sensitive ELISA. These results
show that in the L-NAME-induced rat hypertension model, macrophage accumulation and
increased level of TNF-α in the kidney were caused by inflammation, and the increased level
of TNF-α suppressed endogenous Epo synthesis.
EpoR mRNA is upregulated by decreased
stimulation of EpoR by Epo (and Depo). Therefore, the increased EpoR mRNA seen in the
L-NAME model would be expected because of the increased TNF-alpha and decreased Epo
levels. Furthermore, the decrease in EpoR mRNA in the L-NAME + Depo group seen in Fig. 7
supports increased stimulation of EpoR despite the decreased Epo levels seen in that group
in Fig. 7.
The decreased levels of TNF-α in the Depo-treated groups may be due to the effects
of Epo on macrophage accumulation. The decreased accumulation of macrophages in the
Depo-treated groups, as detected with ED-1 staining, caused TNF-α to decrease both in
the tissue and plasma in these groups. Wang et al. showed that Epo inhibited macrophage
accumulation by suppressing the expression of various adhesion molecules [30]. Villa et al.
showed that Epo inhibits the diapedesis of monocytes and macrophage transformation by
suppressing monocyte chemoattractant protein-1 [31]. In accordance with these studies,
our findings showed that Epo inhibited macrophage accumulation in vivo.
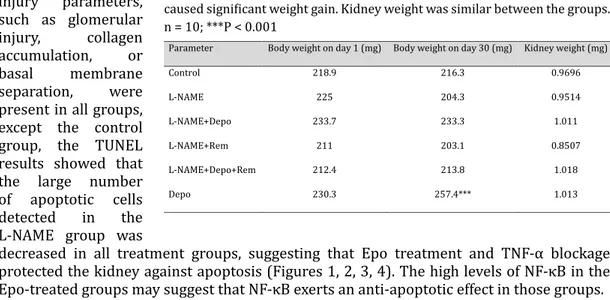
Table 3. Body and kidney weight changes in the groups. Depo or Rem given
together with L-NAME did not cause weight gain in the rats, while Depo alone caused significant weight gain. Kidney weight was similar between the groups. n = 10; ***P < 0.001
3
Parameter Body weight on day 1 (mg) Body weight on day 30 (mg) Kidney weight (mg)
Control 218.9 216.3 0.9696 L-NAME 225 204.3 0.9514 L-NAME+Depo 233.7 233.3 1.011 L-NAME+Rem 211 203.1 0.8507 L-NAME+Depo+Rem 212.4 213.8 1.018 Depo 230.3 257.4*** 1.013
Previous studies have shown that the different effects of TNF-α can be achieved through
two distinct receptors [32, 33]. While TNFR1 activates apoptotic mechanisms, TNFR2
promotes a protective and proliferative effect. In our study, TNFR1 mRNA abundance
decreased by 50% in the L-NAME+Depo-treated groups, while TNFR2 mRNA abundance was
significantly elevated in the same groups (Fig. 9). We hypothesize that the tissue protective
effect of Depo might be related to the regulation of TNF-α receptors in favor of TNFR2.
Conclusion
Besides the many unresolved issues in the tissue protective or non-hematopoietic effects
of Epo, we showed that Epo and TNF-α interact in hypertension-induced inflammation
in an in vivo
experimental rat model. We suggest that Epo prevents the accumulation of
macrophages, thereby inhibiting the effect of TNF-α, and Epo also regulates TNF-α receptors
by increasing TNFR2 transcription and decreasing TNFR1 transcription. In conclusion, Epo
has a crucial role in the maintenance of normal kidney function. In another words, decreasing
kidney tissue Epo levels leads to the kidney tissue damage observed in hypertension.
Acknowledgements
We thank Professor Wolfgang Jelkmann (University of Luebeck, Institute of Physiology)
for his support. This study was supported by a grant (no: 2013-84) from the Eskisehir
Osmangazi University Scientific Research Projects Committee, Turkey.
Author contributions: Mete Ozkurt: conceived the study; assisted with methodology;
collected data; performed project administration; performed data analysis; wrote the
original draft; and wrote, reviewed, and edited subsequent drafts. Kubilay Uzuner:
conceived the study, assisted with methodology, collected data, revised the manuscript, and
acquired funding. Nilufer Erkasap: conceived the study, assisted with methodology, revised
the manuscript. Gokhan Kus: collected data. Rumeysa Ozyurt: collected data. Onur Uysal:
collected data and assisted ith methodology. Ibrahim Akyazi: collected data. Ozden Kutlay:
collected data.
Disclosure Statement
The authors declare no competing financial interests.
References
1 Montecucco F, Pende A, Quercioli A, Mach F: Inflamation in the pathophysiology of essential hypertension. J
Nephrol 2011;24:23-34.
2 US Department of Health and Human Services: Health, United States, 2016. 2016. URL: https://www.cdc.
gov/nchs/data/hus/hus16.pdf
3 Gonzalez JFN, Mora C, Muros M, Jarque A, Herrera H, Garcia J: Association of tumor necrosis
factor-alpha with early organ damage in newly diagnosed patients with essential hypertension. J Hypertens 2008;26:2168-2175.
4 Wang H, Li J, Gai Z, Kullak-Ublick GA, Liu Z: TNF-alpha Deficiency Prevents Renal Inflammation and
Oxidative Stress in Obese Mice. Kidney Blood Press Res 2017;42:416-427.
5 Hamet P, Richard L, Dam TV, Teiger E, Orlov SN, Gaboury L, Gossard F, Tremblay J: Apoptosis in target
6 Gobe G, Browning J, Howard T, Hogg N, Winterford C, Cross R: Apoptosis occurs in endothelial cells during hypertension-induced microvascular rarefaction. J Struct Biol 1997;118:63-72.
7 Kishore R, Tkebuchava T, Sasi SP, Silver M, Gilbert HY, Yoon YS, Park HY, Thorne T, Losordo DW, Goukassian
DA: Tumor necrosis factor-alpha signaling via TNFR1/p55 is deleterious whereas TNFR2/p75 signaling is protective in adult infarct myocardium. Adv Exp Med Biol 2011;691:433-448.
8 Jelkmann W: Proinflammatory cytokines lowering erythropoietin production. J Interferon Cytokine Res
1998;18:555-559.
9 La Ferla K, Reimann C, Jelkmann W, Hellwig-Burgel T: Inhibition of erythropoietin gene expression
signaling involves the transcription factors GATA-2 and NF-kappaB. FASEB J 2002;16:1811-1813. 10 Rivkin M, Simerzin A, Zorde-Khvalevsky E, Chai C, Yuval JB, Rosenberg N, Harari-Steinfeld R, Schneider
R, Amir G, Condiotti R, Heikenwalder M, Weber A, Schramm C, Wege H, Kluwe J, Galun E, Giladi H: Inflammation-Induced Expression and Secretion of MicroRNA 122 Leads to Reduced Blood Levels of Kidney-Derived Erythropoietin and Anemia. Gastroenterology 2016;151:999-1010.e3.
11 Jelkmann W, Elliott S: Erythropoietin and the vascular wall: the controversy continues. Nutr Metab Cardiovasc Dis 2013;23:S37-43.
12 Lipsic E, Schoemaker RG, van der Meer P, Voors AA, van Veldhuisen DJ, van Gilst WH: Protective effects of erythropoietin in cardiac ischemia: from bench to bedside. J Am Coll Cardiol 2006;48:2161-2167. 13 Sharples EJ, Patel N, Brown P, Stewart K, Mota-Philipe H, Sheaff M, Kieswich J, Allen D, Harwood S, Raftery
M, Thiemermann C, Yaqoob MM: Erythropoietin protects the kidney against the injury and dysfunction caused by ischemia-reperfusion. J Am Soc Nephrol 2004;15:2115-2124.
14 Uzuner K, Yazihan, N, Aydin Y, Uyar R, Bagla S: Acute Erythropoietin Infusion Increases Rat Glomerular Filtration Rate by Partly Stimulating Intrarenal Nitric Oxide Production. J Health Sci 2004;50:343-347. 15 Wenger RH, Hoogewijs D: Regulated oxygen sensing by protein hydroxylation in renal
erythropoietin-producing cells. Am J Physiol Renal Physiol 2010;298:F1287-1296.
16 Dorffel Y, Latsch C, Stuhlmuller B, Schreiber S, Scholze S, Burmester GR, Scholze J: Preactivated peripheral blood monocytes in patients with essential hypertension. Hypertension 1999;34:113-117.
17 Frenay AR, Ruifrok WP, Bulthuis M, Huitema S, de Boer RA, van Goor H: Renal effects of long-term darbepoetin alpha treatment in hypertensive TGR(mRen2)27 rats. J Renin Angiotensin Aldosterone Syst 2012;13:232-238.
18 Gao E, Boucher M, Chuprun JK, Zhou RH, Eckhart AD, Koch WJ: Darbepoetin alfa, a long-acting
erythropoietin analog, offers novel and delayed cardioprotection for the ischemic heart. Am J Physiol Heart Circ Physiol 2007;293:H60-68.
19 Fatouros M, Dalekos GN, Mylonakis E, Vekinis G, Kappas AM: Alterations in body weight, breaking strength, and wound healing in Wistar rats treated pre- and postoperatively with erythropoietin or granulocyte macrophage-colony stimulating factor: evidence of a previously unknown anabolic effect of erythropoietin? J Lab Clin Med 1999;133:253-259.
20 Manpreet Kaur ACR, Sunil Kumar: INDUCTION OF HYPERTENSION BY VARIOUS ANIMAL MODELS. International Journal of Pharmacy and Biological Sciences 2011;1:335-340.
21 Pinto YM, Paul M, Ganten D: Lessons from rat models of hypertension: from Goldblatt to genetic engineering. Cardiovasc Res 1998;39:77-88.
22 Radi R, Peluffo G, Alvarez MN, Naviliat M, Cayota A: Unraveling peroxynitrite formation in biological systems. Free Radic Biol Med 2001;30:463-488.
23 Wang CN, Duan GL, Liu YJ, Yu Q, Tang XL, Zhao W, Li XH, Zhu XY, Ni X: Overproduction of nitric oxide by endothelial cells and macrophages contributes to mitochondrial oxidative stress in adrenocortical cells and adrenal insufficiency during endotoxemia. Free Radic Biol Med 2015;83:31-40.
24 Gholamzadeh A, Amini S, Mohammadpour AH, Vahabzadeh M, Fazelifar AF, Fazlinezhad A, Dehghani M, Moohebati M, Dastani M, Malaekeh-Nikouie B, Falsoleiman H: Erythropoietin Reduces Post-PCI Arrhythmias in Patients With ST-elevation Myocardial Infarction. J Cardiovasc Pharmacol 2015;65:555-561. 25 Jun JH, Jun NH, Shim JK, Shin EJ, Kwak YL: Erythropoietin protects myocardium against
ischemia-reperfusion injury under moderate hyperglycemia. Eur J Pharmacol 2014;745:1-9.
26 Spandou E, Tsouchnikas I, Karkavelas G, Dounousi E, Simeonidou C, Guiba-Tziampiri O, Tsakiris D: Erythropoietin attenuates renal injury in experimental acute renal failure ischaemic/reperfusion model. Nephrol Dial Transplant 2006;21:330-336.
27 Quiroz Y, Bravo J, Herrera-Acosta J, Johnson RJ, Rodriguez-Iturbe B: Apoptosis and NFkappaB activation are simultaneously induced in renal tubulointerstitium in experimental hypertension. Kidney Int Suppl 2003;64:S27-32.
28 Wu KI, Schmid-Schonbein GW: Nuclear factor kappa B and matrix metalloproteinase induced receptor cleavage in the spontaneously hypertensive rat. Hypertension 2011;57:261-268.
29 Jelkmann W, Pagel H, Wolff M, Fandrey J: Monokines inhibiting erythropoietin production in human hepatoma cultures and in isolated perfused rat kidneys. Life Sciences 1991;50:301-308.
30 Wang J, Toba H, Morita Y, Nakashima K, Noda K, Tian W, Kobara M, Nakata T: Endothelial dysfunction, macrophage infiltration and NADPH oxidase-dependent superoxide production were attenuated by erythropoietin in streptozotocin-induced diabetic rat aorta. Pharmacology 2013;91:48-58.
31 Villa P, Bigini P, Mennini T, Agnello D, Laragione T, Cagnotto A, Viviani B, Marinovich M, Cerami A, Coleman TR, Brines M, Ghezzi P: Erythropoietin selectively attenuates cytokine production and inflammation in cerebral ischemia by targeting neuronal apoptosis. J Exp Med 2003;198:971-975.
32 Ji W, Li Y, Wan T, Wang J, Zhang H, Chen H, Min W: Both internalization and AIP1 association are required for tumor necrosis factor receptor 2-mediated JNK signaling. Arterioscler Thromb Vasc Biol 2012;32:2271-2279.
33 Kelly ML, Wang M, Crisostomo PR, Abarbanell AM, Herrmann JL, Weil BR, Meldrum DR: TNF receptor 2, not TNF receptor 1, enhances mesenchymal stem cell-mediated cardiac protection following acute ischemia. Shock 2010;33:602-607.