Genome analysis
RBPSponge: genome-wide identification of
lncRNAs that sponge RBPs
Saber HafezQorani
1,†, Aissa Houdjedj
2,†, Mehmet Arici
3,
Abdesselam Said
3and Hilal Kazan
2,3,*
1
Department of Health Informatics, Graduate School of Informatics, Middle East Technical University, Ankara
06800, Turkey,
2Graduate School of Electrical and Computer Engineering and
3Department of Computer
Engineering, Antalya Bilim University, Antalya 07190, Turkey
*To whom correspondence should be addressed.
†The authors wish it to be known that, in their opinion, the first two authors should be regarded as Joint First Authors. Associate Editor: John Hancock
Received on September 4, 2018; revised on January 3, 2019; editorial decision on May 20, 2019; accepted on May 28, 2019
Abstract
Summary: Long non-coding RNAs (lncRNAs) can act as molecular sponge or decoys for an
RNA-binding protein (RBP) through their RBP-binding sites, thereby modulating the expression of all
target genes of the corresponding RBP of interest. Here, we present a web tool named RBPSponge to
explore lncRNAs based on their potential to act as a sponge for an RBP of interest. RBPSponge
identi-fies the occurrences of RBP-binding sites and CLIP peaks on lncRNAs, and enables users to run
statis-tical analyses to investigate the regulatory network between lncRNAs, RBPs and targets of RBPs.
Availability and implementation: The web server is available at https://www.RBPSponge.com
.
Contact: [email protected]
Supplementary information:
Supplementary data
are available at Bioinformatics online.
1 Introduction
Eukaryotic genomes encode for thousands of long non-coding RNAs (lncRNAs); however, their functions are largely unknown
cit-eplncrna (Kopp and Mendell, 2018). Recent studies revealed that
some lncRNAs can function as microRNA (miRNA) sponges (Militello et al., 2017). These lncRNAs contain several miRNA-binding sites and the resulting competition restricts miRNA’s avail-ability to bind its own targets. In turn, miRNA’s activity is sup-pressed. A similar relationship has been recently discovered between lncRNAs and RNA-binding proteins (RBPs). For instance, a highly conserved cytoplasmic lncRNA, NORAD, contains several function-al binding sites for the two mammfunction-alian Pumilio homologs (i.e.
PUM1 and PUM2) (Lee et al., 2016;Tichon et al., 2016). NORAD
sequesters PUM1/PUM2 molecules and modulates the expression of
their target genes. Similarly,Kim et al. (2016) has been shown that
the lncRNA OIP5-AS1 sponges ELAVL1 in HeLa cells. Last,Chiu
et al. (2018) performed extensive computational analyses on The Cancer Genome Atlas (TCGA) datasets where several candidate sponge lncRNAs are predicted for RBPs.
A number of tools are available to identify lncRNAs that can act
as miRNA sponges (Furio-Tari et al., 2016). There are also tools to
map RBP-binding sites on lncRNAs (e.g.Wu et al., 2018); however,
they do not evaluate the enrichment and distribution of binding sites or the regulatory relationship between the lncRNA and RBP target background genes. As such, tools that explore lncRNAs that could function as RBP sponges are still lacking. Here, we introduce a web tool named RBPSponge that explores lncRNAs based on their poten-tial to act as a sponge for an RBP of interest. RBPSponge leverages several types of data such as RBP binding preferences, CLIP datasets and gene expression data. In addition to identifying the occurrences of RBP-binding sites on lncRNAs, RBPSponge runs several types of analyses to evaluate the sponge potential of lncRNAs.
2 Data and methods
Human RBPs with known existing binding preferences are compiled by merging position weight matrices (PWMs) from three
compendi-ums: RNAcompete (Ray et al., 2013), RBNS (Dominguez et al.,
VCThe Author(s) 2019. Published by Oxford University Press. All rights reserved. For permissions, please e-mail: [email protected] 1 Bioinformatics, 2019, 1–4
doi: 10.1093/bioinformatics/btz448 Advance Access Publication Date: 31 May 2019
2017) and RBPmap (Paz et al., 2014). These RBPs are further fil-tered by selecting those with CLIP data compiled from ENCODE
eCLIP datasets (van Nostrand et al., 2016) and CLIPdb database
(Yang et al., 2015) (seeSupplementary Table S1for the complete list of CLIP datasets). In total 40 RBPs are retained after these steps.
2.1 Identifying potential lncRNAs that sponge RBPs
The top 3 scoring k-mers were determined for each PWM to repre-sent the set of binding motifs for the RBP. For RBPs with multiple PWMs, the union of top 3 scoring k-mers is used as the set of binding motifs. lncRNA sequences (exon regions only) that are downloaded from GENCODE database (v25lift37) are scanned for k-mer occurrences. To evaluate the significance of RBP motif occur-rences in lncRNA sequences two metrics are calculated: log-odds(LOD) score and dispersity score (Furio-Tari et al., 2016).
LOD score evaluates the enrichment of RBP-binding sites on an lncRNA. To obtain the LOD score for an lncRNA/RBP pair, we cal-culate the number of motif occurrences across each sliding window
(of size w) of the lncRNA sequence. Assuming that nt;w;icorresponds
to the number of occurrences of binding motifs within the window
that starts at position i of lncRNA t, nmax
t;w is defined as maxðnt;w;1;
nt;w;2; ::;nt;w;lÞ where l is the starting position of the last sliding win-dow within the lncRNA. The sliding winwin-dow approach enables the identification of the window with maximum number of motif
occur-rences. nmax
t;w is then normalized by the average maximum number of
occurrences of the same set of binding motifs across all lncRNAs:
LODt;w¼
nmax
t;w
ðPjnmaxj;wÞ=N
; (1)
where N is the number of all lncRNAs. LOD score is calculated with varying window sizes (from 50 to 1000 nt in steps of 50 nt) and the window size with the largest LOD score is reported. Avoiding the use of a fixed window size enables a robust motif en-richment analysis for lncRNAs of varying length. LncRNAs with high LOD scores contain an enrichment of binding sites for the RBP
of interest compared with other lncRNAs (Supplementary Fig. S2).
The second metric which is named dispersity score evaluates the clustering of motif occurrences within the sequence. To calculate the dispersity score of an lncRNA/RBP pair, we build a vector of
nor-malized nmax
t;w values across all window sizes:
xt¼ 50 nmax t;50 ;100 nmax t;100 ; . . . ;1000 nmax t;1000 ! : (2)
Then, the dispersity score for lncRNA t is calculated as the
stand-ard deviation of vector xt. Smaller dispersity scores correspond to a
more even distribution of motif occurrences across the sequence. Equal distribution of motifs are observed for lncRNAs that sequester
miRNAs (Memczak et al., 2013) and we hypothesize that lncRNAs
that sequester RBPs show a similar property. In summary, LOD score focuses on the number of binding sites whereas dispersity score focuses
on the distribution of these binding sites (Supplementary Fig. S2).
We define threshold values for the LOD/dispersity scores by finding the scores at the 95% percentile of the distribution of all possible RBP–lncRNA pairs. This resulted in the values 1.6 and 36 for LOD score and dispersity score, respectively.
To incorporate experimental binding data, CLIP peaks that are located within lncRNAs are determined. Last, gene expression data-sets are compiled to assess the regulatory network between lncRNAs, RBPs and their target genes. The following datasets are used: (i) GTEX; (ii) E-MTAB-2706; and (iii) E-MTAB-2770.
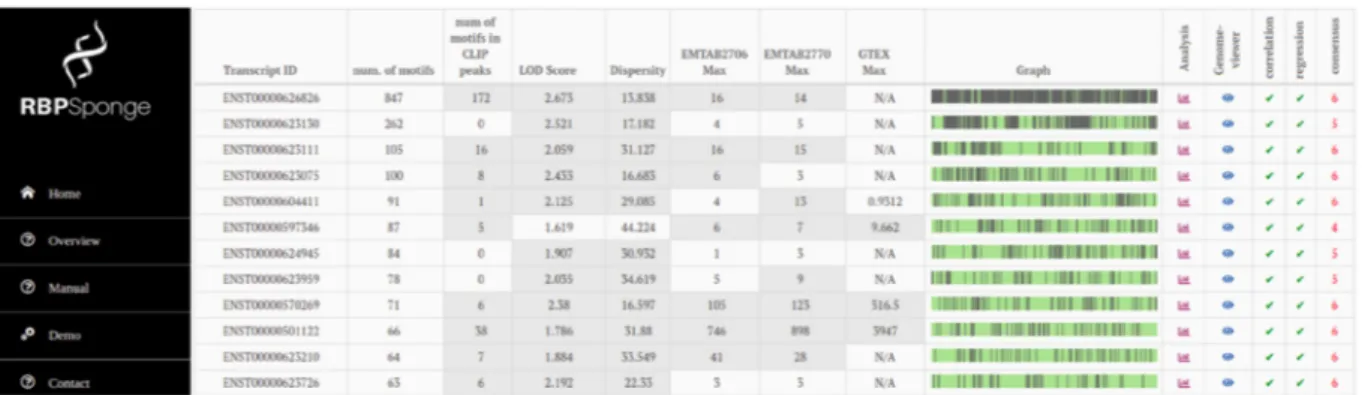
Utilizing all these resources, the following information is displayed
for each RBP–lncRNA pair (Fig. 1):
• number of non-overlapping motif occurrences in the entire
lncRNA sequence
• number of non-overlapping motif occurrences within the CLIP
peaks that are located in the lncRNA
• LOD enrichment score of motif frequencies
• dispersity score
• number of eCLIP/CLIPdb peaks
• median and maximum expression value across the samples
avail-able in GTEX, E-MTAB-2706, E-MTAB-2770 datasets
• consensus score
The consensus score is calculated by counting the number of sat-isfied constraints listed below:
• LOD score > 1.6
• dispersity score < 36
• existence of at least one motif in eCLIP or CLIPdb peak
• maximum expression > 5 Transcripts Per Million (TPM) in at
least one dataset
• correlation analysis gives a P-value < 0.05 in at least one dataset
• regression analysis gives a P-value < 0.05 in at least one dataset
As each positive check increases the consensus score by 1, con-sensus scores range between 0 and 6. The results are displayed in decreasing order of consensus scores.
2.2 Identifying target and background gene sets
for each RBP
Target and background genes sets of RBPs are needed for the statis-tical analyses implemented by RBPSponge. The user can either up-load these gene sets or use our pre-defined gene lists. To define these lists of genes for each RBP, gene annotation files are downloaded
from GRCh37 assembly of Ensembl (Release 87) and the longest 30
-untranslated region (30-UTR) isoform is determined for each gene.
All 30-UTRs are scanned with the set of k-mers that are determined
for each RBP. 30-UTRs are also intersected with CLIP peaks to
deter-mine overlaps as the presence of a CLIP peak strongly suggests that the region is bound by the RBP of interest.
Data from shRNA knockdown assays are downloaded from
ENCODE project (i.e. seeSupplementary Table S1for the complete
list). For these assays, log fold changes (LFCs) are calculated using
DeSeq2 methodLove et al. (2014). For ELAVL1, knockdown
data-set fromMukherjee et al. (2011)is used as knockdown assay data
for ELAVL1 was not available in ENCODE project.
We defined the target set as those genes that satisfy the following conditions: (i) occurrence of at least one CLIP peak; (ii) occurrence of one of the top 3 scoring k-mers within a CLIP peak; and (iii) has an LFC value that has an adjusted P-value < 0.05 as calculated by DeSeq2 for knockdown datasets.
Similarly, we defined the background set as those genes that satisfy the following conditions: (i) no CLIP peak occurrence; (ii) no occur-rence of top 3 scoring k-mers; and (iii) significant LFC value in knock-down datasets. We also ensured that the background genes are length-matched to target genes such that there is no statistically significant dif-ference in distribution of length between target set and background set.
3 Analysis
The expression values of the lncRNA and the RBP across the sam-ples of the selected dataset are displayed with bar plots. This is an
2 S.HafezQorani et al.
important sanity check as most lncRNAs have low abundance com-pared with other molecules in the cell and this might prevent them to act as molecular decoys for RBPs. In addition to this, three types of analyses are performed (scripts are available on github page:
https://github.com/rbpsponge/RBPsponge).
In the first analysis, we investigate how the expression of the lncRNA co-varies with the expression of target genes of the RBP. To as-sess the distribution of correlation coefficient values that we obtain with target genes, we repeat the same analysis with a set of background genes as a control. If the lncRNA acts as a decoy for the RBP of interest, RBP activity is reduced and the expression levels of its target genes are affected. In summary, we calculate the Spearman correlation coefficient between the expression values of the lncRNA and the expression values of each gene in the target/background set. We compare the distribution of correlation values of target and background genes with Wilcoxon rank-sum test and also display them with a box plot.
In the second analysis, we assess whether lncRNA expression has added predictive value in addition to RBP expression in determining the expression levels of target genes. If the lncRNA affects the activity of the RBP as a decoy, including lncRNA expression should improve the performance. To this end, we perform a simple linear regression analysis to predict target gene expression where in one case only RBP expression is used and in the other case both RBP and lncRNA expressions are used as features. We calculate the Spearman correl-ation values between actual and predicted expression values of target genes on held-out datasets using 10-fold cross-validation. If the lncRNA of interest acts as a sponge for the RBP, we expect to see an improved predictive performance when lncRNA expression is included as an additional feature. The significance of change is eval-uated with Wilcoxon rank-sum test and likelihood-ratio test.
In the third analysis, we look into the expression changes upon the knockdown of the lncRNA of interest, when available. Because lncRNA activity is minimized we expect to see an increased RBP ac-tivity and a more pronounced effect (either stabilizing or de-stabilizing) on the expression of target genes. To this end, we com-pare the distribution of expression changes of target and back-ground genes with a cumulative distribution frequency (CDF) plot. Wilcoxon rank-sum test is used to assess the significance between the two distributions.
4 Example run
As input, user selects an RBP of interest and optionally uploads a set of target and background genes for this RBP. As output, a table is
displayed where each row corresponds to an lncRNA and columns display the number of motifs, number of CLIP peaks etc. (as
described in Section 2.1 andFig. 1). The graphical representation on
the right part displays the positions of motif occurrences within that lncRNA as vertical bars. Motifs and CLIP peaks can be also explored within an integrated genome viewer that is displayed as a
pop-up window (Supplementary Fig. S1).
When the analysis button is clicked, a multi-tab page is displayed where each tab corresponds to a different analysis. For example, when E-MTAB-2706 dataset is chosen for PUM2 (RBP)–NORAD (lncRNA) pair, expression values of PUM2 and NORAD across the tissues are displayed in the first and second
tab, respectively (Supplementary Fig. S2A and B). In the third
tab, the box plot shows that NORAD expression is correlated higher with target genes compared with the background genes (Supplementary Fig. S2C). In the fourth tab, we observe that including NORAD in addition to PUM1/PUM2 expression
improves the prediction performance significantly (Supplementary
Fig. S2D). Last, the CDF plot in the last tab shows that PUM2 tar-get genes are stabilized more upon the knockdown of NORAD (Supplementary Fig. S2E).
Funding
This work was supported by European Union [FP7 Marie Curie CIG grant 631986 to H.K.].
Conflict of Interest: none declared.
References
Chiu,H. et al. (2018) Pan-cancer analysis of lncRNA regulation supports their targeting of cancer genes in each tumor context. Cell Rep., 23, 297–312.
Dominguez,D. et al. (2017) Sequence, structure and context preferences of human RNA binding proteins. Mol. Cell, 70, 854–867.
Furio-Tari,P. et al. (2016) spongeScan: a web for detecting microRNA binding elements in lncRNA sequences. Nucleic Acids Res., 44, W176–80. Kim,J. et al. (2016) LncRNA OIP5-AS1/cyrano sponges RNA-binding protein
HuR. Nucleic Acids Res., 44, 2378–2392.
Kopp,F. and Mendell,J.T. et al. (2018) Functional classification and experi-mental dissection of long noncoding RNAs. Cell, 172, 393–407.
Lee,S. et al. (2016) Noncoding RNA NORAD regulates genomic stability by sequestering PUMILIO proteins. Cell, 164, 69–80.
Love,M. et al. (2014) Moderated estimation of fold change and dispersion for RNA-seq data with DESeq2. Genome Biol., 15, 550.
Fig. 1. Screenshot from RBPSponge website. Putative sponge lncRNAs for PUM2 are listed in a table where columns display information on motif occurrences and CLIP peaks
RBPSponge 3
Memczak,S. et al. (2013) Circular RNAs are a large class of animal RNAs with regulatory potency. Nature, 495, 333–338.
Militello,G. et al. (2017) Screening and validation of lncRNAs and circRNAs as miRNA sponges. Brief Bioinform., 18, 780–788.
Mukherjee,N. et al. (2011) Integrative regulatory mapping indicates that the RNA-binding protein HuR couples pre-mRNA processing and mRNA sta-bility. Mol. Cell, 43, 327–339.
Paz,I. et al. (2014) RBPmap: a web server for mapping binding sites of RNA-binding proteins. Nucleic Acids Res., 42, W361–W367.
Ray,D. et al. (2013) A compendium of RNA-binding motifs for decoding gene regulation. Nature, 499, 172–177.
Tichon,A. et al. (2016) A conserved abundant cytoplasmic long noncoding RNA modulates repression by Pumilio proteins in human cells. Nat. Commun., 7. doi: 10.1038/ncomms12209.
van Nostrand,E.L. et al. (2016) Robust transcriptome-wide discovery of RNA-binding protein binding sites with enhanced CLIP (eCLIP). Nat. Methods, 13, 508–514.
Wu,S. et al. (2018) circlncRNAnet: an integrated web-based resource for map-ping functional networks of long or circular forms of noncoding RNAs. Gigascience, 7, 1–10.
Yang,Y. et al. (2015) CLIPdb: a CLIP-seq database for protein-RNA interac-tions. BMC Genomics, 16, 51.
4 S.HafezQorani et al.