Vibrational Spectroscopy 111 (2020) 103148
Available online 10 September 2020
0924-2031/© 2020 Elsevier B.V. All rights reserved.
2’-methylklavuzon causes lipid-lowering effects on A549 non-small cell
lung cancer cells and significant changes on DNA structure evidenced by
fourier transform infrared spectroscopy
Cagatay Ceylan
a,*
, Hatice Nurdan Aksoy
b, Ali Cagir
c, Hakkı Çetinkaya
caDepartment of Food Engineering, ˙Izmir Institute of Technology, Urla, 35430, ˙Izmir, Turkey bDepartment of Biotechnology, ˙Izmir Institute of Technology, ˙Izmir, Turkey
cDepartment of Chemistry, ˙Izmir Institute of Technology, ˙Izmir, Turkey
A R T I C L E I N F O Keywords:
2’-methylklavuzon
Fourier transform infrared (FTIR) A549 cells
Non-Small cell lung cancer (NSCLC) Topoisomerase 1 inhibitor CRM1 inhibitor
A B S T R A C T
Various chemical agents are used in the treatment of Non-Small Cell Lung Cancer (NSCLC). 2′-methylklavuzon was proposed as a potential chemotherapeutic agent in cancer treatment based on its topoisomerase inhibition activity. In this study the cellular effects of 2′-methylklavuzon was evaluated on A549 cancer cells using FTIR spectroscopy. 2′-methylklavuzon induced significant changes on both the whole cell lyophilizates and the lipid extracts of the A549 lung cancer cells. 2′-methylklavuzon caused significant structural changes in A549 cell DNA structure: T, A and G DNA breathing modes are lost after the drug application indicating the loss of topoisom-erase activity. The level of transcription and RNA synthesis was enhanced. 2′-methylklavuzon induced single stranded DNA formation evidenced by the increase in the ratio of asymmetric/symmetric phosphate stretching modes. 2′-methylklavuzon induced band shifts only in the asymmetric mode of phosphate bonds not in the symmetrical phosphate bond stretching. 2′-methylklavuzon induced A form of DNA topography. In addition to the changes in the DNA structure and transcription 2′-methylklavuzon also caused lipid-lowering effect in A549 cancer cells. 2′-methylklavuzon suppressed lipid unsaturation, however, it induced formation of lipids with ring structures. 2′-methylklavuzon suppressed phosphate-containing lipids significantly and decreased carbonyl containing lipids and cholesterol slightly. 2′-methylklavuzon caused increases in the hydrocarbon chain length. Overall, 2′-methylklavuzon can be used as a lipid-lowering compound in the treatment of NSCLC and other cancer therapies.
1. Introduction
Lung cancer has the most incidance and mortality rates in all types of cancers. Approximately 85 % of lung cancers are classified as non-small cell lung cancers with three histological types: squamous cell carcinoma, adenocarcinoma, and large cell carcinomas [1,2]. Human alveolar cell carcinoma initiated A549 cell line is commonly used in in vitro analysis of non-small cell lung cancers with adenocarcinoma subgroup [3].
Several agents including topoisomerase inhibitors have been in use in the treatment of NSCLC. Topoisomerase enzymes reduce DNA twisting and supercoiling thereby allowing for replication, transcription, DNA repair and chromatin condensation by cleavage of DNA phospho-diester backbone. They act by inducing transient single or double strand breaks in the DNA structure [4]. Topoisomerases can be separated into
two main groups according to the number of DNA strand breaks, which are topoisomerase type-I and type-II. Type-I topoisomerases are mono-meric enzymes, responsible for relaxation on both negative and positive supercoils via attaching 3′-phosphate of nicked DNA without requiring
ATP while type-II topoisomerases are dimeric enzymes that catalyse the breakage of the both DNA strands and require ATP to function. In addition to its topoisomerase inhibition activity, 2′-methylklavuzon is
also known for its Chromosomal Maintenance 1 (CRM1), also known as Exportin 1 inhibition property that contributes to its anti-cancer and anti-proliferative activity [5].
Klavuzon is a 5,6-dihydro-2H-pyran-2-one derivative, substituted with napthalen-1-yl group at position C-6. It was first discovered in 2009 and was shown to be more potent cytotoxic compound compared to goniothalamin which was a natural product having the same 5,6- * Corresponding author.
E-mail address: [email protected] (C. Ceylan).
Contents lists available at ScienceDirect
Vibrational Spectroscopy
journal homepage: www.elsevier.com/locate/vibspechttps://doi.org/10.1016/j.vibspec.2020.103148
dihydro-2H-pyran-2-one pharmacophore [6]. It is believed that the both goniothalamin and klavuzon are irreversible inhibitors and can show their inhibitory properties by forming a covalent bond with the nucle-ophilic sites of target proteins via Michael addition reaction [7]. Syn-thesis and biological activities of many klavuzon derivatives have been prepared and their anti-proliferative activities were investigated. In these studies it was found that Topo I [8], CRM1 [9] and SIRT 1 [10] are the intracellular targets of klavuzons. SAR studies indicated that sub-stitution of small alkyl groups at C-2 or C-4 positions of naphthalen-1-yl subunit increases the cytotoxic properties of klavuzons. Their cytotoxic properties over EpCAM+/CD133+cancer stem cells were also reported
[10]. As one of the most cytotoxic derivative, 2’-methylklavuzon has been selected to investigate its effect over the lipid metabolism and structural changes in DNA. Fourier transform infrared spectroscopy al-lows for a rapid and sensitive method and can be used non-destructively in the analysis of different biological systems. The method monitors molecular changes in cellular components such as lipids, proteins, car-bohydrates and nucleic acids at the level of functional groups quanti-tatively. The technique also evaluates shifts in peak positions, changes in bandwidths and band intensities to obtain structural and functional in-formation about the systems analyzed [11,12].
Although kluvazon-based drugs are important agents used in the cure for cancer, their cellular effects have not been considered to date. There have been no reports of the cellular and metabolic effects of 2′-
methylklavuzon on cancer cells to our knowledge. In this research, the structural and macromolecular effects of 2′-methylklavuzon on A549
cells and their lipid extracts were evaluated using FTIR spectroscopy and cell proliferation experiments.
2. Materials and methods
2.1. Cell lines and chemicals
A549 human non-small cell cancer cells were obtained from ˙IBG- Dokuz Eylül University. 2′-methylklavuzon was obtained from Ali Cagir.
Thiazolyl blue tetrazolium bromide 98 % (MTT) and potassium bromide (KBr) were purchased from Sigma-Aldrich (USA).
2.2. Cell culture conditions
A549 cells were cultured in DMEM high glucose with L-glutamine
supplemented by 10 % fetal bovine serum and 1 % penicillin- streptomycin (Sigma-Aldrich, USA) in an atmosphere of 5 % CO2 at 37 ◦C.
2.3. Measurement of cell viability by MTT assay
5000 cells were seeded on each well of 96 well-plate with growth medium and incubated at 37 ◦C and in 5 % CO
2. Anti-proliferative
ef-fects and IC50 values of 2′-methylklavuzon on A549 cells were
deter-mined by MTT assay. 20 mM 2′-methylklavuzon was prepared in DMSO
as the stock solution. The stock solution was then diluted in DMEM accordingly. 5 μL of each 2′-methylklavuzon concentration was added to
wells for triplicate assays. The cells were treated with the designated 2′-
methylklavuzon concentrations for 48 h at 37 ◦C. 10 μL of MTT solution
(5 mg/mL in PBS) was added to each well and incubated at 37 ◦C for 4 h
in the incubator. Then, the cell medium was removed and DMSO was added to dissolve the formazan crystals in each well. The absorbance values were measured at 570 nm by a spectrophotometer (Thermo Electron Corporation Multiskan Spectrum, Finland).
2.4. Sample preparation for FTIR spectroscopy
In order to prepare the cells for FTIR spectroscopy, 3 × 10⁴ cells were
seed into 24 well-plate per well incubated for 48 h with 600 μL of growth medium, and the cells were treated with 2 concentrations determined
before via cell viability test (MTT) IC50 values of the drug. After the
incubation period, the cells were washed with 500 μL PBS, treated with 100 μL trypsin and incubated for 5 min. at 37 ◦C in 5 % CO
2 and
collected by centrifugation in eppendorf tubes at 130xg for 5 min. The supernatants were removed and the pellets were washed with 500 μL PBS twice. To remove water, the collected cells were freeze-dried overnight by Labconco Free Zone lyophilizator under 4.0 Pa at − 57
◦C. The cell powder was mixed with dried potassium bromide (KBr) in a
mortar (at a ratio of 1:100). The mixture was then pressurized to 100 kg/ cm2 (1200 psi) for 5 min.
2.5. Lipid extraction
For lipid extraction from A549 cells, 3 × 10⁴ cells were seeded into
24 well-plate per well and incubated for 48 h with 600 μL of growth medium, and the cells were treated with 2′-methylklavuzon at a
con-centration of IC50 predetermined via cell viability test (MTT). After the
incubation period, the cells were washed with 500 μL PBS and were then treated with 100 μL trypsin and incubated for 5 min. at 37 ◦C in 5 % CO
2.
The cells were collected in eppendorf tubes by centrifugation at 130xg for 5 min. After the supernatants were removed, the pellets were washed with 500 μL PBS twice. Afterwards, the supernatants were removed and the cell pellets were homogenized with 600 μL of extraction mixture including chloroform/methanol (2:1, v/v) via vortexing. Then, the mixture was incubated for 20 min at room temperature. Following the incubation period, 180 μL ddH2O was added into the each of mixture,
homogenized with vortexing and centrifuged at 500xg for 10 min. At the end of the centrifugation, the upper phase was removed by siphoning. 20 μL lipid extract was placed on ATR-FTIR diamond. The spectrum was recorded following evaporation of the solvent.
2.6. FTIR Spectrum data analyses
For the lyophilized samples, the spectral analysis was performed by using a Perkin-Elmer spectrometer equipped with MIR TGS detector (Spectrum 100 Instrument, Perkin Elmer). FTIR spectra of the samples were recorded between 4000 and 450 cm−1 region. Interferograms were
recorded with 20 scans at 4 cm−1 resolution and pure potassium
bro-mide was used as a background. Each sample was carried out as tripli-cates. For lipid extracts, the spectral analysis was performed by using a Perkin-Elmer Attenuated total reflectance Fourier transform infrared spectrometer equipped with diamond/ZnSe crystal (UATR Two, Perkin Elmer). Interferograms were recorded with 20 scans at 2 cm-1 resolution against the background. Each sample carried out as triplicate. Spectrum 100 (Perkin-Elmer) software was used for all of the data manipulations. The triplicate measurements were averaged and the averaged spectra for each samples were then used for further data manipulation and statis-tical analysis. Then, the spectra were interactively baselined from two arbitrarily selected points. Finally, the spectra were normalized in spe-cific regions for visual comparison of the samples for the studied pa-rameters and control samples.
2.7. Statistical analysis
The differences between the control and inhibitor treated groups were compared using the Mann-Whitney U test. The statistical results were expressed as means ± standard deviation. p < 0.05 was considered statistically significant.
3. Results
3.1. Proliferation tests
2′-methylklavuzon showed dose-dependent cytotoxicity on A549
cells. To assess the anti-proliferative effects of 2′-methylklavuzon on
methylklavuzon and MTT proliferation assay was conducted. The results showed that there were dose-dependent decreases in response to 2′-
methylklavuzon as compared to untreated controls. The IC50 value of 2′-
methylklavuzon on A549 cells was calculated from the cell proliferation plot and was found to be 10.8 μM for A549 cells (Fig. 1).
3.2. The effect of 2′-methylklavuzon on nucleic acid structure of the A549
cells
The FTIR spectra in 1484 – 777 cm−1 region is called the fingerprint
region. This region abounds with the bands originating from nucleic acids, proteins, lipids and carbohydrates. To analyze the effects of 2′-
methylklavuzon on A549 cells nucleic acids this part of the spectrum was considered for the analysis. The changes induced by 2′
-methyl-klavuzon treatment in the fingerprint region caused significant changes as seen in Fig. 2.
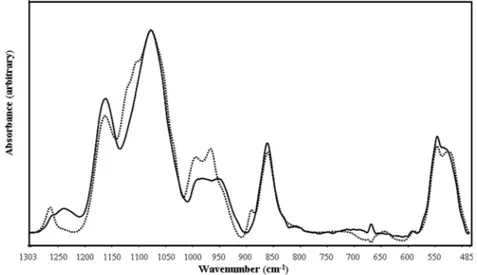
The major bands that originate from nucleic acids in this region are: 1239 and 1086 cm−1 are of nucleic acids which are attributed to PO
2 −
asymmetric and symmetric stretches [13], the band at 980 cm−1 of the
control cells which is attributed to C–O stretching of ribose groups, the band at 952 cm−1 which belongs to the C–O stretching of deoxyribose
groups, the band at 890 cm−1 which is indicative of C–C and CO– of
deoxyribose groups and the band at 546 cm−1 which is indicative of
sugar moieties found in the structure of nucleic acids [14].
3.2.1. 2′-methylklavuzon removed T, A and G, T DNA breathing modes in
A549 cell DNA structure
The peak at 1238 cm−1 band is indicative of T–A breathing modes of
the DNA and disappeared in the 2′-methyl kluvazon treated cancer cells;
however, the shoulder around 1259 cm−1 of the control spectrum which
is indicative of PO2- asymmetric stretching band shifted to 1264 cm−1.
In addition, the small band at 667 cm−1 disappears upon the drug
treatment which is indicative of G,T (ring breathing modes in the DNA bases) [14).
3.2.2. 2′-methylklavuzon increased transcription
The band at 1077 cm−1 is the PO
2- symmetric stretching band.
Interestingly this band did not show any significant shifting. However, significant shoulders were found to form at around 1121 cm−1 and 1104
cm−1 which were known as RNA bands [15]. The transcription rate
denoted by the 1121 cm−1/1077 cm−1 band increased by 41.98 %.
3.2.3. 2′-methylklavuzon induced single stranded DNA formation
The changes in the strandedness evidenced by the increase in the ratio of asymmetric/symmetric phosphate stretching modes. This ratio reached almost zero since the phosphate asymmetric stretching ab-sorption band at 1238 cm−1 disappeared [16].
3.2.4. 2′-methylklavuzon induced the A-form of DNA topography
formation
2′-methylklavuzon treatment resulted in decrease in the peak around
861 cm−1 which was indicative of de C30 endo/anti (A-form helix)
conformation in drug treated cells decreased upon the drug treatment [17].
3.2.5. 2′-methylklavuzon induced conformational changes in Nucleic Acid
Structure and in nucleic acid sugar moieties
The bands at 980 cm−1 (C–O stretching for ribose) and 952 cm−1
band (C–O deoxyribose, C–C stretching modes of DNA) shifted to 993 cm−1 and 966 cm−1 in the drug treated cancer cells, respectively. The
band at 546 cm−1 decreased in intensity upon drug treatment which was
indicative of sugar moieties possibly found in the structure of nucleic acids. The drug treatment led to the formation of a new band at 890 cm−1which was indicative of C–C, C–O deoxyribose when compared
with that of the control peaks [14,17].
3.3. The effect of 2′-methylklavuzonon lipid metabolism of the A549 cells
The effects of 2′-methylklavuzon on the structure and composition of
A549 cell lipids were investigated using the FTIR technique [12]. Although there have been many studies concerning the effects of topo-isomerase inhibitors on DNA and nucleic acid metabolism, their overall effects of cell structure and metabolism is limited except for very specific effects on certain cellular targets such as CRM1 and SIRT1 [18]. Therefore, experiments were designed enlighten the effect of 2′
-meth-ylklavuzon on the lipid make-up of A549 cells.
3.3.1. 2′-methylklavuzon treatment at IC50 level diminishes cancer cell
lipids significantly in whole cell lysates
The average FTIR spectra of the A549 cells of the 2′-methylklavuzon
treated and control cells are presented in Fig. 3a in the 1780 – 1484 cm−1 spectral region. The two most significant bands in this spectral
region is the Amide I band which is indicative of protein C––O stretching modes [19]. The shoulder centered at 1740 cm−1 is mainly assigned to
the C––O ester stretching vibration of triglycerides and cholesterol esters which constitute most of the cellular lipid content [11]. As seen in the figure, the intensity of the band decreases significantly (29.42 % of the control cells) in the 2′-methylklavuzon treated A549 cells indicating a
very significant lipid-lowering effect of 2′-methylklavuzonupon the
treatment.
The same result could be seen when the FTIR spectra of the whole cell extracts of the A549 cells were investigated in the 3733 and 2800 cm−1 region as shown in Fig. 3. The most important bands found in this
region are Amide A and Amide B bands mainly originate from N–H and C–N and N–H stretching of proteins, respectively. The second impor-tant group of the band in this region arise from lipids and small con-tributions from other macromolecules, which is between 3000 cm−1 and
2800 cm−1. 2′-methylklavuzon treatment causes this second group of
band to diminish significantly as seen in Fig. 3 b.
In addition to the changes in the amount and the composition of lipids, the changes in the Amid I band is noticeable (Fig. 3 a). This band shows a significant shift from 1656.69 cm−1 to 1648.30 cm−1. In
addi-tion, the ratio of the Amid I to Amide II bands changes significantly upon 2′-methylklavuzon treatment. Amid I and Amide II bands are due to
bands originating from C––O stretching and N-H bending and C-N stretching of proteins respectively [13]. All these changes indicate sig-nificant alterations in the proteome of the control and the 2′-methyl
klavuzon treated A549 cells. Fig. 1. The cytotoxic effect of 2’-methylklavuzon on A549 NSCLC cells. The
cytotoxicity was determined by the MTT (3-(4,5-dimethylthiazol-2-yl)-2,5- diphenyltetrazolium bromide) cell proliferation test in a 48 hour-culture at 37 ◦C. The IC
50 concentration of 2’-methylklavuzon was calculated from cell proliferation plots. The MTT assay was performed using triplicate samples.
3.3.2. 2′-methylklavuzon induced significant metabolic and compositional
effects on A549 cancer cell lipid extracts
The effect of 2′-methylklavuzon treatment on the A549 cell lipid
metabolism of the control and treated cancer cells was studied using the lipid extracts of the cells. The FTIR spectrum of the lipid extracts of the non-treated (control) A549 cells is given in Fig. 4. The assignments of the
major bands in Fig. 4 are given in Table 1.
3.3.3. 2′-methylklavuzontreatment inducedd changes in the composition of
aromatic lipids and suppresses lipid unsaturation
When the baselined and normalized spectra were compared between 3100 cm−1 and 2758 cm−1, the bands around 3060 cm−1 and 3026 cm−1
Fig. 2. The FTIR spectra of ID50 of 2′-methylklavuzon (dotted line) and control (solid line) A549 cells between 1484 – 777 cm−1 region (the spectra were normalized with respect to the PO2− symmetric stretch, which is observed at 1077 cm−1).
Fig. 3. The FTIR spectra of ID50 of 2′-methylklavuzon (dotted line) and control (solid line) A549 cells a) between 1484 – 777 cm−1 region (the spectra were normalized with respect to the PO2−symmetric stretch, which is observed at 1077 cm−1), b) between 1484 – 777 cm−1 region (the spectra were normalized with respect to the PO2−symmetric stretch, which is observed at 1077 cm−1).
were found to have higher intensities when compared with the control spectra. These bands were informative of aromatic lipids [20].
The band at 3001 cm−1is an indicator of lipid unsaturation [21]. The
absorption at this wavenumber is due to the double bonds between the aliphatic chains of lipids (C––C) as seen in Fig. 5. Although the band around 3002 cm−1 is accepted as an indirect measure of the
concen-tration of lipid peroxidation products, it is better to conceive this band intensity as a measure of unsaturation. There was around 31 % decrease in the lipid unsaturation level in the IC502′-methyl klavuzon treated
A549 cells when compared to that of the control A549 cells.
3.3.4. 2′-methyl klavuzon treatment induced significant chances in the
hydrocarbon chain length, phosphate containing lipids and cholesterol content of A549 cancer cells
The hydrocarbon chain length is given by the ratio of the intensities of the CH2 symmetric stretch band at 2850 cm−1 with that of CH3
symmetric stretch band at 2869 cm−1 as seen in Fig. 5 [29,31]. This ratio
was found to be 1.27 for the drug treated versus the control cells. The phosphate containing lipid content is given by the ratio of the PO2 asymmetric stretching vibration [11] at 1213 cm−1 and the CH2
symmetric stretch band at 2850 cm-1. This ratio was found to decrease to
65.83 % of its control level.
The band intensity ratios of CH2 symmetric stretch to CH2
antisym-metric stretch was found to correlate with a rough estimate of choles-terol content [23,24,32]. This ratio was found to increase 1.32 % with a corresponding decrease in cholesterol in cell membranes. Similarly, the intensity of the band at 698 cm−1 indicates a small decrease meaning a
corresponding decrease in cholesterol content upon 2′-methyl klavuzon
treatment [29].
4. Discussion
Although the structural effects of several cancer drugs on cancer cell metabolism have been studied for certain drugs using FTIR spectroscopy [33], almost no scientific investigation has been carried out on the ef-fects of 2′-methylklavuzon or other topoisomerase inhibitors. In this
work, we studied the effect of 2’-methylklavuzon on A549 cancer cells proliferation and its structural and compositional effects on nucleic acid structure and lipid metabolism and composition using proliferation as-says and FTIR spectroscopy at IC50 concentration. For this purpose we
used FTIR spectroscopy to monitor drug-induced alterations in cellular macromolecular infrastructure such as proteins, carbohydrates, nucleic acids and other important components such as lipids by comparing the treated cell samples with the untreated counterparts [11].
Since topoisomerase inhibitors target DNA shaping enzymes the most expected or apparent effect of 2′-methylklavuzonis on cellular
structure on DNA. Therefore, the effects of 2′-methyl klavuzon on the
nucleic acid make-up of A549 cells were investigated using FTIR spec-troscopy in the fingerprint region where several nucleic bands were found. One of the most prominent changes upon the 2′-methylklavuzon
treatment is the loss of T, A and G, T DNA breathing modes. Several different kinds of thermal fluctuations resulting in local openings of the nucleic acid bases bound to each other via hydrogen bonds open temporarily. These local and temporary openings play important func-tional roles including DNA stability [34]. The loss of these modes might be due either to slowing down in proliferation or loss of topoisomerase Fig. 4. The general FTIR spectrum of the lipid extract of A549 cells between 3116 and 675 cm−1.
Table 1
The FTIR band assignments of lipid extracts of A549 cells. Wavenumber (cm−1) and Peak
Number in parantheses Assignments
3082 (1) C-H ring, Aromatic CH stretching, [20]
3060 (2) C-H ring, Aromatic CH stretching, [20]
3025 (3) C-H ring, Aromatic CH stretching, [20]
3001 (4) Olefinic, CH––CH stretching vibration, [21]
2954 (5) Asymmetric stretching vibration of the CH3
group, [22]
2922 (6) Asymmetric stretching vibration of the CH2
group, [23]
2869 (7) Symmetric stretching vibration of the CH3
group, [24]
2851 (8) Symmetric stretching vibration of the CH2
group, [24]
1737 (9) Stretching vibration of the C––O group, [19]
1601 (10) C––C Stretching, [25]
1492 (11) Choline derived, asymmetric bending of the
N–CH3 group, [26]
1462 (12) Bending vibrations of the CH2 groups of fatty
acids, [27]
1377 (13) Bending vibrations of the CH3 groups of fatty
acids, [21]
1213 (14) Asymmetric stretching vibration PO2− [11]
1157 (15) Stretching vibration of the C–O group of lipid
ester bond [19]
1082 (16) Symmetric stretching vibration of the PO2−
[28]
970 (17) Asymmetric stretching vibration of the C––C
group: conformation trans [28]
846 (18) Asymmetric stretching vibration of the P–O
Stretching vibration of C–C–C [21]
activity due to formation of single stranded DNA [17], or both. However, the level of transcription was enhanced after the drug application evi-denced by the intensity increase in the RNA bands around 1121 cm−1.
The increase in the transcription is usually observed in the case of cellular stress conditions with the drug application as a cellular stress inducer [11,35].
Since 2′-methylklavuzoninhibits topoisomerase 1 enzyme, this
ac-tion leaves the DNA strands single stranded observed by the changes in the increase in the ratio of asymmetric/symmetric phosphate stretching modes [16]. However, 2′-methylklavuzon induces band shifts only in the
asymmetric mode of phosphate bonds not in the symmetrical phosphate bond stretching. The shift in the shoulder at around 1259 cm−1 to 1264
cm−1of the control spectrum indicates formation of new hydrogen bonds
with DNA upon methyl klavuzon treatment [36].
It was found that 2’-methylklavuzon induced A-form of DNA topography formation. Lyophilization is also known to induce an A-form DNA structure [37]. Since water was effectively removed from the cell extracts by lyophilization, both the control and 2’-methylklavuzon treated spectra were assumed to have a relatively high A-form DNA. The 2’-methylklavuzon treatment caused a decrease in the A-form properties when compared with the control spectrum. In addition to lyophilization. DNA binding drugs and irradiation are also known to induce A-form DNA. Lomustine as an intercalating agent was also known to induce such changes in DNA topography [17]. One more possibility is methylation of DNA molecules since topoisomerase inhibitors were known to influence DNA topography via modulating methylation of sensitive sequences in
the DNA molecules. Methylation was known to induce such chances in sugar puckering (N-type, C3’-endo) in A-form DNA and glycosidic torsional angle. These changes are also known to induce changes in phosphate groups in the DNA molecules and hydrogen bonding patterns [38].
One of the most prominent outcomes of this study was the striking decrease in the lipid content of A549 cancer cells. Increase in lipidation was known as one of the emerging metabolic hallmarks of cancer [39]. In this research study, 2′-methylklavuzonwas shown to have a strong
dyslipidemic effect on the cancer cells at IC50 concentration. Various
drugs including statins have been known to have anti-tumor effects in different cancer patients and in in vitro manipulated cancer cells [40]. Similarly, 2′-methylklavuzon shows a strong lipid-lowering effect on
cancer cells. The results indicated a marked decrease in the lipid portion of the cell with respect to protein portion. This observation is the reverse of lipidation which is commonly accepted as one of the emerging metabolic hallmarks of cancer. 2’-methylklavuzon is known to have two potential anti-proliferative effects: the first one is its topoisomerase-1 inhibitory action. The other mode of action in inhibiting the cancer cell growth is its inhibitory action of CRM1. CRM1 is strongly related with lipid metabolism [31]. The nuclear transport of Hypoxia-inducible factor 1-α (HIF-1α) is CRM1 dependent. Once CRM1 is inactivated by 2’-methylklavuzon, HIF-1α cannot be transported to the cell nucleus. HIF-1α is constitutively active in some cancer cells, supports lipid syn-thesis, and inhibits lipid oxidation [31,41]. In addition to the inhibitory effects on CRM-1 and topoisomerase 1 activity, the lipid lowering effect Fig. 5. The FTIR spectra of the lipid extracts of the control and IC50 2′-methylklavuzon-treated A549 cells between 3100 cm−1 and 2800 cm−1 (the spectra are normalized with respect to 2922 cm−1 band).
2’-methylklavuzon might be another potential anti-proliferative mech-anism on A549 cancer cells. However, the role of lipid metabolism in cell death is not understood well [18]. Some of the lipid types are known to increase in cell death such as cholesterol. The reverse is true for carci-nogenesis. However, high levels of the oxidation products of various lipids (cholesterol, fatty acids, ceramides) cause apoptosis. In addition, we know that topoisomerase inhibitors are inducers of apoptosis [42]. Autophagy and lipophagy are also non-apoptotic cellular death path-ways known to decrease the amount of total lipids [43]. Their roles in 2’-methylklavuzon induced cell death remains to be explored. In this study phosphate containing lipids such as phospholipids (ex. tidic acid, glycerophospholipids, phosphatidyl ethanolamine, phospha-tidyl choline, phosphaphospha-tidyl serine, phosphaphospha-tidyl inpsitole and glycerophospholipids) were observed to decrease in the lipid extract FTIR spectra. Similarly, the cholesterol content of 2’-methylklavuzon treated A549 cells also decreased. 2’-methylklavuzon induced synthesis of lipids with ring structures. Ring structure-containing lipids (ex. prostanes, isoprostanes and prostaglandins) are known to form during the conditions of cellular stress, therefore they are used markers of cell stress. These structures were identified as aromatic lipids (meaning ar-omatic ring-containing lipid species). In the lipid extract spectra, we identified the peaks around 1020 cm−1, 1060 cm−1 and 1080 cm−1 as
aromatic lipids. C-H ring structure containing lipid species were iden-tified using both infrared and raman spectroscopies [44–46]. 2’-meth-ylklavuzon reduced the unsaturation level of lipids in lipid extract samples. Lipid unsaturation generally leads to lipid peroxidation. Several FTIR spectroscopic studies used these two terms interchange-ably. In addition, this parameter is used as a marker of lipid peroxidation since the degree of unsaturation increases the level of lipid peroxidation especially in case of cellular stress as a result of the formation of reactive oxidation products [47]. In this study, the lipid unsaturation level decreased. The formation of aromatic lipids are also considered as a measure of metabolic stress. Therefore, we conclude that ring structure containing lipid synthesis and lipid unsaturation levels are separately controlled.Both phospholipids and triglycerides contain fatty acids in their structure as ester bonded moieties. In their chemical structure they contain aliphatic chains covalently bonded consecutive CH2 groups.
They are referred to as “hydrocarbon chains” in this study. The length of the aliphatic chain and the number of double bonds in the aliphatic chain affect the structure and the biological function of the constituent lipid molecules (phospholipids in the cell membrane and triglycerides and cholesterol esters in the lipid droplet core). If the aliphatic hydro-carbon chain length increases in the phospholipid in the cell membrane the thickness of the cell membrane increases which is commonly seen in diabetes. As a result lipid-protein interactions change as the phospho-lipid membrane thickness increase and the membrane protein cannot function properly (glucose and drug transporters) [48]. Elevated expression of elongases must be responsible for the increase in the hy-drocarbon chain length. Elongases are deregulated in different cancers [49]. The increase in the hydrocarbon chain length has also been observed in other pathological conditions such as cancer. For example in squamous lung cancer, phospholipid chain length was found to be elevated [50]. In this study, the hydrocarbon chain length was expressed as the ratio of the intensities of the CH2 symmetric stretch band at 2853
cm−1 with that of CH
3 symmetric stretch band at 2872 cm−1 [24,30] and
an increase (5.34%) in the hydrocarbon chain length of cellular lipids was observed.
5. Conclusions
The structural and macromolecular compositional changes imposed upon the treatment of A549 cells with 2′-methylklavuzonwas
investi-gated using FTIR spectroscopy and cell proliferation assays. 2′
-methyl-klavuzon caused significant structural changes in A549 cell DNA structure with the loss of T, A and G, T DNA breathing modes. The transcription rate of A549 cells was enhanced. 2’-methylklavuzon
induced a single stranded DNA formation and favored A-form DNA topography in the double-stranded parts. 2′-methylklavuzon also caused
dyslipidemia, suppressed lipid unsaturation and induced formation of lipids with ring structures. 2′-methylklavuzon suppressed phosphate
containing lipids and carbonyl containing lipids and cholesterol. 2′-
methylklavuzon caused an increase in the hydrocarbon chain length of A549 cellular lipids.
Funding information
This research did not receive any specific grant from funding agencies in the public, commercial, or not-for-profit sector.
CRediT authorship contribution statement
Cagatay Ceylan: Conceptualization, Methodology, Formal analysis,
Visualization, Supervision, Writing - original draft. Hatice Nurdan
Aksoy: Investigation. Ali Cagir: Resources, Conceptualization, Writing -
review & editing. Hakkı Çetinkaya: Investigation.
Declaration of Competing Interest
The authors declare that they have no known competing financial interests or personal relationships that could have appeared to influence the work reported in this paper.
Acknowledgements
We thank ˙Izmir Institute of Technology (˙IYTE) Integrated Research Centers-Biotechnology and Bioengineering Central Research Labora-tories for providing me the necessary facilities throughout the experi-ments. We also thank Department of Chemistry for allowing us to use the FTIR spectrometer. Synthesis of the compound reported in this work was supported by the Scientific and Technological Research Council of Turkey (TÜB˙ITAK, 114Z207).
References
[1] H.H. Yılmaz, N. Yazıhan, D. Tunca, A. Sevinç, E.¨O. Olcayto, N. ¨Ozgül, et al., Jpn. J. Clin. Oncol. 1 (2011) 10–16.
[2] M.M. Salvador, M.G. de Cedr´on, J.M. Rubio, S.F. Martínez, R.S. Martínez, E. Casado, et al., Crit. Rev. Oncol. Hematol. 112 (2017) 31–40.
[3] M. Lieber, G. Todaro, B. Smith, A. Szakal, W. Nelson-Rees, Int. J. Cancer 17 (1976) 62–70.
[4] J.J. Champoux, Annu. Rev. Biochem. 70 (2001) 369–413.
[5] I. Akçok, D. Mete, A. S¸en, P. Kasaplar, K.S. Korkmaz, A. Ça˘gır, Bioorg. Chem. 71 ˙ (2017) 275–284.
[6] P. Kasaplar, O. Yilmazer, A. Cagir, Bioorg. Med. Chem. 17 (1) (2009) 311–318. [7] P. Kasaplar, O.Y. Cakmak, A. Cagir, Bioorg. Chem. 38 (4–6) (2010) 186–189. [8] I. Akçok, D. Mete, A. S¸en, P. Kasaplar, K.S. Korkmaz, H.O. Otas¸, A. Ça˘gır, Bioorg. ˙
Chem. 71 (2017) 275–284.
[9] T. Kanbur, M. Kara, M. Kutluer, A. S¸en, M. Delman, A. Alkan, H.O. Otas¸, ˙I. Akçok, A. Ça˘gır, Bioorg. Med. Chem. 25 (16) (2017) 4444–4451.
[10] M. Delman, S.T. Avcı, ˙I. Akçok, T. Kanbur, E. Erdal, A. Ça˘gır, Eur. J. Med. Chem. 180 (2019) 224–237.
[11] Y. Baran, C. Ceylan, A. Camgoz, Biomed. Pharmacother. 67 (2013) 221–227. [12] M.K. Yandım, C. Ceylan, E. Elmas, Y. Baran, Tumor Biol. 37 (2016) 2365–2378. [13] G. Cakmak, I. Togan, F. Severcan, Aquat. Toxicol. 77 (2006) 53–63.
[14] Taylor and Francis Group, I. Rehman, Z. Movasaghi, S. Rehman, FTIR and Raman Characteristic Peak Frequencies in Biological Studies. Chapter 8. Vibrational Spectroscopy for Tissue Analysis., Applied Spectroscopy Reviews, 2013, pp. 213–294.
[15] P. Zucchiatii, E. Mitri, S. Kenig, F. Bille, G. Kourousias, D.E. Bedolla, L. Vaccari, Anal. Chem. 88 (2016) 12090–12098.
[16] M.L.S. Mello, B.C. Vida, Plos One 7 (8) (2012) e43169. [17] B.R. Wood, Chem. Soc. Rev. 45 (2016) 1980–1998.
[18] J.S. Hwang, H.S. Choi, S.A. Ham, T. Yoo, W.J. Lee, K.S. Paek, H.G. Seo, Sci. Rep. 5 (15971) (2015).
[19] J. Arrondo, F.M. Goni, Chem. Phys. Lipids 96 (1998) 53–68.
[20] A. Talari, M. Martinez, Z. Movasaghi, I. Rehman, Appl. Spectrosc. Rev. 52 (2017) 456–506.
[21] I. Dreissig, S. Machill, R. Salzer, C. Krafft, Spectrochim. Acta Part A: Mol. Biomol. Spectrosc. 71 (2009) 2069–2075.
[22] H. Galeb, J. Salimon, E. Eid, N. Nacer, N. Saari, S. Saadi, Food Res. Int. 48 (2012) 657–666.
[23] I. S´anchez-Alonso, P. Carmona, M. Careche, Food Chem. 132 (2012) 160–167. [24] I. Hayati, Y. Man, C. Tan, I. Aini, Eur. J. Lipid Sci. Technol. 107 (2005) 886–895. [25] G. Vidyadharani, R. Dhandapani, Elixir Appl. Biol. 61 (2013) 16753–16756. [26] M. Schwarzott, P. Lasch, D. Baurecht, D. Naumann,, U. Fringeli, Biophys. J. 86
(2004) 285–295.
[27] A. Oleszko, S. Olszty´nska-Janus, T. Walski, K. Grzeszczuk-Ku´c, J. Bujok, K. Gałecka, A. Czersky, W. Witkiewicz, M. Komorowska, BioMed Res. Int. 2015 (2015). [28] S. Yoshida, Q. Zhang, S. Sakuyama, S. Matsushima, Lipids Health Dis. 8 (28)
(2009).
[29] U. Gupta, V. Singh, V. Kumar, Y. Khajuria, Mater. Focus 3 (2014) 211–217. [30] R. Gasper, et al., Biochimica Biophys. Acta (BBA)-Biomembr. 1788 (6) (2009)
1263–1270.
[31] I. Mylonis, G. Simos, E. Pareskeva, Cells 8 (3) (2019) 214.
[32] S. van den Driesche, W. Witarski, S. Pastorekova, H. Breiteneder, C. Hafner, M. J. Vellekoop, Analyst 136 (11) (2011) 2397–2402.
[33] A. Derenne, R. Gasper, E. Goormaghtigh, Analyst 136 (2011) 1134–1141. [34] M.D. Frank-Kamenetskii, S. Prakash, Physi. Life Rev. 11 (2) (2014) 153–170. [35] J. Ramesh, A. Salman, Z. Hammody, B. Cohen, J. Gopas, N. Grossman,
S. Mordechai, Eur. Biophys. J. 30 (4) (2001) 250–255.
[36] P.T.T. Wong, E.D. Papavassiliou, B. Rigas, Appl. Spectrosc. 45 (9) (1991). [37] D. Ghoshdastidar, S. Senapati, Nucleic Acids Res. 46 (2018) 4344–4353. [38] M. Banyay, A. Gr¨aslund, J. Mol. Biol. 324 (4) (2002) 667–676. [39] N.N. Pavlova, C.B. Thompson, Cell Metab. 23 (2016) 27–47. [40] H. Jones, et al., Am. J. Cancer Res. 7 (12) (2017) 2478. [41] H. Zhang, Mol. Cell. Oncol. 2 (4) (2018) e980184.
[42] O. Sordet, et al., Curr. Med. Chem. Anti Cancer Agents 3 (4) (2003) 271–290. [43] R. Mathew, V. Karantza-Wadsworth, E. White,, Nat. Rev. Cancer 7 (12) (2007)
961–967.
[44] G.I. Dovbeshko, N.Y. Gridina, E.B. Kruglova, O.P. Pashchuk, Talanta 53 (1) (2000) 233–246.
[45] Z. Movasaghi, S. Rehman, D.I. ur Rehman, Appl. Spectro. Rev. 43 (2) (2008) 134–179.
[46] H. Schulz, M. Baranska, Vib. Spectro. 43 (1) (2007) 13–25.
[47] A. Barden, L.J. Beilin, J. Ritche, K.D. Croft, B.N. Walters, C.A. Michael, Clini.Sci. 91 (1996) 711–718.
[48] T. Matsuzaka, H. Shimano, N. Yahagi, T. Kato, A. Atsumi, T. Yamamoto, et al., Nat. Med. 13 (10) (2007) 1193–1202.
[49] K. Tamura, et al., Cancer Res. 69 (20) (2009) 8133–8140. [50] Marien, Oncotarget 7 (11) (2016) 12582.