Nanotechnology
PAPER
Nanohybrid structured RuO
2
/Mn
2
O
3
/CNF as a catalyst for Na–O
2
batteries
To cite this article: Mohammad Fathi Tovini et al 2018 Nanotechnology 29 475401
Nanohybrid structured RuO
2
/Mn
2
O
3
/CNF as
a catalyst for Na
–O
2
batteries
Mohammad Fathi Tovini , Bhushan Patil , Cevriye Koz,
Tamer Uyar
and Eda Y
ılmaz
Institute of Materials Science and Nanotechnology, National Nanotechnology Research Center, Bilkent University, Ankara 06800, Turkey
E-mail:[email protected]
Received 14 May 2018, revised 29 July 2018 Accepted for publication 7 September 2018 Published 26 September 2018
Abstract
A 3D RuO2/Mn2O3/carbon nanofiber (CNF) composite has been prepared in this study by a
facile two step microwave synthesis, as a bi-functional electrocatalyst towards oxygen reduction reaction(ORR) and oxygen evolution reaction (OER). RuO2nanoparticles with the mean size of
1.57 nm are uniformly distributed on Mn2O3nano-rods grown on electrospun CNFs. The
electrocatalytic activity of the composites are investigated towards ORR/OER under alkaline condition. The ternary RuO2/Mn2O3/CNF composite showed superior ORR activity in terms of
onset potential(0.95 V versus RHE) and Tafel slope (121 mV dec−1) compared to its RuO2/CNF and Mn2O3/CNF counterparts. In the case of OER, the RuO2/Mn2O3/CNF
exhibited 0.34 V over-potential value measured at 10 mA cm−2and 52 mV dec−1 Tafel slope which are lower than those of the other synthesized samples and as compared to state of the art RuO2and IrOxtype materials. RuO2/Mn2O3/CNF also exhibited higher specific capacity
(9352 mAhg
-carbon 1) than CNF (1395 mAhgcarbon-1), Mn2O3/CNF (3108 mAhgcarbon-1) and RuO2/CNF (4859 mAh gcarbon−1 ) as the cathode material in Na–O2battery, which indicates the
validity of the results in non-aqueous medium. Taking the benefit of RuO2and Mn2O3
synergistic effect, the decomposition of inevitable side products at the end of charge occurs at 3.838 V versus Na/Na+by using RuO2/Mn2O3/CNF, which is 388 mV more cathodic
compared with CNF.
Supplementary material for this article is availableonline
Keywords: RuO2/Mn2O3/CNF, 3D composite, oxygen reduction reaction, oxygen evolution
reaction, Na–O2batteries
(Some figures may appear in colour only in the online journal) 1. Introduction
Metal-O2 batteries have attracted considerable research
attention over Li-ion batteries due to their higher theoretical energy density [1, 2]. Li–O2 batteries are the most studied
metal-O2systems to date, in which the cell electrochemistry
basically relies on the reversible formation of Li2O2 as the
main discharge product during cycling. However, the insu-lating nature of Li2O2induces large over-potential(>1 V) and
low Coulombic efficiency to the system. In this regard, Na–O2batteries are decent substitutes because deposition of
NaO2 during oxygen reduction reaction (ORR) results in
much lower charging over-potential(typically <0.2 V) during oxygen evolution reaction(OER) because of facilitated OER kinetics of superoxide species. However, these cells suffer from a considerably lower theoretical energy density (1105 Wh kg−1 based on NaO
2) than Li–O2 cells
(3500 Wh kg−1 based on Li
2O2) and highly active nature of
NaO2triggers the formation of side products and precipitous
over-potential increase at the end of OER[3–7]. Therefore, a
rational design of a catalyst is required for feasibility of sta-tionary applications of these systems.
Although Pt and its alloys are well known catalysts for ORR, their moderate OER activity, high price and surface Nanotechnology Nanotechnology 29(2018) 475401 (10pp) https://doi.org/10.1088/1361-6528/aadfb7
poisoning hinder their application as bi-functional electro-catalysts for these reactions[8]. The first row transition metal
oxides, like NiOx and CoOx are promising alternative
cata-lysts for ORR due to their reasonably comparable catalytic activity to Pt, lower cost, high stability and abundance in the nature[9]. Manganese oxides (MnOxlikeα-, β-, γ-, δ-MnO2,
Mn2O3 and Mn3O4) have been widely investigated as
out-standing ORR catalysts due to several characteristics of Mn including: its oxidation state change between+2, +3 and +4 near the equilibrium ORR potential which facilitates oxygen atoms exchange in relevant potentials, low toxicity, high chemical stability and earth abundance and potential for large scale energy applications [10–13]. However, the poor
elec-tronic conductivity and the relatively low OER kinetics of MnOx limits its application as a bi-functional electrocatalyst
and needs to be considered for future applications. To address the low electronic conductivity of MnOx, several researches
have been attempted to combine it with highly conductive carbonaceous materials like graphene, carbon nanotubes and porous carbon [14–16]. Among all, electrospun carbon
nanofibers (CNF) have been considered as promising back-bone for MnOx to improve the charge exchange due to its
high surface area, excellent electrical conductivity, mechan-ical property and low cost of synthesis[17]. However, to the
best of our knowledge, CNF has not been studied as a matrix for MnOxdeposition for ORR/OER application.
In order to deal with the low OER activity of MnOx,
composite materials containing MnOxand metal/oxides (like
Au, Ti, TiO2, Co3O4, Fe2O3etc) have been proposed [18–22].
Ruthenium based oxides (RuOx) have been frequently
reported as high electronically conductive catalysts especially for OER based electrochemistry[23–25]. In this regard, Lee
et al showed the OER catalytic activity of RuO2in both acidic
and basic media [26]. Also recently, Bhowmik et al
con-firmed the OER activity of RuO2nanowires grown on
carbon-nitride in all pH values, including acidic (pH=0), neutral (pH=7) and alkaline (pH=14) solutions [27]. For these
reasons, the MnOx/RuOxcombination has been achieved by
different research groups as a bi-functional catalyst for ORR/ OER for diverse applications[28–30]. However, the lack of a
rational 3D structure design consisting of a highly electronic conductive path in the core to supply electric charge and maintain the mechanical stiffness of the structure can be realized in these works. Such a design has been extensively investigated for the energy conversion and storage applica-tions. They include 3D carbon/SnOx [31], CNT/MO
(M=Co, Zn, Mn) [32], CNF/Fe3O4 [33], SnO2/Co3O4
nanofiber-coated graphene [34] etc.
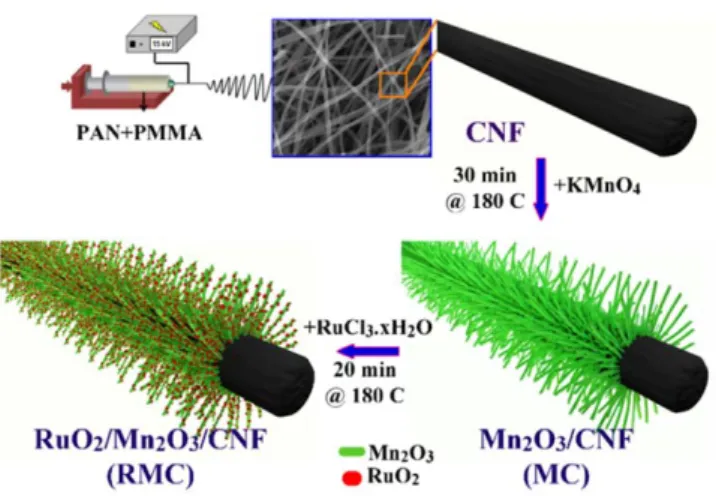
Herein, we first optimize a rational 3D design of RuO2/Mn2O3/CNF (RMC) bi-functional catalyst for ORR/
OER in alkaline aqueous media and in the second step, the optimized samples are implemented as the cathode material for Na–O2batteries. RMC has been prepared through a facile
two-step microwave synthesis, in which RuO2nano-particles
were attached on the as synthesized Mn2O3nano-rods coated
electrospun CNF (figure 1). Electrospun CNFs provide an
optimal surface for the 3D structure to grow and the elec-trochemical results confirmed that the 3D RMC exhibits
improved ORR/OER catalytic activity compared to its RuO2/CNF (RC) and Mn2O3/CNF (MC) counterparts, which
demonstrates that RMC offers a competitive alternative to the already available ORR/OER catalysts.
2. Experimental
2.1. Preparation of Mn2O3/CNF, RuO2/CNF and
RuO2/Mn2O3/CNF
In thefirst step, Mn2O3/CNF (MC) composites were prepared
by a facile microwave synthesis method. Typically, 20 mg of electrospun CNF (fabrication details in supplementary infor-mation) was dispersed in 20 ml DI water by 10 min sonica-tion. Then, different amounts of KMnO4were mixed with the
CNF dispersion and stirred in the room temperature for 30 min. The above dispersions were added to the vessels and the microwave-assisted hydrothermal reactions were per-formed at 180°C for 30 min in the microwave synthesis reactor(Anton Paar Monowave 300). The amount of KMnO4
was adjusted to 0.125, 0.25 and 0.5 mmol to result MC1, MC2 and MC3 samples, respectively. After the reactions were performed, MC samples were washed and centrifuged with DI water and ethanol for several times and dried in an oven at 60°C for overnight. Finally, the samples were annealed for 1 h in 150°C in the air atmosphere.
For RMC preparation, 20 mg MC2 was dispersed in 20 ml DI water by 5 min sonication and different amounts of RuCl3.xH2O were mixed with the solution by stirring for
30 min. Then, the resulting mixtures were added into the vessels and put in the microwave synthesis reactor at 180°C for 20 min. The amount of RuCl3.xH2O was adjusted to 0.01,
0.025 and 0.04 mmol to result RMC1, RCM2 and RMC3 samples, respectively. Figure1 shows the schematic illustra-tion of RMC samples preparaillustra-tion sequence. During the whole microwave synthesis preparation of MCs and RMCs, the mixers were stirred at 600 rpm. After the reactions were
Figure 1Schematic illustration of 3D RMC composite preparation. Electrospun-CNF was used as the backbone for Mn2O3nanorods
deposition in thefirst hydrothermal step. Then, RMC was prepared during the second hydrothermal step by using MC as the template for RuO2nano-particles deposition.
complete, the products were washed, dried and annealed same as MC samples.
For the preparation of RC, the same procedure as RMC2 was applied, but MC2 was replaced by CNF as the substrate for RuO2deposition.
2.2. Materials characterization
The morphological and structural evaluations of the samples were performed by using the immersion mode of a focused ion beam-scanning electron microscope(FIB-SEM, FEI 600 Dual Beam) operating at 15 kV and transmission electron microscope(TEM, FEI Tecnai G2 F30) operating at 300 kV. For TEM measurements, samples were randomly dispersed in acetone and dropped on a lacy carbon coated TEM copper grid. Energy dispersive spectroscopy(EDS) was performed in SEM (FEI-Quanta 200 FEG) operating at 15 kV and the average of 6 different points measurements were used for Ru: Mn ratio calculations. The averages of diameter of more than 40 fibers from different SEM images were used for fiber diameter calculations. CHNS elemental analysis of the sam-ples was performed by using a Thermo Flash 2000 elemental analyzer. Crystallographic identifications were performed by a Panalytical (X’pert Pro MPD) instrument and x-ray dif-fraction(XRD) patterns were collected over the 2θ range of 10°–80° using Cu-kα radiation (λ=1.54 Å). High resolution x-ray photoelectron spectroscopy (XPS, Thermoscientific K-Alpha, Al K-Alpha radiation) was performed on MC2 and RMCs samples to determine the valence number of Mn and Raman spectra were recorded on a confocal Raman instru-ment(WITec alpha300).
2.3. Electrochemical measurements
All electrochemical measurements were performed with Biologic SP-150 potentiostat at room temperature. The stan-dard three-electrode electrochemical cell was used with the glassy carbon electrode(GC, 3 mm diameter, 0.070 68 cm2of geometric surface area), Pt spiral wire and Ag|AgCl|KCl(sat.) as working, counter and reference electrodes, respectively. The electrochemical characterizations were performed in 20 ml 0.1 M KOH solution where prior to each measurement the electrolyte solution was saturated with either N2or O2gas
(99.999% of purity) for 30 min. More details about electro-chemical measurements and electrodes preparation is avail-able in supplementary information.
2.4. Na–O2cell assembly and galvanostatic measurements Na–O2cells were assembled inside an Ar-filled glovebox (O2
level<0.5 ppm, H2O level<0.5 ppm) with metallic Na as
anode, Celgard 2500 and GF/C as the separators and 20 wt% C65 containing CNF, MC2, RC and RMC2 cathodes. 280μl of 0.5 M NaCF3SO3 in tetraethylene glycol dimethyl ether
(H2O amount <10 ppm according to Karl Fischer titration)
was used in each cell as the electrolyte. The mass of active materials on cathodes was∼0.5 mg which were drop casted on Ni-foams (∼11 mm diameter). Galvanostatic measure-ments of cells were performed using a battery cycler(Landt
Instruments CT2001A) under 1.5 mbar of O2pressure(40 ml
integrated O2 tank). Discharged or charged cathodes were
extracted from disassembled cells inside the glovebox and washed with 3 ml acetonitrile(H2O amount<5 ppm) in order
to remove residual electrolyte and used for postmortem characterizations.
3. Results and discussions
In order to find the optimum amount of KMnO4 and
RuCl3.xH2O precursors, three different batches of MCs and
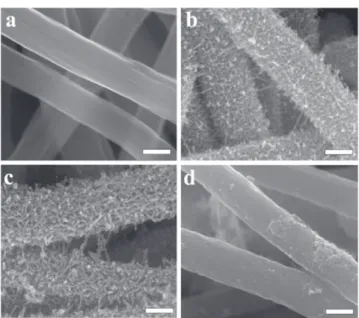
RMCs are prepared and morphological and structural eva-luations are performed by SEM(figures 2, S1–S3, available online at stacks.iop.org/NANO/29/475401/mmedia). The
as electrospun CNF exhibits fibrous structure with smooth surface and mean diameter of 255 nm (176–382 nm) (figure 2(a)). However, drastic morphological changes were
observed after Mn2O3deposition on CNF(figures2(b), S1(b)
and S2). Although the CNF framework remains unchanged in MC samples, the deposition of Mn2O3 nano-rods turns the
structure to a 3D porous platform, which become quite desirable for RuO2nanoparticle decoration in the next step.
Also, by comparingfigures2(b) and S2, it can be figured out
that Mn2O3 coating thickness exhibits a direct relation to
KMnO4 precursor amount, resulting in the fibers diameter
increase from MC1(281 nm) to MC3 (464 nm). After RuO2
deposition, the change in Mn2O3nano-rods diameter can be
recognized in SEM images of RMC samples(figures2(c) and
S3) when compared to MC2. Since the least amount of RuCl3.xH2O was used for RMC1 synthesis, its morphology is
quite reminiscent of MC2(figures S3(a) and (b)). On the other hand, some RuO2 agglomerates existing between Mn2O3
nano-rods and accumulating outside of the structure are observed in RMC3 (figures S3(c) and (d)), which results in pore clogging and preventing electrolyte ion accessibility to
Figure 2.SEM images of(a) CNF, (b) MC2, (c) RMC2 and (d) RC (scale bars, 200 nm).
3
the inner pores. Anyhow, the surface morphology of RMC2 in figure2(c) exhibits no agglomeration of RuO2, showing
that the RuO2 nanoparticles were effectively deposited on
Mn2O3nano-rods. In order to realize the function of porous
Mn2O3 nano-rods framework in the second hydrothermal
step, as electrospun pristine CNF was used for RuO2
deposition to make RC(figure2(d)). It can be seen that in the
absence of Mn2O3 nanorods, RuO2 agglomerates are
dom-inating in this sample. This behavior demonstrates that Mn2O3nanorods act as trapping network to anchor individual
RuO2nanoparticles which results in the uniform distribution
of them in the structure.
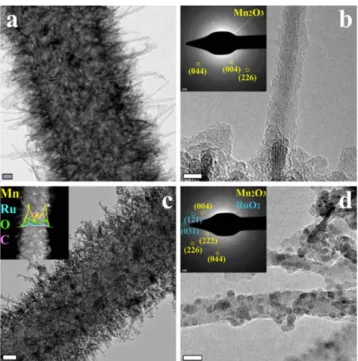
TEM has been exploited to further investigate the nanostructure of MC2, RMC2 and RC, as shown infigures3
and S4. The TEM and high resolution TEM(HRTEM) ima-ging revealed that a large number of Mn2O3 nano-rods are
grown upright on CNF in MC2, making an open porous 3D nano-structure(figures 3(a) and (b) and S4(a)). The selected
area electron diffraction (SAED) pattern of MC2 shows the characteristic diffraction rings attributed to the (004), (044) and(226) planes, indicating the crystalline nature of Mn2O3
nano-rods. The TEM images of RMC2 show that RuO2
nanoparticles with the mean size of 1.57 nm are uniformly distributed on Mn2O3nano-rods without any agglomeration
and pore clogging, further confirming the trapping function of Mn2O3nano-rods in the structure(figures3(c), (d) and S4(b)).
The formation of hierarchical RMC2 was further examined by high angle annular darkfield scanning TEM images (figure S4(b)) which yielded a clear contrast between RuO2
nano-particles and Mn2O3nano-rods. The elemental EDS line scan
results(figure3(c) inset) show the presence of O, Mn, Ru and
C in the structure. The relative positions of these elements
indicate that O, Mn and Ru were across the whole structure, therefore, RuO2/Mn2O3 has grown on the CNF core.
Fur-thermore, SAED pattern of RMC2(figure3(d) inset) consists
of characteristic diffraction rings of (121) and (031) planes attributed to RuO2and those of Mn2O3. The agglomerating
nature of RuO2 nanoparticles was also observed in more
detail in TEM images of RC (figures S4(e) and (f)). The crystallinity of the samples was further analyzed by XRD (figures 4(a) and S5(a)). The XRD pattern of CNF shows a
broad peak at 2θ=25° corresponding to the (002) plane of graphitic carbon. In the diffraction patterns of MC and RMC samples, the peaks at 2θ=33°, 38.2°, 55.4° and 65.8° are corresponding to (222), (004), (044) and (226) planes of Mn2O3(ICSD 98-003-3647), respectively. It can be realized
that Mn2O3gets more crystalline in RMC samples compared
to MC samples which can be owing to the second hydro-thermal step for RuO2 deposition. Also, no obvious peaks
relating to RuO2 were observed in the patterns of RC and
RMC samples which is because of minor amount and small crystal size of RuO2.
Figures 4(b) and S5(b) show the Raman spectra of the
samples, in which there are two main peaks of CNF including D band at 1351 cm−1related to the phonons with A1g
sym-metry and G band at 1584 cm−1 corresponding to the E2g
phonon of sp2carbon atoms[35,36]. The Raman spectra of
MC and RMC samples exhibit three bands at 500, 560 and 620 cm−1 which are corresponding to the asymmetric stretching of bridging oxygen species (Mn–O–Mn) and symmetric stretch of Mn2O3 groups [37–39]. The Raman
spectrum of RC shows two peaks at 520 and 631 cm−1which are related to thefirst order Egand A1gphonon bands of rutile
RuO2 [40]. However, since the peaks of RuO2 and Mn2O3
coincide in the same spectrum region, there is no obvious peak of RuO2in RMCs. The presence of RuO2 in the samples
is further approved by EDS (figure S6) and XPS high reso-lution Ru3d spectra(figure S7) and further confirmation about Mn oxidation state of MC2 and RMCs were determined by XPS analysis(figure S5(c)). The Mn 2p spectra of all samples are mainly composed of two peaks located around∼641.1 eV and ∼652.7 eV corresponding to Mn 2p3/2and Mn 2p1/2 of
Mn3+, respectively, and two minor peaks spectra around ∼643.4 and ∼655.1 eV assigned to Mn4+species[41]. The
effect of mixed Mn oxidation state on the electrochemical
Figure 3.TEM(a), (c) and HRTEM (b), (d) images of MC2 (a), (b) and RMC2(c), (d). Insets in (b) and (d) are the corresponding SAED pattern. Inset in(c) represents the EDS elemental line scan of RMC2 (scale bars, (a): 50 nm, (b) and (d): 5 nm, (c) and inset: 50 nm).
Figure 4.(a) XRD patterns and (b) Raman spectra of CNF, RC, MC2
and RMC2. Inset in(b) represents the enlarged spectra of shaded region.
behavior will be discussed in the following discussion part for the electrochemical results.
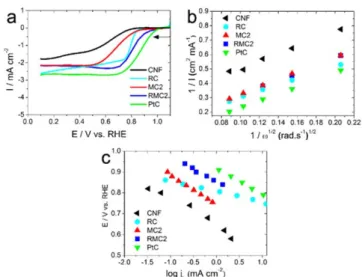
The electrocatalytic ORR activity of the prepared sam-ples was analyzed with RDE measurements from 225 to 1225 rpm with the scan rate of 10 mV s−1 in 0.1 M KOH aqueous solution(figures5(a), S8(a) and S9). The Koutecky–
Levich plots at the steady state currents were also shown in figures5(b) and S8(b). The number of electrons involved in
the ORR per oxygen molecule was determined from the slope using Koutecky–Levich equitation:
w
= + = + /( / ) ( )
j j j j B
1 1 k 1 L 1 k 1 1 2 , 1
where j is the measured current, jk is the kinetic
current density, jL is the Levich current density, B=
0.62nFCD2/3v−1/6, n is the number of electrons transferred per oxygen molecule, F is the Faraday constant i.e. 96 485 C mol−1, C is the dissolved oxygen concentration in the solution (1.26×10⁻⁶mol cm−3), v is the kinematic viscosity of the solution (1.009×10⁻²cm2s−1), D is the diffusion coefficient of oxygen (2.1×10⁻⁵cm2s−1) and ω is the rotation rate(rad s−1). Assuming a four-electron reaction and the known geometric electrode surface area, the theor-etical slope B is 2.5 cm2rad1/2mA−1s−1/2.
The kinetic current density was calculated according to the following equation:
=( ´ ) ( - ) ( )
jk j jL jL j , 2
which is further used to estimate the Tafel slopes(figures5(c)
and S8(c)) to find out ORR kinetics of the catalysts. The slope and constant obtained from the straight line of log jk versus
potential were used to estimate Tafel slope and the exchange current density, respectively. Table 1 summarizes the ORR performance of the materials resulted infigures5and S8. The CNF synthesized from PAN in this study generates nitrogen-doped carbonfibers (table S1) which have been demonstrated as one of the suitable catalysts for ORR. It shows the number
of electrons involved in ORR as 3.4 with Tafel slope of 133 mV dec−1and onset potential of 0.87 V. However, poor stability of such carbon in energy applications needs a further coating of secondary material[42,43].
After Mn2O3coating, ca. 30 mV anodic shift in the onset
potential showed further improvement in the ORR catalysis analyzed at the MC1 and MC2 catalysts. Among MC cata-lysts, electrocatalytic activity towards ORR clearly shows that MC2 is better in terms of most anodic onset potential with lower Tafel slope and higher E1/2 and jk. Although the
number of electrons involved in ORR was less at MC2, better ORR and OER kinetics made it the suitable catalyst for fur-ther RuO2deposition. After RuO2deposition, RMC2 proved
as the best ORR catalyst amongst all RMCs, MCs and RC samples and also comparable with Pt/C catalyst.
The Tafel slope of 121 mV dec−1at RMC2 indicates that first electron transfer is the rate-limiting step. As the RuO2
amount increases from RMC1 to RMC2, catalysis becomes more efficient thermodynamically and kinetically, however, further increase in RuO2 turns out to agglomeration(figures
S3(c) and (d)) which again decreases the efficiency of catalysis in RMC3. The RC catalyst which showed agglom-erated RuO2 morphology in absence of Mn2O3 nano-rods
(figures2(d) and S4(e) and (f)) resulted in the cathodic shift of
70 mV onset potential as compared to RMC2. Thus, the ORR catalysis at RMC2 is proving the synergistic effect of Mn2O3
and RuO2.
From the XPS data (figure S5(c)), it is clear that MC2 and RMC catalysts are composed of both Mn3+and Mn4+. Although Mn2O3was predicted to be a poor catalyst for ORR
[44], it has also been reported that applied potentials can
change the oxidation state of manganese [45, 46].
Further-more, some researchers showed Mn2O3 can also enhance
ORR catalysis in the presence of another catalyst [44, 47].
Therefore, mediated electron transfer from co-catalyst may enhance the ORR catalytic activity at Mn2O3. Based on the
earlier studies, it is proposed that ORR on MnO2can process
through mediation involving the reduction of MnO2 to
MnOOH, followed by electron transfer from Mn3+to oxygen [48,49]. Takashima et al have reported that Mn3+is stable in alkaline solution at the high potential region of OER [50].
However, in the potential window of ORR, due to applied potentials along with the presence of co-catalyst (i.e. RuO2),
the possibility of disproportionation (i.e. to form Mn2+and Mn4+) or reduction of the Mn3+ state cannot be ruled out [49–51]. Thus, following ORR mechanism can be expected
on the MC and RMC catalysts directly at the MnO2 and
disproportionated or reduced Mn4+surface[52]
+ + -« +
-MnO2 H O2 e MnOOH OH
+ « ( ) ‐‐‐ ( )
2MnOOH O2 MnOOH2 O2 ad
+ - + -+
(MnOOH) ‐‐‐2 O2 ad( ) e MnOOH‐‐‐O(ad) OH MnO2
+ -« +
-‐‐‐ ( )
MnOOH Oad e MnO2 OH .
Figure 5.(a) RDE voltammograms with a sweep rate of 10 mV s−1
at 400 rpm in O2-saturated 0.1 M KOH,(b) Koutechy–Levich plots
and(c) Tafel plots of CNF, RC, MC2, RMC2 and Pt/C.
5
Although RuO2is well known for OER, it does possess
ORR catalysis through the mechanism proposed infigure S8-d[53]. The different ratios of Mn2O3:MnO2and change in the
active state of Mn2O3 by applied potential are possible
rationales for the difference in ORR catalytic activity along with the different amounts and morphologies of deposited Mn2O3and RuO2in RMC samples.
The double-layer capacitive region is a precise indicator of an electrochemically active surface area (ECSA). The ECSA of RMCs and RC samples were estimated from the double-layer capacitance (Cdl) by measuring non-Faradic
capacitive current from the CVs measured at different scan rates (figure S10 and figure S10 note). The ECSA was increased from RMC1 to RMC2 due to the higher loading of RuO2on RMC2 sample, but when the amount of RuO2was
further increased in RMC3, ECSA and RF were decreased compared to RMC2 due to the agglomeration of RuO2
nanoparticles. The effect of ECSA and roughness factor(RF) was in agreement with the electrochemical measurements of ORR and OER.
The electrocatalytic activity of the samples towards OER in 0.1 M KOH aqueous solution was measured via LSV (figures6(a) and S11(a)) and the overpotential for OER was
considered as η=E versus RHE—1.23 V. Table 2 sum-marizes all parameters obtained for the samples in this part. As shown, the onset potential of OER at RMC2(η∼0.2 V) is the most cathodic, indicating best OER catalytic activity among these catalysts and in good agreement with the pure RuO2 and Mn-Ru oxide composite [30, 54]. As per the
standard convention, 10% efficient solar water-splitting devices should operate at 10 mA cm−2 below ∼0.45 V
overpotential for combined OER and HER [55, 56]. Thus,
potential required to reach this expected current density (for OER) based on geometric area was compared in table2. The turn over frequency (TOF) value determined at an over-potential of 300 mV for RMC2 was 0.014 s−1, which is consistent with the Mn-Ru-based catalysts [30] and ca. 15
fold higher than the IrOx (0.0089 s−1) catalyst [57] (figure
S11 note).
The kinetic parameters were measured by plotting over-potential against log ( j) for all RMCs and RC samples (figures 6(b) and S11(b)), based on the fundamental
equation(3):
h= + (a 2.3RT anF)log( )j , ( )3 where j is the current density and other symbols have their usual meanings. The lower the value of the Tafel slope, better the catalytic performance with rapid kinetics. The lowest Tafel slope of 52 mV dec−1 was achieved for RMC2 indi-cating better OER kinetics compared to the other samples (table 2). According to the Zeradjanin et al ‘cracked’ RuO2
films exhibited superior OER activity than the ‘crack-free’ structure. In other words, more exposed edges of RuO2
proves better catalytic activity than the plainfilms [58]. Thus,
it proves the importance of morphology of catalysts. Con-sidering this phenomenon, deposition of nanoparticles of RuO2is preferred in this work so that, the nanoparticle
sur-face acts like the cracked sursur-face of RuO2 film to increase
efficient catalytically active sites towards OER. Our results further confirm this hypothesis where RMC2 was superior over RMC3 and RC which have agglomerated RuO2
nano-particles, thus, reducing the edges or catalytically active sites. In addition, better OER catalysis of RMC2 over RMC1 is expected due to the high amount of RuO2 in RMC2. The
overall reaction at the RuO2is elaborated infigure S11(c) as
proposed earlier for the bimetallic composites [55]. Another
possibility of the cathodic shift in the onset potential of OER might be due to the contribution from Mn3+which is stable in an alkaline medium which proved to be effective OER cata-lyst. The SEM and TEM images of RMC samples clearly shows that RuO2forms nanoparticles with partially covering
the surface of Mn2O3, in other words, uncovered surface of
Mn2O3 can act as the sites for OER catalytic reactions.
Takashima et al have reported that in the alkaline solution
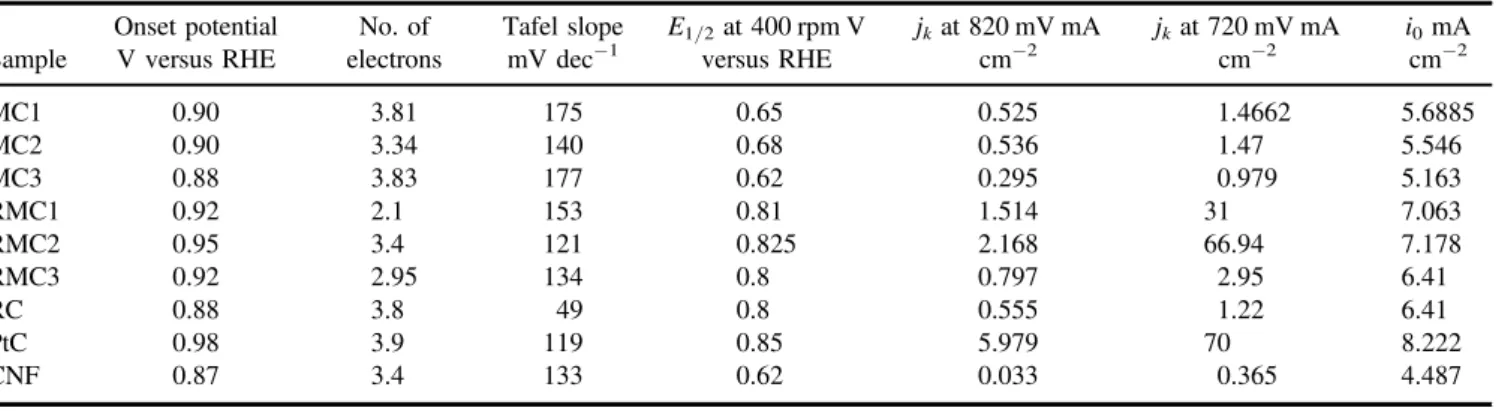
Table 1.Benchmarking parameters of ORR for catalysts in 0.1 M KOH. Sample Onset potential V versus RHE No. of electrons Tafel slope mV dec−1 E1/2at 400 rpm V versus RHE jkat 820 mV mA cm−2 jkat 720 mV mA cm−2 i0mA cm−2 MC1 0.90 3.81 175 0.65 0.525 1.4662 5.6885 MC2 0.90 3.34 140 0.68 0.536 1.47 5.546 MC3 0.88 3.83 177 0.62 0.295 0.979 5.163 RMC1 0.92 2.1 153 0.81 1.514 31 7.063 RMC2 0.95 3.4 121 0.825 2.168 66.94 7.178 RMC3 0.92 2.95 134 0.8 0.797 2.95 6.41 RC 0.88 3.8 49 0.8 0.555 1.22 6.41 PtC 0.98 3.9 119 0.85 5.979 70 8.222 CNF 0.87 3.4 133 0.62 0.033 0.365 4.487
Figure 6.(a) LSVs measured at a sweep rate of 10 mV s−1in N2-saturated 0.1 M KOH and(b) Tafel plots for CNF, RC, MC2,
Table 2.Electrochemical parameters of catalysts towards OER in 0.1 M KOH.
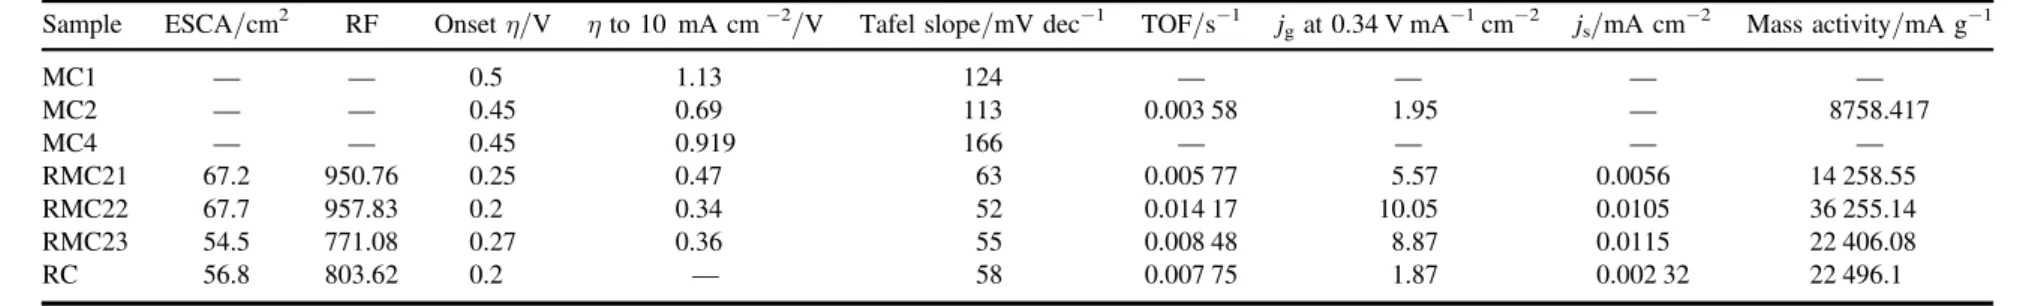
Sample ESCA/cm2 RF Onsetη/V η to 10 mA cm−2/V Tafel slope/mV dec−1 TOF/s−1 jgat 0.34 V mA−1cm−2 js/mA cm−2 Mass activity/mA g−1
MC1 — — 0.5 1.13 124 — — — — MC2 — — 0.45 0.69 113 0.003 58 1.95 — 8758.417 MC4 — — 0.45 0.919 166 — — — — RMC21 67.2 950.76 0.25 0.47 63 0.005 77 5.57 0.0056 14 258.55 RMC22 67.7 957.83 0.2 0.34 52 0.014 17 10.05 0.0105 36 255.14 RMC23 54.5 771.08 0.27 0.36 55 0.008 48 8.87 0.0115 22 406.08 RC 56.8 803.62 0.2 — 58 0.007 75 1.87 0.002 32 22 496.1 7 Nanotechnology 29 (2018 ) 475401 M F T ovini et al
(typically more than pH 9) Mn3+ions are free from the
dis-proportionation reaction and stabilized by a symproportio-nation reaction at high pH using in situ spectroscopic determination [50]. Furthermore, Browne et al also
specu-lated it might be one of the reasons for OER catalytic enhancement at the Mn/Ru complex [30]. Thus, Mn3+ can catalyze OER through the stable symproportionation reaction. Although Mn3+is also acting as OER catalyst, in comparison with MC samples, RMCs show the cathodic shift in the onset potential which clearly shows that contribution of RuO2
nanoparticle edges is higher than the Mn3+catalyst.
Till the date, IrOxand RuO2are considered as the most
favorable state-of-the-art catalysts for the OER. Note that the overpotential required to achieve 10 mA cm−2 of RMC2 (340 mV) is 20 mV anodic to the IrOx (320 mV) and better
than RuO2 (390 mV) [56, 59]. Therefore, overall
enhance-ment in the catalytic activity of RMC samples was expected as the synergistic effect of Mn2O3 and RuO2 towards the
ORR and OER.
In the light of practical applications in non-aqueous media and in order to further confirm excellent synergistic effect in RMC sample, the prepared materials were utilized in Na–O2
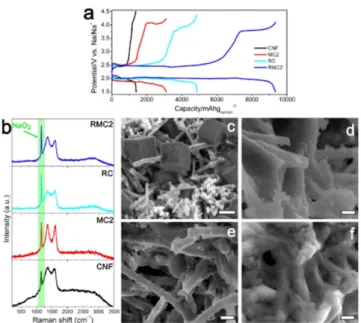
cells as the cathode electrodes. Galvanostatic discharge/ charge tests at 0.05 mA cm−2(figure7(a)) indicate the higher
specific capacity For RMC2 (9352 mAhgcarbon-1) compared with CNF(1395 mAhgcarbon-1), MC2 (3108 mAh g
carbon −1 ) and
RC (4859 mAhgcarbon-1) at the end of discharge with the cutoff potential of 1.5 V. The following charging profiles consist of two main plateaus at lower (∼2.4 V) and higher
(∼4 V) potentials which are assigned to the decomposition of NaO2 and the side products (mainly Na2CO3), respectively
[60]. According to the overall discharge/charge
measure-ments, RMC2 not only exhibits higher specific capacity by promoting the formation and decomposition of NaO2, it
also facilitates side products decomposition during charge at lower potential (3.838 V) compared to CNF (4.226 V), MC2 (4.077 V) and RC (3.963 V). In order to have a better understanding of the nature of discharge product, Raman spectroscopy of the samples at the end of discharge was investigated(figure7(b)). The dominance of the Raman band
at 1156 cm−1 confirms the deposition of NaO2 as the main
discharge product during ORR [4, 61]. However, drastic
morphological differences of deposited NaO2 were observed
between discharged CNF and the other discharged cathodes (figures7(c)–(f) and S12). Figures7(c) and S12 and (e) show
that micron-sized cubic NaO2particles are deposited at CNF
cathode after discharge, compatible with the report of Hart-mann et al[61,62]. By incorporating Mn2O3and/or RuO2on
CNF, no further cubic particle was observed on the discharged cathodes(figures7(d)–(f) and S12), instead, the samples were
buried under a conformal coating of NaO2. This behavior is
well understood in Li–O2batteries in which the morphology
of Li2O2discharge product is transformed from conventional
toroidal particles to film coating by introducing catalyst on the surface of carbonaceous backbones [63, 64]. In fact,
this change is ascribed to the favored adsorption energy of peroxide and superoxide species on the surface of catalyst as the discharge product nucleation spots and the following growth [65, 66]. Therefore, the catalytic reaction can be
performed throughout the entire 3D RMC structure rather than only in some local regions as observed in CNF. There is no precipitate observed in the SEM images of the cathodes after charging, indicating that the cathodes have reversibly recovered their structures at the end of complete discharge/ charge cycle(figure S13). All of the above mentioned results confirm that RMC is an efficient catalyst for both aqueous and non-aqueous media.
4. Conclusions
In this study, a highly effective 3D RuO2/Mn2O3/CNF
ternary composite has been prepared and used as the bi-functional electrocatalyst for ORR/OER. Three sets of Mn2O3/CNF composites with different Mn2O3amounts are
prepared by a microwave synthesis method and according to the electrochemical results towards ORR/OER, the compo-site with medium amount of Mn2O3 is selected for RuO2
deposition in the second microwave synthesis step. The RuO2/Mn2O3/CNF composite demonstrated superior ORR/
OER activity compared to the other samples prepared in this work and state of the art RuO2and IrOx type materials. In
order to validate the applicability of the catalyst in non-aqu-eous media, the catalysts were used as cathode materials in Na–O2cells and RuO2/Mn2O3/CNF showed 6.7 fold specific
capacity as CNF. This enhancement is attributed to the synergistic effect of highly electronically conductive CNF
Figure 7.(a) Galvanostatic discharge/charge plots of CNF,
MC2, RC and RMC2 at a current density of 0.05 mA cm−2, (b) corresponding Raman spectra of the samples at the end of discharge. The dominance of the strong peaks in the Raman spectra at 1156 cm−1(highlighted spectrum) indicates deposition of NaO2as
the main discharge product at the end of discharge. SEM images of (c) CNF, (d) MC2, (e) RC and (f) RMC2 discharged cathodes. Scale bars represent:(c) 1.5 μm and (d)–(f) 500 nm. Conformal distribu-tion of NaO2on MC2, RC and RMC2 indicates the catalytic reaction
core and RuO2–Mn2O3 shell, as well as the novel 3D
morphology of the composite. The more exposed edges and uniform distribution of RuO2 nano-particles in RuO2/
Mn2O3/CNF is due to the trapping effect of Mn2O3
nano-rods, which is confirmed by TEM and SEM results. The 3D design of Mn2O3–RuO2which are of mostly known catalysts
for ORR and OER, respectively, is introduced for the first time in this work, to achieve highly active bi-functional cat-alyst for ORR and OER.
Acknowledgments
This study is financially supported by The Scientific and Technological Research Council of Turkey(TUBITAK) with the project No. 115M375.
ORCID iDs
Mohammad Fathi Tovini https: //orcid.org/0000-0003-4334-4471
Bhushan Patil https://orcid.org/0000-0003-1659-4715
Tamer Uyar https://orcid.org/0000-0002-3989-4481
References
[1] Knudsen K B, Nichols J E, Vegge T, Luntz A C,
McCloskey B D and Hjelm J 2016 J. Phys. Chem. C120
10799
[2] Jiang H R, Wu M C, Zhou X L, Yan X H and Zhao T S 2016 J. Power Sources325 91
[3] Zhao N and Guo X 2015 J. Phys. Chem. C119 25319
[4] Kim J, Park H, Lee B, Seong W M, Lim H-D, Bae Y, Kim H, Kim W K, Ryu K H and Kang K 2016 Nat. Commun.7
10670
[5] Reeve Z E M, Franko C J, Harris K J, Yadegari H, Sun X and Goward G R 2017 J. Am. Chem. Soc.139 595
[6] Landa-Medrano I, Pinedo R, Bi X, Ruiz de Larramendi I, Lezama L, Janek J, Amine K, Lu J and Rojo T 2016 ACS Appl. Mater. Interfaces8 20120
[7] Sayed S Y, Yao K P C, Kwabi D G, Batcho T P, Amanchukwu C V, Feng S, Thompson C V and Shao-Horn Y 2016 Chem. Commun.52 9691
[8] Zhang J, Guo C, Zhang L and Li C M 2013 Chem. Commun.
49 6334
[9] McCloskey B D, Garcia J M and Luntz A C 2014 J. Phys. Chem. Lett.5 1230
[10] Toh R J, Sofer Z and Pumera M 2015 ChemPhysChem16 3527
[11] Su H-Y, Gorlin Y, Man I C, Calle-Vallejo F, Norskov J K, Jaramillo T F and Rossmeisl J 2012 Phys. Chem. Chem. Phys.14 14010
[12] Ye D, Wu T, Cao H, Wang Y, Liu B, Zhang S and Kong J 2015 RSC Adv.5 26710
[13] Cao Y L, Yang H X, Ai X P and Xiao L F 2003 J. Electroanal. Chem.557 127
[14] Gyenge E L and Drillet J-F 2011 J. Electrochem. Soc.159 F23
[15] Lv X, Lv W, Wei W, Zheng X, Zhang C, Zhi L and Yang Q-H 2015 Chem. Commun.51 3911
[16] Li L, Hu Z A, An N, Yang Y Y, Li Z M and Wu H Y 2014 J. Phys. Chem. C118 22865
[17] Liu M, Gan L, Xiong W, Xu Z, Zhu D and Chen L 2014 J. Mater. Chem. A2 2555
[18] Zhao C-F, Lu K and Ma H 2016 RSC Adv.6 107638
[19] Kuo C-H, Li W, Pahalagedara L, El-Sawy A M, Kriz D, Genz N, Guild C, Ressler T, Suib S L and He J 2015 Angew. Chem.127 2375
[20] Frydendal R, Paoli E A, Chorkendorff I, Rossmeisl J and Stephens I E L 2015 Adv. Energy Mater.5 1500991 [21] Li N, Xia W-Y, Wang J, Liu Z-L, Li Q-Y, Chen S-Z,
Xu C-W and Lu X-H 2015 J. Mater. Chem. A3 21308 [22] Xie K, Masa J, Madej E, Yang F, Weide P, Dong W,
Muhler M, Schuhmann W and Xia W 2015 ChemCatChem
7 3027
[23] Gorlin Y and Jaramillo T F 2010 J. Am. Chem. Soc.132 13612
[24] Hu X, Cheng F, Zhang N, Han X and Chen J 2015 Small
11 5545
[25] Jung H-G, Jeong Y S, Park J-B, Sun Y-K, Scrosati B and Lee Y J 2013 ACS Nano7 3532
[26] Jian Z, Liu P, Li F, He P, Guo X, Chen M and Zhou H 2014 Angew. Chem., Int. Ed. Engl. 53 442
[27] Lee Y, Suntivich J, May K J, Perry E E and Shao-Horn Y 2012 J. Phys. Chem. Lett.3 399
[28] Bhowmik T, Kundu M K and Barman S 2016 ACS Appl. Mater. Interfaces8 28678
[29] Yoon K R, Lee G Y, Jung J-W, Kim N-H, Kim S O and Kim I-D 2016 Nano Lett.16 2076
[30] Xu Y-F, Chen Y, Xu G-L, Zhang X-R, Chen Z, Li J-T, Huang L, Amine K and Sun S-G 2016 Nano Energy28
63
[31] Browne M P, Nolan H, Duesberg G S, Colavita P E and Lyons M E G 2016 ACS Catal.6 2408
[32] Zhu J et al 2016 Nat. Commun.7 13432
[33] Mazloumi M, Shadmehr S, Rangom Y, Nazar L F and Tang X 2013 ACS Nano7 4281
[34] Wan Y, Yang Z, Xiong G, Guo R, Liu Z and Luo H 2015 J. Power Sources294 414
[35] Lee J S, Lee C, Jun J, Shin D H and Jang J 2014 J. Mater. Chem. A2 11922
[36] Li W, Zhang L-S, Wang Q, Yu Y, Chen Z, Cao C-Y and Song W-G 2012 J. Mater. Chem.22 15342
[37] Xu J, Gao Q, Zhang Y, Tan Y, Tian W, Zhu L and Jiang L 2014 Sci. Rep.4 5545
[38] Luo Y, Deng Y-Q, Mao W, Yang X-J, Zhu K, Xu J and Han Y-F 2012 J. Phys. Chem. C116 20975
[39] Han Y-F, Chen F, Zhong Z, Ramesh K, Chen L and Widjaja E 2006 J. Phys. Chem. B110 24450
[40] Ren Q, Wang R, Wang H, Key J, Brett D J L, Ji S, Yin S and Shen P K 2016 J. Mater. Chem. A4 7591
[41] Kim Y L, Choi H-A, Lee N-S, Son B, Kim H J, Baik J M, Lee Y, Lee C and Kim M H 2015 Phys. Chem. Chem. Phys.
17 7435
[42] Hou J, Li Y, Mao M, Ren L and Zhao X 2014 ACS Appl. Mater. Interfaces6 14981
[43] Lu J et al 2013 Nat. Commun.4 2383
[44] Ottakam Thotiyl M M, Freunberger S A, Peng Z, Chen Y, Liu Z and Bruce P G 2013 Nat. Mater.12 1050 [45] Mao L, Zhang D, Sotomura T, Nakatsu K, Koshiba N and
Ohsaka T 2003 Electrochim. Acta48 1015
[46] Jahan M, Tominaka S and Henzie J 2016 Dalton Trans.45 18494
[47] Kozawa A and Powers R A 1966 J. Electrochem. Soc.113 870
[48] Gorlin Y, Chung C-J, Nordlund D, Clemens B M and Jaramillo T F 2012 ACS Catal.2 2687
[49] Lima F H B, Calegaro M L and Ticianelli E A 2007 Electrochim. Acta52 3732
[50] Tang Q, Jiang L, Liu J, Wang S and Sun G 2014 ACS Catal.
4 457
9
[51] Takashima T, Hashimoto K and Nakamura R 2012 J. Am. Chem. Soc.134 1519
[52] Cheng F, Zhang T, Zhang Y, Du J, Han X and Chen J 2013 Angew. Chem., Int. Ed. Engl. 52 2474
[53] Valim R B, Santos M C, Lanza M R V, Machado S A S, Lima F H B and Calegaro M L 2012 Electrochim. Acta
85 423
[54] Prakash J and Joachin H 2000 Electrochim. Acta45 2289
[55] Godwin I J, Doyle R L and Lyons M E G 2014 J. Electrochem. Soc.161 F906
[56] Walter M G, Warren E L, McKone J R, Boettcher S W, Mi Q, Santori E A and Lewis N S 2010 Chem. Rev.110
6446
[57] McCrory C C L, Jung S, Peters J C and Jaramillo T F 2013 J. Am. Chem. Soc.135 16977
[58] Trotochaud L, Ranney J K, Williams K N and Boettcher S W 2012 J. Am. Chem. Soc.134 17253
[59] Zeradjanin A R, Topalov A A, Van Overmeere Q, Cherevko S, Chen X, Ventosa E, Schuhmann W and Mayrhofer K J J 2014 RSC Adv.4 9579
[60] Sun Q et al 2017 Adv. Funct. Mater.27 1606662
[61] Hartmann P, Bender C L, Vračar M, Dürr A K, Garsuch A, Janek J and Adelhelm P 2013 Nat. Mater.12 228 [62] Hartmann P, Bender C L, Sann J, Durr A K, Jansen M,
Janek J and Adelhelm P 2013 Phys. Chem. Chem. Phys.15
11661
[63] Yilmaz E, Yogi C, Yamanaka K, Ohta T and Byon H R 2013 Nano Lett.13 4679
[64] Yang Y, Zhang T, Wang X, Chen L, Wu N, Liu W, Lu H, Xiao L, Fu L and Zhuang L 2016 ACS Appl. Mater. Interfaces8 21350
[65] Yang Y et al 2017 ACS Appl. Mater. Interfaces9 19800
[66] Krishnamurthy D, Hansen H A and Viswanathan V 2016 ACS Energy Lett.1 162