NEW APPROACH FOR DESIGNING cVEP
BCI STIMULI BASED ON SUPERPOSITION
OF EDGE RESPONSES
a thesis submitted to
the graduate school of engineering and science
of bilkent university
in partial fulfillment of the requirements for
the degree of
master of science
in
electrical and electronics engineering
By
Muhammad Nabi Yasinzai
January 2020
New Approach For Designing cVEP BCI Stimuli Based On Superposi-tion of Edge Responses
By Muhammad Nabi Yasinzai January 2020
We certify that we have read this thesis and that in our opinion it is fully adequate, in scope and in quality, as a thesis for the degree of Master of Science.
Yusuf Ziya ˙Ider (Advisor)
Hacı Hulusi Kafalıg¨on¨ul
Ye¸sim Serina˘gao˘glu Do˘grus¨oz
Approved for the Graduate School of Engineering and Science:
Ezhan Kara¸san
ABSTRACT
NEW APPROACH FOR DESIGNING cVEP BCI
STIMULI BASED ON SUPERPOSITION OF EDGE
RESPONSES
Muhammad Nabi Yasinzai
M.S. in Electrical and Electronics Engineering Advisor: Yusuf Ziya ˙Ider
January 2020
Electroencephalography (EEG) based brain-computer interfaces (BCIs) are widely used in the field of neural engineering, due to their portability, nonin-vasive nature, and high temporal resolution properties. Among the different BCI modalities, code modulated visual evoked potentials (cVEP) are very popular due to their high classification speed and accuracy. Over the years, various cVEP stimulus sequences have been designed aiming to increase the classification speed, accuracy, and the number of supported targets. This study is carried out in or-der to present a novel cVEP stimulus sequence designing methodology, which is purely based on characteristics of the actual brain responses to visual stimuli.
Seven male subjects participated in our study, and they were presented pulse-type visual stimulus sequences on a monitor with 60 Hz refresh rate (each bit of a stimulus sequence is presented for 16.67 ms). EEG was recorded using Brain Products V-Amp (16 channel) EEG Amplifier from O1, Oz, O2, P3, Pz, P4, P7, and P8 positions at the rate of 2000 sps and the recorded EEG was then bandpass filtered between 4 and 40 Hz. Electrode impedances were kept under 10 KOhms, and Canonical Correlation Analysis (CCA) was used to reduce the 8-channel data to a single signal. Matlab, along with psychtoolbox, was used for stimulus presentation on a PC with Ubuntu operating system.
In the first part of this study, our aim was to reconstruct the EEG response to pulse-type stimulus patterns by superposing the EEG responses to simple stimulus patterns. It is observed that the EEG response is only sensitive to the changes in the stimulus sequence, that is, to positive (change from Black to White) and negative edges (change from White to Black). The edge responses have a delay of around 50 ms, and these responses can be observed up to 350
iv
ms after the edge. Furthermore, the magnitude of the positive edge response is much larger than the negative edge response. Edge responses for every person are unique, and they are also repeatable. The 7 subjects of our experimental study have an overall average correlation of 84% between the positive edge responses obtained with two weeks of separation. It is also interesting to know that edge responses for all of the subjects have a similar overall pattern.
A series of experiments are then carried out to determine how well the EEG responses can be predicted by superposition of the edge responses. The recon-structed and measured EEG responses are compared for different pulse widths, different pulse separations, and also for different pulse repetitions. It is observed that response to 1 and 2 bit wide pulses can be predicted accurately for all sub-jects with an average correlation of 70.3% and 68.1%, respectively. Further, for 1 bit wide pulses, if the separation between two pulses is 4 to 9 bits, the correlation between predicted and measured responses is above 51.5%. For 2 bit wide pulses, if the separation is between 3 and 9 bits, the correlation is above 53.4%. Fur-thermore, responses to repeating 2 and 3 bit wide pulses can be predicted with a correlation of up to 62.4% and 59.2% for 4 and 5 repetitions, respectively.
In the third part of this study, we constructed 120 bit stimulus sequences based on the constraints explained above and compared them with two other types of stimulus sequences in the context of a BCI speller application. The proposed BCI speller consists of 36 targets that are presented as a 6x6 matrix on the monitor screen at the refresh rate of 60 Hz, and the experiments are performed on seven healthy subjects. The classification results of our BCI speller follow our expectations based on the second part of our study; in that, for our proposed BCI stimulus sequences, the accuracy and ITR are recorded to be 95.5% and 57.19 bits/min, respectively, whereas for the other two types of codes, the classification accuracies are 6.94% and 10.53% with information transfer rates (ITR) of 1.7 bits/min and 10.53 bits/min, respectively.
Keywords: Brain-computer interface (BCI), Electroencephalogram (EEG), code-modulated visual evoked potential (c-VEP), Modeling, canonical correlation anal-ysis (CCA).
¨
OZET
KMGUP BBA UYARI TASARIMI ˙IC
¸ ˙IN KENAR
TEPKELER˙IN˙IN S ¨
UPERPOZ˙ISYONUNA DAYANAN
YEN˙I YAKLAS
¸IM
Muhammad Nabi Yasinzai
Elektrik ve Elektronik M¨uhendisli˘gi, Y¨uksek Lisans Tez Danı¸smanı: Yusuf Ziya ˙Ider
Ocak 2019
Elektroensefalografi (EEG) bazlı Beyin-Makina Aray¨uzleri (BBA) n¨ oro-m¨uhendislik alanında, ta¸sınabilir olmaları, invaziv olmamaları, ve y¨uksek za-mansal rezol¨usyona sahip olmaları sebebiyle yaygın olarak kullanılmaktadırlar. De˘gi¸sik BBA modaliteleri arasında, kod mod¨ulasyonlu uyarılmı¸s potansiyeller (KMGUP), y¨uksek sınıflandırma hız ve do˘grulukları dolayısıyla, ¸cok pop¨ulerdir. Yıllar i¸cinde, sınıflandırma hız ve do˘grulu˘gunu ve desteklenen hedef sayısını artırmak anamcıyla, ¸ce¸sitli KMGUP uyarı dizinleri tasarlanmı¸stır. Bu ¸calı¸sma, tamamen beynin g¨orsel uyarılara verdi˘gi tepkelerin ¨ozellikleri baz alınarak, yeni bir KMGUP uyarı dizini tasarımı metodolojisi sunmak amacıyla yapılmı¸stır.
C¸ alı¸smamıza katılan yedi erkek dene˘ge 60 Hz yineleme hızlı bir monit¨orden darbe-tipli g¨orsel uyarı dizinleri sunulmu¸stur (uyarı dizininin her bir biti 16.67 ms s¨ure tutmaktadır). EEG, Brain Products V-Amp 16-kanal EEG Amfisiyle O1, Oz, O2, P3, Pz, P4, P7, ve P8 pozisyonlarından 2000 ¨ornek/saniye hızıyla kaydedilmi¸s ve 4Hz ila 40 Hz arasında bant-ge¸ciren filtreyle filtrelenmi¸stir. Elek-trot empedansları 10 KOhm altında tutulmu¸s, ve 8 kanal veri Kanonik Korelasyon Analizi (CCA) y¨ontemiyle tek sinyale indirilmi¸stir. Psychtoolbox ve bereberinde Matlab kullanılarak uyarı sunumu Ubuntu i¸sletim sistemi i¸ceren bir Ki¸sisel Bil-gisayarla ger¸ceklenmi¸stir.
C¸ alı¸smamızın birinci kısmında amacımız darbe-tipi uyarı dizinlerine olan EEG tepkelerini basit uyarı ¨or¨unt¨ulerine verilen EEG tepkelerinden s¨uperpozisyon yoluyla olu¸sturabilmektir. EEG tepkelerinin sadece uyarı dizinindeki de˘gi¸simlere yani pozitif (Siyahtan Beyaza d¨on¨u¸sme) ve negatif (Beyazdan Siyaha d¨on¨u¸sme) kenarlara hassas oldu˘gunu g¨ozlemledik. Kenar tepkeleri 50 ms gecikmeyle kenar-dan itibaren 350 ms boyunca s¨urmektedir. Pozitif kenar tepkesi negatif tepkeden
vi
genlik olarak olduk¸ca fazladır. Her dene˘gin kenar tepkeleri kendine ¨ozg¨ud¨ur ve aynı zamanda tekrar edilebilirdir. Deneylere katılan 7 denekte iki hafta arayla elde edilmi¸s olan iki kenar tepkesi birbiriyle ortalamada %84 korelasyona sahiptir. Di˘ger taraftan deneklerin kenar tepkeleri genel hatlarıyla birbirlerine benzemek-tedir.
Daha sonra EEG tepkelerinin, kenar tepkelerinden s¨uperpozisyon yoluyla ne kadar do˘grulukla elde edilebildi˘gini sınamak i¸cin deneyler yapıldı. Olu¸sturulan ve kaydedilen EEG tepkeleri, farklı darbe uzunlukları, farklı darbe aralıkları ve de farklı darbe tekrarları i¸cin kar¸sıla¸stırıldı. 1 ve 2 bit uzunluktaki darbelere olan tepkelerin sırasıyla %70.3 ve %68.1 korelasyonla olu¸sturulabildi˘gi g¨ozlemlendi. ˙Ilaveten, iki adet 1 bitlik darbenin arasındakı bo¸slu˘gun 4 ila 9 bit arasında olması durumunda, olu¸sturulan ve ¨ol¸c¨ulen tepkeler arasındaki korelasyon %51.1’den fazla olmaktadır. 2 bit uzunlu˘gundaki darbeler i¸cin ise iki darbe arasındaki bo¸sluk 3 ila 9 bit arasındaysa, s¨oz konusu korelasyon %53.4’ten y¨uksek olmaktadır. Tekrar-lanan 2 ve 3 bit uzunlu˘gundaki darbeler i¸cin, e˘ger tekrarlanma sayısı 4 veya 5 ise, EEG tepkeleri sırasıyla %62.4 ve %59.2 korelasyonla ¨ong¨or¨ulebilmektedir.
C¸ alı¸smamızın ¨u¸c¨unc¨u kısmında, yukarıda g¨ozlemlendi˘gi belirtilen kısıtlamalar g¨oz ¨on¨une alınarak hazırladı˘gımız 120 bit uzunlu˘gunda uyarı dizinlerini, ve di˘ger ba¸ska iki tip uyarı dizinlerini bir BBA heceleyici uygulamasında kar¸sıla¸stırdık. 36 hedefe sahip olan BBA heceleyici 60 Hz yineleme hızlı bir monit¨or kullanılarak 7 deneyde uygulandı. C¸ alı¸smamızın ikinci kısmında elde edilen g¨ozlemlerlerden beklenenlere uygun olarak, ¨onerdi˘gimiz dizinlerle, sınıflandırma do˘grulu˘gu ve En-formasyon Transfer Hızı (ITR) sırasıyla %95.5 ve 57.19 bit/s olurken, di˘ger iki dizin tipiyle sınıflandırma do˘grulu˘gu %6.94 ve %10.53, ITR ise 1.7 bit/s ve 10.53 bit/s oldu.
Anahtar s¨ozc¨ukler : Beyin-Bilgisayar Aray¨uz¨u (BBA), Elektroansefalografi (EEG), kod-mod¨ulasyonlu g¨orsel uyarılmı¸s potansitel (KMGUP), modelleme, kanonik korelasyon analizi (KKA).
Acknowledgement
All praises and thanks to Almighty Allah; the ultimate source of all knowledge to mankind and for His endless blessings for humanity.
I want to express my gratitude to my family for their love, support, guidance, and for keeping their faith in me. Their support and presence give me the strength and courage to work hard and to chase my goals.
I am grateful to my supervisor Professor Yufus Ziya Ider (Department of Elec-trical and Electronics Engineering, Bilkent University) for believing in me. I am thankful for his guidance, support, cooperation, and constant feedback. His com-mitment to our project motivated me to push my limits and deliver my best. I am very thankful to Kamilla Shah for her support, assistance, and for keep-ing faith in me. Her continued consultation and encouragement helped me a lot in achieving my goals.
I am thankful to the BCI group members, Abdul Waheed, Suleman Memon, and Toygun Basaklar, who have been great friends and mentors for their support and guidance.
I am grateful to Caner Yıldırım, Muhammad Hilal, Sina Gholizadeh, M. Anjum Qureshi, Salahuddin Zafar, M. Aamir Saeed and Daniyal Namdar for participat-ing in the experiments.
I gratefully acknowledge the funding received from the Scientific and Techno-logical Research Council of Turkey (T ¨UB˙ITAK) under Grant 116E153 during my MSc studies.
Contents
1 Introduction 1
1.1 Background . . . 1
1.1.1 Brain-Computer Interfaces (BCIs) . . . 1
1.1.2 Electroencephalography (EEG) . . . 3
1.1.3 Visual Evoked Potential (VEP) . . . 6
1.1.4 Code-Modulated Visual Evoked Potential (cVEP) . . . 8
1.1.5 Model Based Paradigms For BCI Design . . . 11
1.2 Objective And Scope . . . 13
1.3 Organization Of Thesis . . . 14
2 Materials And Methods 15 2.1 Experimental Setup . . . 15
2.1.1 Participants . . . 16
CONTENTS ix
2.1.3 Data Acquisition . . . 18
2.1.4 Data Preprocessing . . . 19
2.2 Stimulus Sequences . . . 20
2.2.1 Long-Pulse Stimulus Patterns . . . 20
2.2.2 Stimulus Sequences with Simple Patterns . . . 23
2.2.3 Stimulus Sequences For BCI Speller . . . 28
2.3 BCI Training And Testing . . . 29
3 Results 31 3.1 EEG Response To Long Pulses (Obtaining The Edge Responses) . 31 3.2 Repeatability Of The Edge (onset and offset) Responses . . . 34
3.3 Superposition Based Model For Prediction cVEP Responses . . . 35
3.4 Model Prediction Performance For Simple Stimulus Patterns . . . 37
3.4.1 Prediction Performance For Different Pulse Widths . . . . 37
3.4.2 Prediction Performance For Different Pulse Separations . . 40
3.4.3 Prediction Performance For Different Pulse Repetitions . . 46
3.5 Model Prediction Performance For Long Stimulus Sequences . . . 55
3.6 BCI Results . . . 60
CONTENTS x
A Data Acquired During the Experiments 71
B Software Used in Experiments and in Post-processing 73
C Repeated Measures ANOVA and Paired t-test 74 C.1 Stimulus With Different Pulse Widths . . . 74 C.2 Stimulus With Different Separations between 1 bit wide pulse . . 76 C.3 Stimulus With Different Separations between 2 bit wide pulse . . 77 C.4 Stimulus With Different Repetitions of 1 bit wide pulse . . . 79 C.5 Stimulus With Different Repetitions of 2 bit wide pulse . . . 80 C.6 Stimulus With Different Repetitions of 3 bit wide pulse . . . 81
List of Figures
1.1 Flow diagram of a general BCI system . . . 2 1.2 10-20 International Electrode Placement System . . . 6 1.3 The Figure shows a single stimulus frame of cVEP BCI speller
while the targets are flickering based on their assigned psedo-random sequence. The 36 stimulus targets are arranged in a 6x6 matrix, and each target is assigned to a letter/number/character. The targets are flashed black and white when the corresponding bit of the pseudo-random sequence is 0 and 1. . . 9
LIST OF FIGURES xii
2.1 For a better understanding of our BCI speller stimulus, the above two frames are captured. The stimulus consists of 36 targets in total with the corresponding characters written in the center of each target. The frame on the top is captured before flickering the targets with the stimulus sequences. The pink rectangle guides the users to focus their gaze on the target A, and it will then disappear before the targets start flashing. Later, each target of the stimulus will start flashing according to its stimulus sequences. The bottom frame in the Figure is captured while each target is flashing according to their assigned stimulus sequence. All of the 36 targets of the stimulus are either black or white, depending upon the value of their particular sequence bit to be either a 0 or 1, respectively. . . 17 2.2 Three long-pulse stimulus sequences are used for acquiring EEG
from one subject; a) The individual pulse of the stimulus has fixed width of 250 ms along with uniform random width between 0 - 125 ms. b) Positive and negative pulses has 375 ms fixed and 180 ms variable width. c) The pulses in sequence has 500 ms fixed width and 250 ms variable width. . . 22 2.3 long-pulse stimulus sequence waveform designed for recording
pos-itive and negative pulse responses of 7 subjects. The initial width of 500 ms for each pulse is kept fixed whereas, the remaining width is randomly chosen betwene 0 and 250 ms. . . 23 2.4 120 bit stimulus sequences, including pulses of different width, are
shown in this Figure. The blue regions of the waveforms represent the pulses, which are under investigation. The stimulus sequences are named PW15 and PW69, and they include pulse widths of 1-5 and 6-9, respectively. The green sections of the stimulus represent the regions where no pulse is applied. The widths of all of the sections of the stimulus sequences are mentioned in bits where 1 bit is equal to 16.667 ms. . . 24
LIST OF FIGURES xiii
2.5 This Figure displays 120 bit stimulus sequences for recording EEG data for different separation intervals between 1 bit wide pulses. The stimulus sequences are named PS15W1 and PS69W1, which include pulse separations of 1-5 and 6-9 bits, respectively. The length of each pulse and the separation distance are mentioned below each sequence. . . 25 2.6 This Figure displays 120 bit stimulus sequences for recording EEG
data for different separation intervals between 2 bit wide pulses. The stimulus sequences are named PS15W2 and PS69W2, which include pulse separation intervals of 1-5 and 6-9 bits, respectively. The length of each pulse and the separation distance are mentioned below each sequence. . . 26 2.7 This Figure displays 120 bit stimulus sequences for recording EEG
data for different repetitions (3 to 6 repetitions) of 1 bit wide pulses. The stimulus sequence for this experiment is named as PR36W1. The blue segment of the waveform represents the pulse repetition patterns under investigation, whereas the green-colored regions of the waveform represent the regions where no pulse is applied. . . 27 2.8 This Figure displays 120 bit stimulus sequences for recording EEG
data for different repetitions (3 to 5 repetitions) of 2 bit wide pulses. The stimulus sequence for this experiment is named as PR35W2. The blue segment of the waveform represents the pulse repetition patterns under investigation, whereas the green-colored regions of the waveform represent the regions where no pulse is applied. . . 27
LIST OF FIGURES xiv
2.9 This Figure displays 120 bit stimulus sequences for recording EEG data for different repetitions (2 to 4 repetitions) of 3 bit wide pulses. The stimulus sequence for this experiment is named as PR24W3. The blue segment of the waveform represents the pulse repetition patterns under investigation, whereas the green-colored regions of the waveform represent the regions where no pulse is applied. . . 28 2.10 In this Figure three different types of stimulus sequences assigned
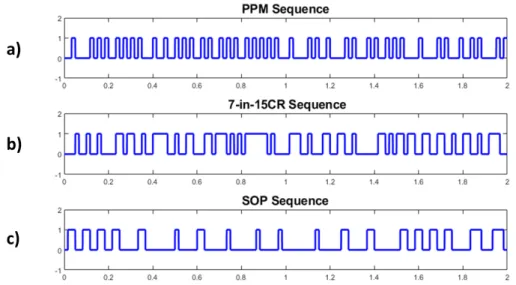
to the target A of our BCI stimulus are plotted. Figure a) provides an illustration for PPM Sequence, b) for 7-in-15CR Sequences, and c) for SOP sequences. . . 29
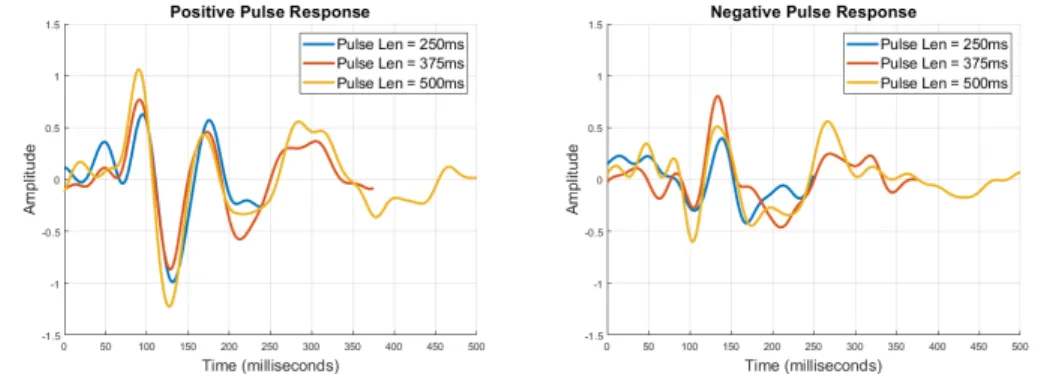
3.1 a) Positive pulses responses for pulse widths of 250 ms, 375 ms, and 500 ms are presented as blue, red, and orange colored signals. b) Negative pulse responses for 250 ms, 375 ms, and 500 ms of pulse widths are shown in blue, red, and orange colors. . . 32 3.2 The signals on the left represent the onset responses for each
sub-ject, whereas the signals on the right represent the offset responses. The blue signals are the individual onset and offset responses of the subjects. However, the red signals are the averaged onset and offset responses over all subjects. . . 33 3.3 The signals on the left represent the onset responses for each
sub-ject, whereas the signals on the right represent the offset responses for each subject. Furthermore, the blue and red signal represents the onset and offset response acquired form experiment 1 and ex-periment 2, respectively. . . 35
LIST OF FIGURES xv
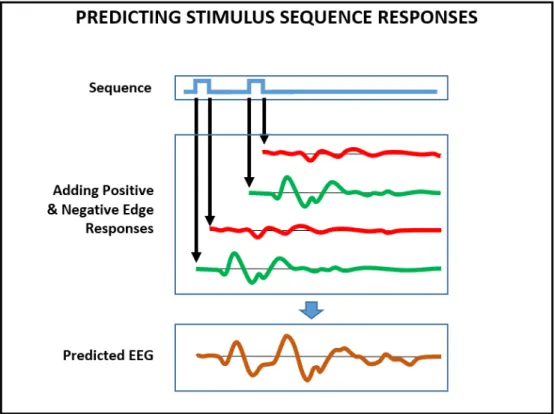
3.4 This Figure illustrates the process of predicting the EEG response of a simple stimulus pattern using the superposition-based model. The blue waveform represents the stimulus pattern, and it consists of 2 pulses only. The green and red signals are the onset and offset responses that are added based on their location in the sequence to get the predicted EEG (orange signal). . . 36 3.5 Comparison of the generated and observed EEG responses for
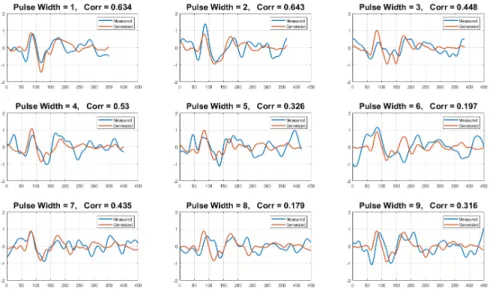
var-ious pulse width sizes ranging from 1 to 9 bits. The pulse widths are mentioned above each figure along with the correlation value. The blue signals are the measured EEG response, whereas the red signals are generated EEG response. . . 38 3.6 Graph for average correlation values for different pulse widths
over-all subjects. . . 39 3.7 Comparision of the acquired and generated EEG responses for
dif-ferent separation intervals (from 1 bits to 9 bits) between 1 bit wide pulses of Subject 1. The signals in blue are the recorded EEG responses, and the red signals represent the generated EEG response from the superposition-based model. Information on the pulse separations, pulse width, and correlation values are provided above each graph. . . 41 3.8 Graph for average correlation values for different separations
be-tween 1 bit wide pulses, overall subjects. . . 42 3.9 Comparison between measured and generated EEG for different
separation lengths between 2 bit wide pulses. The blue signal is the measured response whereas the red signal is the generated response. The pulse separation values are mention above each plot along with the pulse width size and the correlation values between generated and measured signals. . . 44
LIST OF FIGURES xvi
3.10 Graph for average correlation values for different separations be-tween 2 bit wide pulses, overall subjects. . . 44 3.11 Comparison between measured and generated EEG for 3, 4, 5 and 6
repetitions of 1 bit pulse. The blue signal is the measured response whereas the red signal is the generated response. The number of pulse repetitions is mention above each plot along with the pulse width size and the correlation values. . . 47 3.12 Graph for average correlation values for different repetitions of 1
bit wide pulse, overall subjects. . . 48 3.13 Comparison between measured and generated EEG for 3, 4, and 5
repetitions of 2 bit wide pulse. The blue signals are the measured responses, whereas the red signals are the generated responses. The number of pulse repetitions is mention above each plot along with the information on pulse width and the correlation value. . 50 3.14 Graph for average correlation values for different repetitions of 2
bit wide pulse, overall subjects. . . 51 3.15 Comparison between measured and generated EEG for 2, 3, and 4
repetitions of 3 bit wide pulse. The blue signals are the measured EEG responses, whereas the red signals are the generated EEG responses. The number of pulse repetitions is mention above each plot along with the information on pulse width and the correlation value. . . 53 3.16 Graph for average correlation values for different repetitions of 3
LIST OF FIGURES xvii
3.17 Comparison of the generated and the measured EEG responses for three types of stimulus sequences (assigned to the target A of the BCI speller). The observed signals are the average responses of 2 trials. Blue signals are the recorded EEG responses, whereas the signals in red, are the generated EEG responses. The 3 stimulus sequences are; a) PPM Sequence, b) 7-in-15CR Sequence, and c) SOP Sequence. . . 57 3.18 This figure provides a comparison of the generated and the
mea-sured EEG responses of SOP sequence for subject 3. Blue signals are the recorded EEG responses, whereas the signals in red, are the generated EEG responses. . . 59 3.19 This Figure provides a comparison of the generated and the
mea-sured EEG responses of subject 7, for three types of stimulus se-quences. Blue signals are the recorded EEG responses, whereas the signals in red, are the generated EEG responses. The 3 stimulus sequences are; a) PPM Sequences, b) 7-in-15CR Sequences and c) SOP Sequences. . . 59
List of Tables
3.1 Correlation values between generated and recorded EEG responses of 1-9 bit stimulus pulses are provided in this table. The rows of the table provided information on the individual subject, whereas the data for different stimulus pulse widths are provided in columns of the table. The last row of the table contains the average correlation values for 1-9 bit pulse widths overall subjects. . . 40 3.2 Correlation values between generated and recorded EEG responses
of 1-9 bit separations between 1 bit pulses, for all 7 subjects, are provided in this table. The rows of the table provided information on the individual subject, whereas the data for different separation between pulses are provided in colums of the table. The last row of the table contains the overall average correlation values for 1-9 bit separations between pulses. . . 43 3.3 Correlation values between generated and recorded EEG responses
of 1-9 bit separations between 2 bit pulses, for all 7 subjects, are provided in this table. The rows of the table provided information on the individual subject, whereas the data for different separation between pulses are provided in columns of the table. The last row of the table contains the overall average correlation values for 1-9 bit separations between pulses. . . 46
LIST OF TABLES xix
3.4 Correlation values between generated and recorded EEG responses of 2, 3, 4, 5, and 6 repetitions of 1 bit wide pulse for 7 subjects are provided in this table. The rows of the table provides information on the individual subject, whereas the data for different repetitions of 1 bit pulse is provided in columns of the table. The last row of the table contains the overall average correlation values for 2, 3, 4, 5, and 6 repetitions of 1 bit wide pulse. . . 49 3.5 Correlation between generated and recorded EEG responses of 2,
3, 4, and 5 repetitions of 2 bit wide pulse for 7 subjects are provided in this table. The rows of the table provided information on the individual subject, whereas the data for different repetitions of 2 bit pulse is provided in columns of the table. The last row of the table contains the overall average correlation values for 2, 3, 4, and 5 repetitions of 2 bit wide pulse. . . 52 3.6 Correlation between generated and recorded EEG responses of 2,
3, and 4 repetitions of 3 bit wide pulse for 7 subjects are provided in this table. The rows of the table provided information on the individual subject, whereas the data for different repetitions of 3 bit pulse is provided in columns of the table. The last row of the table contains the overall average correlation values for 2, 3, and 4 repetitions of 3 bit wide pulse. . . 55 3.7 This table provides correlation values between the generated and
observed EEG response of 7 subjects for PPM sequence, 7-in-15CR sequence, and SOP sequence. The last row provides the overall correlation values for the three types of stimulus sequences. . . . 58 3.8 Accuracy values of BCI application using 3 different types of
stim-ulus sequences. . . 61
C.1 Repeated measures ANOVA test on the correlations obtained for different pulses widths. . . 74
LIST OF TABLES xx
C.2 Pair wise paired t-test on the correlations obtained for different pulses widths (PW). In this table, 1 shows that the data comes from different distribution, and 0 shows that the data is from the same distribution (at 5% significance level). . . 75 C.3 P-Values of Pair wise paired t-test on the correlations obtained for
different pulses widths (PW). . . 75 C.4 Repeated measures ANOVA test on the correlations obtained for
different pulse separations between 1 bit wide pulses. . . 76 C.5 Pair wise paired t-test on the correlations obtained for different
pulse separations between 1 bit pulses (PS1). In this table, 1 shows that the data comes from different distribution, and 0 shows that the data is from the same distribution (at 5% significance level). 76 C.6 P-Values of Pair wise paired t-test on the correlations obtained for
different separations between 1 bit wide pulses (PS1). . . 77 C.7 Repeated measures ANOVA test on the correlations obtained for
different pulse separations between 2 bit wide pulses. . . 77 C.8 Pair wise paired t-test on the correlations obtained for different
pulse separations between 2 bit pulses (PS2). In this table, 1 shows that the data comes from different distribution, and 0 shows that the data is from the same distribution (at 5% significance level). 78 C.9 P-Values of Pair wise paired t-test on the correlations obtained for
different separations between 2 bit wide pulses (PS2). . . 78 C.10 Repeated measures ANOVA test on the correlations obtained for
LIST OF TABLES xxi
C.11 Pair wise paired t-test on the correlations obtained for different of 1 bit wide pulse (PR1). In this table, 1 shows that the data comes from different distribution, and 0 shows that the data is from the same distribution (at 5% significance level). . . 79 C.12 P-Values of Pair wise paired t-test on the correlations obtained for
different repetitions of 1 bit wide pulse (PR1). . . 80 C.13 Repeated measures ANOVA test on the correlations obtained for
different repetitions of 2 bit wide pulse. . . 80 C.14 Pair wise paired t-test on the correlations obtained for different
repetitions of 2 bit wide pulse (PR2). In this table, 1 shows that the data comes from different distribution, and 0 shows that the data is from the same distribution (at 5% significance level). . . . 81 C.15 P-Values of Pair wise paired t-test on the correlations obtained for
different repetitions of 2 bit wide pulse (PR2). . . 81 C.16 Repeated measures ANOVA test on the correlations obtained for
different repetitions of 3 bit wide pulse. . . 82 C.17 Pair wise paired t-test on the correlations obtained for different
repetitions of 3 bit wide pulse (PR3). In this table, 1 shows that the data comes from different distribution, and 0 shows that the data is from the same distribution (at 5% significance level). . . . 82 C.18 P-Values of Pair wise paired t-test on the correlations obtained for
Chapter 1
Introduction
1.1
Background
1.1.1
Brain-Computer Interfaces (BCIs)
BCI is a powerful communication system that provides a user, the capability to interact with the surroundings using brain signals [1]. The ability to control the environment based on brain electrical signals is a subject of interest for a long time. BCI has numerous applications in the real world, they include drowsiness detection of car drivers [2], controlling the position of computer cursor on the screen [3], finding the mental concentration levels [4], determining the emotions of a person [5] and typing using a visual keyboard [6]. The biggest beneficiaries of the BCI systems are the people with motor disabilities. BCI is helping them to interact with the environment using brain signals which involves minimal muscle movements [7]. EEG based BCI is very popular in the field of neural engineering because of their portability, non-invasive and the temporal resolution properties of the EEG. There are different types of BCI systems and every kind of BCI system uses different EEG control signals. Out of these BCI modalities, the most popular are event-related potentials (ERPs) and visually evoked potentials (VEPs) [8]. The popularity of ERP and VEP based BCI is due to the feasibility
of these approaches in clinical practices along with their low training time and high information transfer rate, and because of these reasons they are the most researched approaches for BCI systems [9].
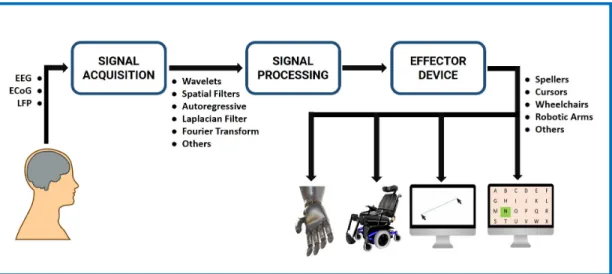
A BCI system consists of 5 stages. These stages are named as signal ac-quisition, signal preprocessing, feature extraction, classification, and control interface[10]. The general design of a BCI system is shown in Figure 1.1. In the signal acquisition stage, signals from the brain are recorded. These signals are due to the hemodynamic activity or electrophysiological activity of the brain. Hemodynamic activity accounts for events of difference in glucose delivery to the active and inactive neurons [11]. Glucose to the active neurons is delivered at a higher rate than the inactive neurons. As a result, the oxyhemoglobin ratio increases in the active region which can be easily distinguished. Whereas, elec-trophysiological activity is observed when the information from one neuron is passed to the other neuron using electrochemical transmitters [8]. In our study, we determine the electrophysiological activity of the brain by placing electrodes at different locations on the scalp, and the electrical signals generated by the brain electrophysiological activity are recorded from these electrodes.
Figure 1.1: Flow diagram of a general BCI system
The second stage of the BCI system is the preprocessing stage where the signals acquired from all of the electrodes are filtered. In this stage, the signals can also
be spatially filtered which further removes the noise and transforms multi-channel signals into a single-channel signal. Furthermore, the shape of the signal is also altered, which is then utilized by the feature extraction stage. In the Feature extraction stage, distinct informative features are extracted from the preprocessed EEG, which are then used for the task of classification. Acquiring good features is very important because EEG from the scalp is very noisy and it also includes noise from electrooculography (EOG) and electromyography (EMG) activity of the brain [7]. The acquired features are then used for the task of classification to determine the user intent. The classification stage decodes the command that needs to be executed based on the EEG acquired from the user. Finally, the control interface stage allows the user to interact with the surroundings. In this stage, a specific command is executed which is selected in the classification stage. The available commands for the user are based on the type BCI application, like spelling a word [6], controlling a wheelchair [12], and the cursor of a computer [3].
1.1.2
Electroencephalography (EEG)
EEG is a procedure that is performed to record and track the electrophysiolog-ical activity of the brain. These electrelectrophysiolog-ical signals are the result of the electrelectrophysiolog-ical impulses through the synaptic connections between the neurons. EEG based neu-rodiagnostic techniques are widely used in clinical diagnosis and brain research because of its low cost, noninvasive nature, portability, and high temporal res-olution. Recording EEG is a very simple and easy process, and it is done by placing EEG electrodes on the scalp of the person. These electrodes detect the electrical signal generated by the electrophysiological activity of the brain. There are two different types of electrodes for acquiring EEG; they are wet electrodes and dry electrodes. A conductive gel is applied to the scalp of the subject when wet electrodes are used for acquiring the EEG. The gel acts as a bridge between the electrodes and the scalp lowering electrode-scalp contact impedance, whereas the dry electrodes do not require any gel. The EEG recording system is also very easy to operate. It consists of amplifiers, analog to digital converter, and a
recording device (computer). EEG electrodes acquire the electrical signals from the scalp, which is amplified by the amplifier and then converted into a digital form using analog to digital converter (ADC). Amplifying the signal is necessary because the amplitude of the EEG signal is in millivolts, so it cannot be directly converted into digital form with high accuracy. The accuracy of the ADC is better when the input signals given to the ADC are amplified. The recorded signal is then stored in computer memory and can be displayed for visualization. Electrodes for most of the EEG acquisition system consist of a pre-amplification module immediately after the skin-contact pin of the electrode allowing the sig-nal to be amplified before it is affected by additive noise between the electrodes and the amplifier. Such electrodes are called active electrodes. If the electrodes don’t have any pre-amplification module then they are called passive electrodes. Further, the signal to noise ratio for the active electrodes is much better than the passive electrodes.
EEG signal acquisition setup consists of 3 types of electrodes, ground elec-trode, active electrodes, and a reference electrode. The recorded EEG signal is the potential difference between active electrodes and the reference electrode. However, the ground electrode is used to measure the differential voltage, which is utilized to reduce the noise from the reference and active electrodes. EEG can be recorded as uni-polar or bi-polar measurements. In unipolar measurements, the voltage difference of active electrodes to the reference electrode is recorded, whereas in bi-polar setup, the potential difference between two active electrodes is recorded. Most of the electrodes which are used for EEG acquisition contains small thick pins of silver chloride (AgCl)[13]. The amplitude of the EEG signal acquired from the skull of the subject is in millivolts, which is too low for ADC to convert it in digital form with reasonable accuracy. Therefore, it is amplified using a high gain amplifier of the order of x100000, which, as a result, gives an excellent digitized signal.
The EEG acquired from the scalp is very susceptible to noise generated from different muscle activities, due to this reason, having a good contact between the scalp and the electrode is very necessary. Usually, the impedance between the scalp and electrode is kept below 10 KΩ [14] for good signal quality and
it is achieved by applying conductive gel between the scalp and the electrodes. This gel is responsible for making a low impedance bridge between the electrode and the scalp. The use of gel makes it a wet type electrode setup. However, dry electrode setup does not use any gel to improve the conductivity of electrode-scalp contact. Wet electrode setup provides a better EEG signal quality with low noise compared to the dry electrode setup, but it requires continuous maintenance. Regardless of the type of electrode used, the user should stay stationary while recording his/her EEG to minimize noise due to neuromuscular movements, and necessary steps should be taken to reduce the noise due to interference by both external and internal sources. The external sources include power lines whereas, thermal, flicker and burst noises are taken as internal noises [15].
Furthermore, EEG signals are divided into 5 categories based on the frequency range of these signal. These classes are named as delta (δ), theta (θ), alpha (α), beta (β), and gamma (γ) rhythms. These different rhythms observed in the EEG corresponds to different activities or state of mind of the person. Delta band consists of the EEG signal components from 0 to 4 Hz. Delta rhythms are only observed in adults when they are in a state of deep sleep. Delta rhythms are very hard to monitor because of its low-frequency nature, and it can easily be distorted by the muscle movements of the neck and jaw [16]. EEG signal components in the range of 4-7 Hz are termed as theta band. Theta rhythms are generated due to the cognitive and concentration activities of a person [17]. An example of such an activity is performing mental calculations. The alpha band consists of the EEG components between 8-12 Hz. The amplitude of alpha rhythms is susceptible to an increase in the mental effort, and due to this reason, alpha rhythms are best observed when the person is relaxed or in the eyes-closed state [18]. Beta rhythms consist of frequencies between 12 to 20 Hz. They are observed in frontal and central lobe of the brain and these rhythms are due to the motor activities carried out by the brain [19]. EEG frequencies between 30-100 Hz are termed as gamma rhythms, and these are associated with specific perceptions or motor functions [20].
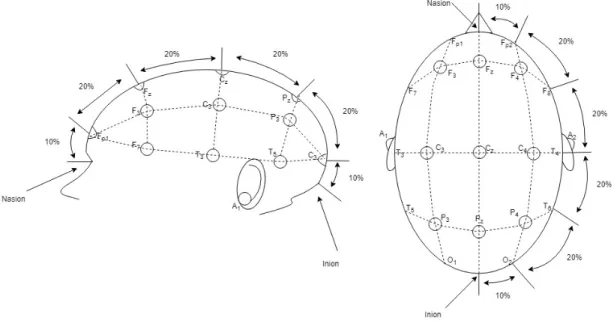
The placement of electrodes in our EEG setup is according to the International 10-20 EEG electrode placement system [21]. In this system, 2 reference points on
the scalp are used to determine the relative positions of all of the electrodes. The first reference point is the nasion, at the center of the forehead, above the nose whereas, the other reference point is located at inion, which is under the bump at the back of the skull. The positions of the electrodes are marked as 10% and 20% at the transverse and median planes [21]. The locations of the electrodes are shown in Figure 1.2. The electrode position are named with letters, and each letter represents a specific region of the brain. For instance, C represents the cen-tral lobe, A- represents the ear lobe, P- the parietal lobe, Pg- the nasopharyngeal region, Fp- the frontal polar region, F- the frontal area and O- represents the occipital lobe of the brain.
Figure 1.2: 10-20 International Electrode Placement System
1.1.3
Visual Evoked Potential (VEP)
VEPs are the electrophysiological signals generated in response to a visual stim-ulus and they are recorded by placing electrodes around the scalp near the vi-sual cortex [22]. VEPs can be classified based on three different criteria, by the morphology of visual stimuli, by the frequency of visual stimuli, and by field of stimulation. According to the morphology of the visual stimuli, VEPs can be
categorized based on flashing visual stimulation or by using graphic patterns in the visual stimulation such as a random-dot map, gate, and checkerboard lattice. According to the frequency, visual evoked potentials can be further classified into two types, steady-state visually evoked potentials (SSVEPs) and transient evoked potentials (TVEPs). The Evoked potential is SSVEP when the visual stimulus is periodic with a frequency of 6 Hz or above[8]. The analysis for SSVEP sig-nals is carried out in the frequency domain. However, TVEP occurs when the frequency of the stimulus is less than 6 Hz [8] . Finally, according to the field of stimulation, VEPs can be classified into whole field VEPs, half field VEPs, and part field VEPs depending upon the area of the on-screen visual stimulus. For instance, a half field VEP stimulus will be induced if one half of the monitor is displaying the visual stimulus, and the other half of the monitor is not displaying any graphics, and the subject is looking at the center of the monitor screen. It is worth mentioning that different VEPs based visual stimulus patterns generate different EEG responses.
VEPs are generally used for the task of target classification, and due to this reason, the goal is to design the input stimuli in such a way to obtain orthogonal VEP responses for different targets in order to identify them with better accuracy. VEPs can be generated from visual stimulators of different types of light sources, with different color and brightness properties. However, the flashing pattern of the visual stimulus determines the type of the generated VEP response. Further-more, SSVEP based BCI modalities can be further classified into code modulated VEPs (cVEPs), frequency modulated VEPs (f-VEPs), and time modulated VEPs (t-VEPs). cVEP are the evoked responses, generated in the visual cortex as a response to random binary sequences of a specified length [23]. The visual stimu-lus is flashed ON when the corresponding bit of the binary sequences is “1”, and the stimulus is flashed OFF when the corresponding bit in the sequence is “0”. t-VEPs are the EEG responses generated as a result of applying a visual stimulus sequence for each target that is orthogonal in time [8]. f-VEPs are the periodic EEG responses which can be observed in the occipital lobe when the stimulus for each target is flashed with distinct periodic frequencies [24].
1.1.4
Code-Modulated Visual Evoked Potential (cVEP)
In recent years, visually evoked potentials based on the cVEP modality have become very popular among the BCI community because of its promising classi-fication accuracy and its capability to classify large number of targets per minute, quantified as information transfer rate (ITR) [25]. ITR is a standard measurement metric used in the BCI community for determining the overall speed of the BCI system. In cVEP based BCI system, the stimulus of each target is assigned with a pseudo-random sequence such that every target has its own distinct sequence [23]. The pseudo-random binary sequence has combinations of “0” and “1” only. These binary digits of the sequence represent the intensity levels of the visual stimulus; 0 represents low-intensity value (Black color) whereas, 1 represents high stimulus intensity (White color). The binary sequence can also represent different colors of the visual stimulus. For instance, Toygun et al. [26] used colored stimulus for cVEP based BCI application. In their study, 0 is represented by “Blue” colored flash, and 1 is represented by “Green” colored flash.
For cVEP based BCI, the EEG responses for all of the targets should be acquired to do classification. However, this will increase the training time if the responses for the targets are to be obtained individually. Generally, the sequence for one of the target is acquired, and the cVEP stimulus pattern for the rest of the targets are obtained by circularly shifting the target of the first pattern [23]. Each target of the visual stimulus then flickers according to its assigned pseudo-random sequence. As a result, cVEP responses are then observed in the EEG acquired from the visual cortex, depending on the target focused by the subject. In order to assign the stimulus patterns to the targets, m-sequences are generally preferred [23]. The idea of using m-sequences for cVEP based BCI is because m-sequences and their time-lagged versions are nearly orthogonal to each other. The auto-correlation of the m-sequence is similar to the impulse function. It is desired to have orthogonal EEG responses for the targets because it will make the task of classification easy; therefore, the responses from the m-sequences are assumed to be orthogonal. However, the human brain is nonlinear in nature, and the generated responses of the m-sequences and its time-lagged versions may not
be orthogonal to each other [26] . The variable m, mentioned in m-sequence, defines the size of linear feedback shift register, which is required to generate m-sequence; furthermore, the formula 2m− 1 is used to determine the length of
m-sequence [27].
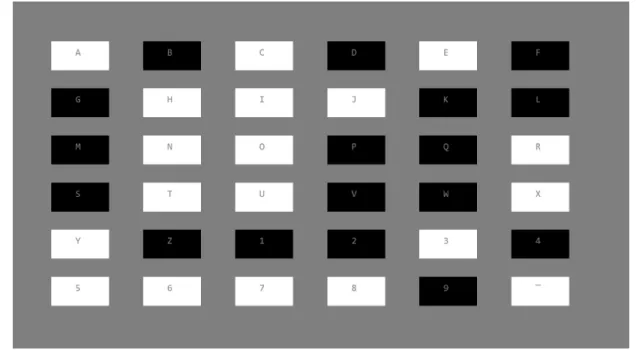
The stimulus of the cVEP based BCI is usually presented on monitor screen, which is divided into a matrix based on the number of targets and each cell of the matrix is assigned to a specific target. The targets represent the different choices available for the subject to interact with the surroundings based on the BCI application. In BCI speller applications, the targets are assigned to letters, numbers, and other characters. The arrangement of the targets for our BCI speller application is shown in Figure 1.3. The background of every target is flickered based on its assigned stimulus sequence. The subject focuses on a particular target of choice, and the corresponding EEG response is then recorded on the computer.
Figure 1.3: The Figure shows a single stimulus frame of cVEP BCI speller while the targets are flickering based on their assigned psedo-random sequence. The 36 stimulus targets are arranged in a 6x6 matrix, and each target is assigned to a letter/number/character. The targets are flashed black and white when the corresponding bit of the pseudo-random sequence is 0 and 1.
In cVEP, the flashing frequency of individual bits of the stimulus sequence is limited by the frequency of the monitor. The stimulus bits can be flashed at a frequency equal to the refresh rate of the monitor. Hence, each bit is displayed for the duration of a single frame. The majority of the cVEP BCI systems use 60 Hz as the stimulus frequency, which means each bit of the sequence is flashed for 16.667 milliseconds. Furthermore, the number of available targets in the cVEP BCI system depends on the length of m-sequence, longer the length of the sequence is the more target will be supported by the BCI systems but the information transfer rate of the BCI system will decrease. Hence, there is a tradeoff between the information transfer rate and the number of supported targets by the BCI application. Another method to increase the number of targets is to decrease the size of the circular shift, but this will impact the accuracy of the classifier. For instance, a 63 bit long m-sequence with a 2 bit shift is very popular and commonly used in cVEP BCI spellers, and it supports a total of 32 targets. The 63 bit m-sequence is generated using a linear feedback shift register, and it is then assigned to one of the 32 targets [28]. The stimulus sequences for the remaining 31 targets are obtained by circularly shifting the m-sequence by two bits successively.
During training, the EEG responses (also known as templates) for all of the targets are acquired. Let, the total number of targets in BCI speller is denoted by T. The EEG response for the m-sequence of length L is obtained for just one of the T targets by performing an experiment. The EEG is recorded for N trials, and the reference template for that target is obtained by taking the average over N trials. The templates for the rest of the targets (T-1) are obtained by circularly shifting the EEG template for that target [24]. This method of acquiring EEG responses for the targets is commonly used by the BCI community because it requires less training time. During testing, the subject focuses his/her gaze on any of the T targets (for one trial) and the corresponding EEG response is then correlated with the templates of all targets. Finally, the target with maximum correlation is selected.
1.1.5
Model Based Paradigms For BCI Design
BCI research is mainly focused on application-specific approaches, where the main goal is to increase target classification speed (ITR) and the accuracy of the classifier. Most of the BCI applications are designed without considering the actual nature of the brain. However, there are some studies which aim to model brain responses to random stimulus pattern, but they use machine learning approaches to predict the EEG responses from stimulus patterns which again does not provide any insight on how the brain responds to visual stimuli [29], [30]. Hence, the concept of making a cVEP BCI system based on the properties of brain responses to the visual stimulus pattern is still untouched.
However, researchers have focused on modeling the brain responses for tran-sient and steady-state conditions for different visual stimuli. A physiological based corticothalamic model was proposed by Robison et al [31] . which aimed to model different features of EEG, including event-related potentials and dis-crete spectral peaks in all of the EEG frequency bands. Later, Roberts et al. [32] used the Robinson corticothalamic model to explain the nonlinear behavior of the cortical activity when the subject is presented with a periodic stimulus. Robinson’s corticothalamic model was highly nonlinear with a large number of second-order filters along with feedback loops, making it very hard to learn the parameters for optimizing the model. In order to decrease the complexity, a lin-ear model was proposed by Zhang et al. [33]. In this model second-order linlin-ear system was proposed to model the transient response of the SSVEP.
In 2018, Negal et al. [29] proposed a moving average model for predicting the EEG responses to arbitrary stimulus patterns. They also proposed an inverse model by which they predicted the stimulus pattern from the EEG. The reported accuracy and ITR values for BCI speller is surprisingly high. Later in 2019 [30], they used convolutional neural network models for classifying BCI targets and reported further improvement in the accuracy and ITR metrics. However, all of the methods mentioned above do not provide any insight about how the brain responses to different stimulus patterns. These model-based approaches
for BCI applications have shown improvements in target classification accuracy and increase in information transfer rate. The parameters of the models are optimized during the training stage, and then the EEG responses for all of the targets are generated using the learned model. During the test stage, the acquired EEG response is correlated with the model-generated responses of all targets, and the target with the maximum correlation is chosen. The advantage of using model-based approaches includes reduced training time and increase the number of possible targets [29].
In section 1.1.4, we mentioned the use of m-sequences to reduce the training time. By using m-sequences, we perform experiment for only one target, and the EEG templates for the rest of the targets are obtained by circularly shifting the EEG template for that target. However, if arbitrary sequences are used for all of the targets, then for each target, an experiment should be performed to record their EEG responses, which will take a lot of time. This is where the model-based approaches come in to play. Hence, by using a model, EEG response can be predicted for an arbitrary number of stimulus patterns, and the number of BCI targets can be easily increased.
1.2
Objective And Scope
In the first part of our study, we aim to decompose the stimulus sequences into simple patterns and then reconstruct the EEG response for the stimulus sequences by superposing the EEG responses of the simple patterns. Hence, we decompose the stimulus sequences into positive and negative edges. Where positive edge corresponds to the change in stimulus color from black to white, and the negative edge corresponds to the change in stimulus color from white to black. This decomposition of the stimulus sequences is done based on the fact that EEG is sensitive to only the edges of the stimulus, and it will be explained in chapter 3. First, we obtain the EEG responses for the positive and the negative edges, and then we predict the responses for any arbitrary sequences using superposition of the edge responses. The next task was to investigate how well the EEG can be reconstructed based on the structure of the stimulus sequences. A series of experiments are conducted with simple stimulus patterns to investigate the similarity between the actual and the generated EEG (Details on the experiments are provided in chapter 2). The main goal is to investigate to what extent does the superposition holds and to find out the necessary conditions on the structure of the stimulus sequences whose EEG response can be predicted with high accuracy. In the third part of the study, we implement a superposition-based BCI ap-plication as mentioned above. A 36 target stimulus is used for the BCI speller where each target was assigned a 120 bit long binary stimulus sequence. During the training, the positive and negative edge responses are acquired, and the EEG response for all of the target stimulus sequences are predicted by the superposi-tion of the edge responses. There different types of stimulus sequences are tested. Furthermore, one type of sequence is optimized according to the findings from the first part of the study. The goal here is to observe if there is a significant improvement in the classification accuracy of BCI application for this sequence type.
1.3
Organization Of Thesis
This thesis has 3 chapters: material and methods, results, and discus-sion/conclusion.
In chapter 2 (Materials and Methods), the experimental setup, EEG acquisi-tion procedure, and the BCI system design are discussed in detail. Furthermore, it provides details of the experiments for recording the positive and negative edge responses. It also provides the details of the experiments where the predicted EEG is compared to the acquired EEG for simple stimulus patterns. Finally, a BCI speller based on the superposition model is discussed in detail.
In chapter 3 (Results), the results obtained from the experiments are analyzed. In this chapter, the acquired edge responses are discussed. It also discusses the proposed superposition model for predicting EEG responses to arbitrary stimulus patterns, and the predicted EEG for simple stimulus patterns are analyzed and compared with the recorded EEG. Finally, the performance of the BCI application in terms of classification accuracy and ITR is discussed.
In chapter 4, (discussion and conclusion) the general discussion is provided and the study is concluded.
Chapter 2
Materials And Methods
Information on the experimental setup and the different types of stimulus se-quences designed for this study are provided in this chapter. Furthermore, this chapter also provide details on the training and testing process of the proposed BCI speller application.
2.1
Experimental Setup
A BCI speller application is designed for performing experiments, and the com-plete setup consists of two computers and an EEG amplifier. The visual stimulus is presented to the subject on one computer, while the EEG is recorded to the other computer. The EEG amplifier detects and amplifies the EEG signal from the brain and sends it to the computer where the EEG data is being recorded. Information on the subjects, experimental design, and procedures are discussed in the following subsections.
2.1.1
Participants
The study is carried out on 7 male participants with a mean age of 29.7 years and a standard deviation of 5.5 years. All the participants signed a written consent form, which has been approved by the ethical committee of Bilkent University. The participants were guided and informed about the nature of the experiments. All of the subjects had corrected or corrected to normal vision, with good mental health, and participants with any history of epilepsy, neurological disorders, mi-graines, and visual impairments were excluded before the start of the experiment to avoid complications. The subjects were also informed that flashing stimulus might cause epileptic seizures.
2.1.2
Stimulus Design Setup
Matlab environment, along with psychtoolbox [34] is used for designing the stim-ulus, and for displaying the stimstim-ulus, Dell Alienware (AW2518HF) monitor is used, which is a 25-inch LED monitor capable of displaying up to a frame rate of 240 Hz. However, our study is based on a 60 Hz refresh rate for each target, so the frame rate of the monitor is set to 60 Hz, and the resolution of the monitor is set to 1920 x 1080 pixels. Furthermore, the participants were seated in front of the monitor at a distance of 80 cm. The visual stimulus consists of 36 targets in total, and they are arranged in a 6 x 6 grid, as shown in Figure 2.1. Every target cell of the matrix is assigned to a letter, number or symbol, displayed at its center. Additionally, each target cell has a rectangular shape of 5.18 cm x 2.6 cm (180 x 90 pixels ). The 36 stimulus targets include 26 upper case alphabet from A to Z, nine numbers from 1 to 9 and a “-” symbol (see Figure 2.1). During experiment, the targets are flashed between black and white, depending on their stimulus sequence. The color of a specific target is replaced with black when the corresponding bit of the stimulus sequence is 0, and it is replaced with white when the corresponding bit of the stimulus sequence is 1. Each bit of the stimulus is presented for a single frame, which is equal to 16.667 ms.
Figure 2.1: For a better understanding of our BCI speller stimulus, the above two frames are captured. The stimulus consists of 36 targets in total with the corresponding characters written in the center of each target. The frame on the top is captured before flickering the targets with the stimulus sequences. The pink rectangle guides the users to focus their gaze on the target A, and it will then disappear before the targets start flashing. Later, each target of the stimulus will start flashing according to its stimulus sequences. The bottom frame in the Figure is captured while each target is flashing according to their assigned stimulus sequence. All of the 36 targets of the stimulus are either black or white, depending upon the value of their particular sequence bit to be either a 0 or 1, respectively.
Ubuntu 18.04, with a low latency kernel, is used on the computer for the accurate timings of the visual stimulus patterns. We will refer to this computer as the stimulus computer in this document for ease in referral. The missed frame counter of psychtoolbox is monitored by displaying its value on the terminal at the end of the experiment to assure that no frames are dropped during the experiment. In order to find the accurate refresh rate of the monitor we used a pinhole diode circuit and we place it close to the monitor. A rectangular region on the monitor equal to the size of a single target was flashed between black and white. The actual refresh rate of the monitor was found to be 59.98 Hz [35]. While recording the EEG response to the visual stimulus, a marker signal is also passed from the stimulus computer into the EEG amplifier to keep track of the flashing (displaying time) time of each bit in the sequence. The marker signal plays a vital role for synchronization of the responses when the average EEG responses are to be obtained. We also conducted an experiment to find the exact delay between the frame updates and the marker pulse. This delay was measured to be 280 microseconds and can easily be ignored [36].
2.1.3
Data Acquisition
For recording EEG, V-Amp, 16 channel EEG amplifier (Brain Products, Gilch-ing, Germany) is used at 2000 sampling frequency along with the actiCAP (EEG cap), which has 32 electrode placement positions designed according to the inter-national 10-20 electrode placement system. A total of 8 active electrodes are used in the experiment located on occipital and parietal areas of the brain. Active wet electrodes are used to acquire the EEG from the O1, Oz, O2, P3, Pz, P4, P7, and P8. Furthermore, the reference electrode is placed on FCz location, and the ground electrode is placed above nasion at the center of the forehead. In order to have a good signal quality, the impedance of each electrode is set below 10 KΩ. The ImpBox (Brain Products, Gilching, Germany) was used to monitor the impedance of the electrodes. To record the EEG responses for the targets and the marker locations on the recording computer BCI2000 [37] along with fieldtrip [38] are used.
2.1.4
Data Preprocessing
After recording the EEG responses, the EEG signals were first filtered by using a 4-40 Hz bandpass filter. Then it was further passed through a 50 Hz notch filter to remove all of the remaining 50 Hz interference from the signal. Later, the average EEG responses were obtained by taking the mean over multiple trials of EEG responses by utilizing the synchronization markers.
The signals were also spatially filtered by using the coefficients obtained from canonical correlation analysis (CCA). The EEG responses from 9 stimulus se-quences, mentioned in section 2.2.2 were used to find the CCA cofficients. These sequences are 120 bit long, and the EEG was recorded for 30 trials of these se-quences. The length of a single trial of EEG response was 4000 samples, and the EEG data consists of 8 channels. So, for a single experiment (120 bit stimulus with 30 repetitions), the size of the acquired EEG is 8x120,000. Further, the average EEG responses of the 30 trials were obtained, and it was then replicated 30 times, and hence we get an overall averaged signal equal to the dimension of the unaveraged signal (8x120,000). The data was then arranged as a 2D array labeled as X and Y where X was obtained by concatenating the unaveraged data from 9 experiments. Similarly, Y was obtained by concatenating the re-peated averaged signal from 9 experiments. Hence, the total length of X and Y becomes 8x1080,000. The purpose of CCA is to find the linear combination of the un-averaged signal X and the linear combination of the averaged signal Y such that the correlation between X and Y is maximized. The maximizing function of CCA is given in equation 2.1
maximize Wx,Wy ρ(X, Y ) = E[W T x XYTWy] E[WT xXXTWx]E[WyTY YTWy] (2.1)
Whereas Wx is the weight vector for the variable X, and Wy is the weight
vector for the variable. Y . The weight coefficients Wx (8 × 1) are the resulting
spatial filter coefficients, and they are multiplied with the 8 channel EEG data to get a single channel spatially filtered EEG data. Spatial filtering improves
the signal quality and makes the processing easy because of the reduction of 8 dimensional EEG signal to a single dimension. The “canoncorr” function is used in Matlab to find the spatial filter coefficients.
2.2
Stimulus Sequences
Three types of experiments were conducted in our study with different stimulus sequences. In the first type of experiment, EEG responses to long stimuli pulses were obtained. The stimulus sequences for the first type contains alternating bi-nary levels (1 and 0) with a random number of bits for each level. In the second type of experiment, EEG responses were acquired for 9 different 120 bit stimulus sequences with simple patterns. Whereas, in the last type, a BCI speller appli-cation was tested for three different types of stimulus sequences. The stimulus sequences designed for each type of experiment will be discussed in their respec-tive subsections below. However, the experimental setup and the preprocessing steps are the same for all of them.
2.2.1
Long-Pulse Stimulus Patterns
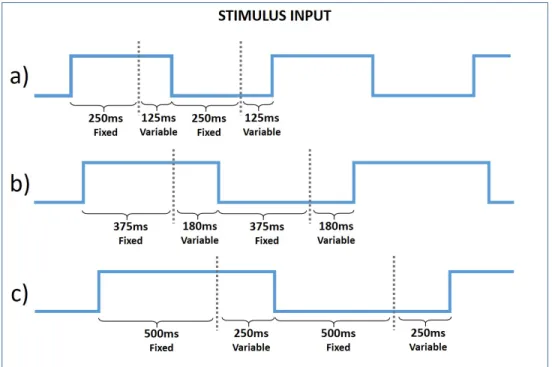
In the first type of experiment, EEG responses are recorded for long-pulse stim-ulus sequences, as shown in Figure 2.2. It should be noted that the stimstim-ulus sequences are presented as waveforms rather than binary sequences for ease in understanding. A low value of the waveform corresponds to the black color of the stimulus, whereas a high value corresponds to the white color of the stimulus pattern. EEG responses are acquired for these 3 stimulus waveforms with dif-ferent pulse widths, as shown in Figure 2.2 from just one subject. Furthermore, the positive and negative pulses for these stimulus sequences are repeated for 100 trials. In the first stimulus sequence, the width of the positive and negative pulse is 250 ms + V, where V is a uniform random variable from 0-125 ms. Hence, for each positive and negative pulse in this sequence, the pulse width is randomly chosen between 250 ms - 375 ms in order to remove any artifacts which might be
observed if the stimulus sequence was periodic. Similarly, for the second stimulus sequence, the size of the pulse is randomly chosen between 375 ms - 555 ms, and the size of each pulse of the third sequence is randomly chosen between 500 - 750 ms.
It should be noted that the length of each pulse is displayed in milliseconds (see Figure 2.2), but the actual stimulus sequences are represented in bits, and a single bit corresponds to 16.667 ms. In other words, a single bit is displayed on the monitor for 16.667 ms, which means the stimulus sequence is time discretized with the 16.667 ms as smallest display time for a single bit in the sequence. Hence the total length of the stimulus sequence will always be a multiple of this interval. Consider the first stimulus pattern (see Figure 2.2a); initially, a random value between 250 ms - 375 ms is generated for each positive and negative level of the waveform. Later, N number of bits are appended to the sequences in such a way that the actual pulse width (N × 16.667ms) is equal to or greater than the randomly chosen value. For instance, consider a positive pulse has to append the sequence and 301 ms is randomly chosen for the width of the pulse. The sequence will be appended by 19 ones, which is around 316.6 ms (19 × 16.667ms). We do not append it with 18 ones because the width will become 300 ms (18×16.667ms) which is smaller than the randomly chosen width (301). Furthermore, the index of the start of the positive and negative levels of the stimulus sequences are recorded, which will help in synchronizing the EEG acquired for multiple trials of pulses in order to get the average EEG pulse response correctly.
The stimulus sequences provided in Figure 2.2, were assigned to the target A, whereas, the rest of the stimulus targets were assigned randomly generated sequences. The subject was asked to focus his gaze on letter A and the EEG data resulting from the three experiments (see Fig 2.2) was saved on the recording computer. Later, it was preprocessed, and then the averaged responses for the positive and negative pulses were obtained. The average EEG was obtained for only the fixed width of the pulse, which is 250 ms, 375 ms, and 500 ms for stimulus sequences in Figure 2.2a, 2.2b, and 2.2c, respectively.
Figure 2.2: Three long-pulse stimulus sequences are used for acquiring EEG from one subject; a) The individual pulse of the stimulus has fixed width of 250 ms along with uniform random width between 0 - 125 ms. b) Positive and negative pulses has 375 ms fixed and 180 ms variable width. c) The pulses in sequence has 500 ms fixed width and 250 ms variable width.
Later, for all of the 7 subjects in our study, the stimulus sequence shown in Figure 2.3 is used for acquiring the EEG response to long-pulses. Here a stimulus pattern with alternating pulses of 1’s and 0’s with a width of 500ms + V for each pulse was employed where V is a uniform random variable between 0 and 250 ms. Note: this is the same waveform as the one given in Figure 2.2c. The stimulus sequence designed for obtaining the long-pulse response for 500 ms wide pulses (see Figure 2.3) consists of 20 positive and negative pulses. A total of 8 such stimulus sequences are generated randomly, so in total, there are 160 positive and negative pulses in the 8 stimulus sequences. Training is done in 8 individual sessions to record the edge responses, and in each session, the subject is presented with one of the 8 stimulus sequences. As we know for each positive and negative pulse, the initial width of 500 ms is fixed, and the rest is randomly generated. Therefore, the acquired EEG responses are truncated up to 500 ms for
each pulse, and then these responses are averaged to remove the additive noise. During training, these sequences are assigned to target A, whereas the sequences for the remaining targets are generated randomly. Furthermore, the subjects are instructed to focus their gaze on the target A, and the corresponding EEG is then recorded on the recording computer.
Figure 2.3: long-pulse stimulus sequence waveform designed for recording positive and negative pulse responses of 7 subjects. The initial width of 500 ms for each pulse is kept fixed whereas, the remaining width is randomly chosen betwene 0 and 250 ms.
2.2.2
Stimulus Sequences with Simple Patterns
In the second type of experiment, EEG responses are recorded for stimulus se-quences with generic pulse patterns to carryout three different studies. These studies are discussed in detail in chapter 3. In the first study, EEG responses resulting from different pulse widths in the stimulus sequence are investigated. Whereas, in the second study, the EEG is recorded for different separation dis-tances between the pulses. Finally, in the third study, stimuli with pulse repe-titions are investigated. A total of 9 different stimulus sequences are prepared to carry out these studies, and each stimulus sequence consists of 120 bits, pre-sented at 60 Hz frame rate of the monitor. Hence, a single trial of the stimulus sequence will take two seconds to complete. Furthermore, the stimulus patterns are repeated for 30 trials to get a good averaged signal. Therefore, the total time for recording the EEG of a single stimulus sequence takes 1 minute, and
the total experiments for this study take about 9 minutes. All of the 9 stim-ulus sequences are assigned to target A while recording their EEG responses, whereas, the remaining targets are assigned randomly-generated binary stimulus sequences. Furthermore, the subjects are instructed to focus their gaze on target A before starting the experiment.
2.2.2.1 Stimulus Sequences With Different Pulse Widths
In this study, EEG responses are recorded for stimulus sequences comprising of pulses with different widths (see Figure 2.4). The stimulus sequences for this study are named as PW15 and PW69 for ease in referral. Furthermore, the stimulus sequence PW15 covers the pulse width of 1 bit up to 5 bits, whereas the width of 1 bit is equal to 16.667 ms, which is the time for displaying a single frame on the monitor screen. Similarly, the stimulus code PW69 covers the pulse widths of 6 to 9, as shown in Figure 2.4.
Figure 2.4: 120 bit stimulus sequences, including pulses of different width, are shown in this Figure. The blue regions of the waveforms represent the pulses, which are under investigation. The stimulus sequences are named PW15 and PW69, and they include pulse widths of 1-5 and 6-9, respectively. The green sections of the stimulus represent the regions where no pulse is applied. The widths of all of the sections of the stimulus sequences are mentioned in bits where 1 bit is equal to 16.667 ms.