https://doi.org/10.1007/s11600-021-00582-w RESEARCH ARTICLE - SPECIAL ISSUE
Post‑event field observations in the İzmir–Sığacık village
for the tsunami of the 30 October 2020 Samos (Greece) M
w6.9
earthquake
M. Ersen Aksoy1
Received: 21 February 2021 / Accepted: 30 March 2021
© Institute of Geophysics, Polish Academy of Sciences & Polish Academy of Sciences 2021
Abstract
The Mw 6.9 Samos earthquake occurred on 30 October 2020 11:51 offshore of the Samos island, west of the Kuşadası bay
in the Aegean Sea. The earthquake caused destruction in villages of Greece and Turkey. The earthquake intensity reached a maximum of VII in İzmir–Bayraklı. A tsunami followed the shock and hit many villages around Samos and the Kuşadası bay. The Sığacık village of Izmir-Turkey suffered heavily from the tsunami. A post-event field survey in Sığacık has been conducted on 31 October 2020, and measurements of flow depth, run-up and limits of inundation were collected. The tsunami inundated the entire coastal area in Sığacık for at least 200 m inland. The maximum inundation has been observed NE of Sığacık. Sea water reached a distance of 391 ± 2 m. The maximum run-up is measured as 5.3 ± 0.3 m north of Sığacık. This is the highest value for the Samos tsunami measured along the Greek and Turkish coastal areas. The high run-up value is attributed to the elongated geometry of the Sığacık bay, the shallow seafloor, the low and flat land morphology in Sığacık and to the existence of four > 70-m-long E–W trending channels. The tsunami left limited amount of clay to sand size sediments forming a layer of less than 2–3 cm in the depression areas in Sığacık. The limited amount of evidence remained from the
tsunami of this Mw 6.9 earthquake in Sığacık (a location with significant inundation and the highest run-up value) signifies
the difficulty of palaeo-tsunami surveys for the Aegean Sea region.
Keywords Earthquake · Tsunami · Damage · Inundation · Run-up · Aegean · Turkey · Greece
Introduction
Although history describes numerous destructive earth-quakes and tsunamis in the Aegean Sea, at a local scale, such disasters are rare events with a recurrence time of
dec-ades if not centuries (Ambraseys 2009; Papadopoulos et al.
2007; Makropoulos et al. 2012). When a large earthquake is
followed by a strong tsunami, the sea inundates a significant part of a coastal area and leaves various kinds of residues that mark the event, e.g. sediments, organisms and artefacts. Natural and anthropogenic processes erase rapidly such traces and leave limited pieces of evidence to reconstruct
the intensity and spatial distribution of the event. A thorough documentation of the impact of a present-day tsunami may facilitate evaluating the magnitude of past tsunamis that have been determined in historic or geological records. The recent Samos earthquake offers such occasion for future studies in the Aegean Sea.
The Mw 6.9 Samos earthquake occurred on 30 October
2020 11:51 (UTC) in the Kuşadası bay in the Aegean Sea,
north of Samos island (Fig. 1; KOERI 2020). The tremor
hit several Turkish and Greek settlements and caused considerable damage in Izmir. The Bayraklı region suf-fered heavily from the earthquake; the maximum inten-sity was observed here and reached VII (MMI, Modified Mercalli Intensity Scale). In Izmir, 9.444 (of ~ 700.000) buildings suffered damage of which 795 were assessed as
heavy (Doğan et al. 2020). One hundred and fourteen
peo-ple died in Turkey and 1030 peopeo-ple were injured (AFAD
2020). The damaging effects were lesser in Greece where
two people died and 19 were injured (Lekkas et al. 2020;
Triantafyllou et al. 2021). A tsunami alert was issued in
Communicated by Eleftheria Papadimitriou, Ph D (EDITOR-IN-CHIEF).
* M. Ersen Aksoy [email protected]
1 Mühendislik Fakültesi, Muğla Sıtkı Koçman Üniversitesi,
Greece and Turkey. The tsunami affected coastal settle-ments around the epicentral area. Inundation was observed in Samos Isl., Chios Isl., Ikaria Isl. and in several bays and
beaches from Alaçatı to Gümüldür (Fig. 1). In Turkey,
most of the damage occurred in Sığacık, where the old city was largely inundated and an old lady in a wheel-chair drowned while trying to escape from the tsunami.
This study presents post-tsunami observations from the Sığacık village, based on a field survey conducted on 31 October 2021. The dataset documents the impact of the tsunami, its distribution and the magnitude of the event in Sığacık village. The observations and measurements allow constraining the spatial distribution of the inundation and the maximum run-up in the area. Also, a short summary is given on the tsunami impact in other regions that were sur-veyed by other teams. The pieces of evidence demonstrate the variety and amount of remains for such magnitude of a
tsunami in the Aegean region and will set an example for future analysis of past tsunami events in the region.
Methodology
The surveyed area is limited to the Sığacık village. The reconnaissance aimed to document the damage, the water flow depth, extend of the tsunami inundation, and run-up in this area. The observations follow the definitions given in the Intergovernmental Oceanographic Commission Tsunami
Glossary (IOC 2019) and the International Tsunami
Sur-vey Team (ITST) Post-Tsunami SurSur-vey Field Guide (2014).
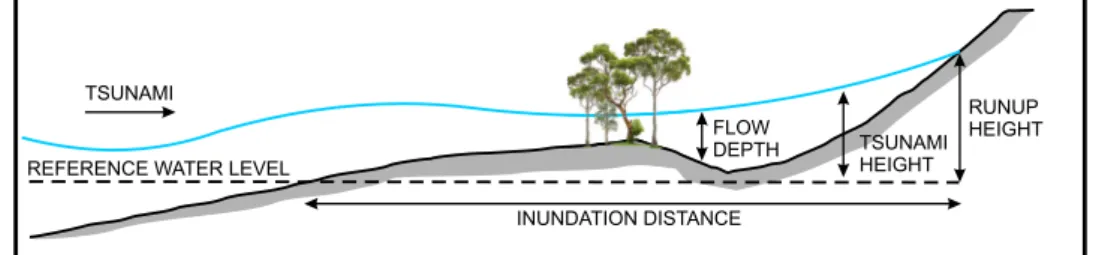
Therefore, the term “flow depth” represents the depth of
the tsunami flood over the local terrain height (Fig. 2; IOC
2019) and was measured mainly from mud traces on
build-ings and walls. The term “inundation” corresponds to the horizontal distance inland where the tsunami penetrated and
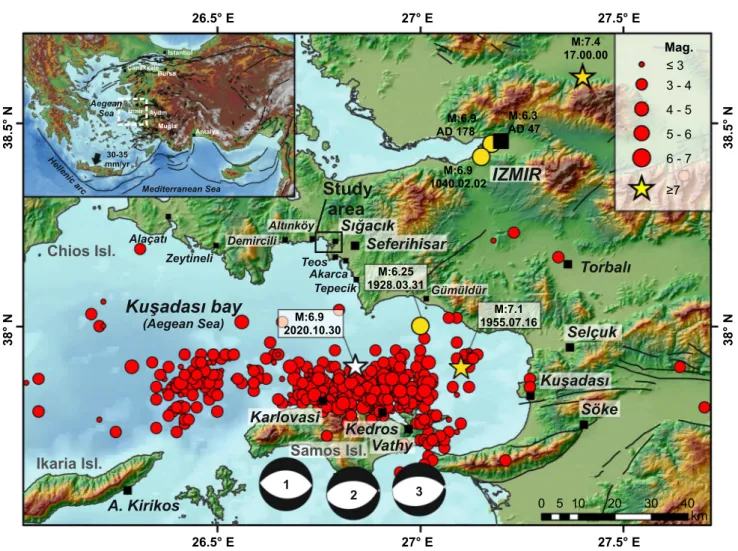
Fig. 1 Sığacık is located in the eastern part of central Aegean. The 30 October 2020 earthquake occurred north of the Samos island and triggered a tsunami effecting the coastal settlements in the Kuşadası bay. Earthquake magnitudes and epicentres are from the
European-Mediterranean Seismological Centre (EMSC), focal mechanism solu-tion 1 is from AFAD-Turkey, 2 is from EMSC, 3 is from Papadim-itrou et al. (2020). Bathymetry data are from EMODnet Bathymetry Consortium (2018)
has been measured perpendicularly to the shoreline (IOC
2019). The “run-up” is the maximum elevation reached by
the seawater and was given relative the mean sea level (IOC
2019).
The presented dataset consists of photographs and meas-urements on the damage and tsunami inundation. The spatial distribution of inundation has been mapped in the field, and direct measurements of flow depth have been collected from landmarks that contained traces of the inundation. (Obser-vations were confirmed with eyewitness interviews.) The location coordinates have been collected via a smartphone (Samsung Galaxy A51) and the Android application "GPS Essentials (v4.4.32)” in the WGS1984 position datum. Their accuracy has been verified with ArcGIS satellite imagery basemap or other high-resolution online map services (Atlas,
Zoom Earth 2021); therefore, the horizontal error range of
the locations is limited to ± 3 m. Flow depth measurements were taken with a standard tape measure (accuracy ± 1 cm). The maximum inundation and run-up locations were observed in the field. At sites where the original topogra-phy is considered undisturbed, the elevation for the run-up value has been calculated from 1:25.000 scale topographic map contours of the Turkish General Command of Mapping. The values correspond to elevation readings from the map and are heights above mean sea level.
Tectonic setting
The Samos earthquake occurred on the Aegean microplate that lies north of the Hellenic subduction zone in the eastern
Mediterranean (Fig. 1). Together with Western Anatolia, the
Aegean region experiences a lithospheric-scale extension and is seismically one of the most active regions in the world
(Le Pichon and Angelier 1979; McKenzie 1978; Le Pichon
et al. 1981). Several E–W-trending graben structures and
off-shore basins manifest the N–S extension in the region
(Boz-kurt 2001) and produce normal-slip and strike-slip
earth-quakes (Taymaz et al. 1991; Tan et al. 2014). The Aegean
microplate rotates counterclockwise and moves SSW at
a rate of 30–35 mm/yr relative to Eurasia (Papazachos 1999;
Reilinger et al. 2006). The rate of extension in the Samos
earthquake area corresponds to 7.4 mm/yr (Fig. 1; Vernant
et al. 2014).
There are different sources for tsunamis in the eastern
Mediterranean region (Ambraseys 2009; Soloviev et al.
2000; Aksoy 2020), (1) large earthquakes along the
Hel-lenic subduction zone, (2) earthquakes on faults within the Aegean Sea and (3) volcanic eruptions north of the Hellenic arc. The Samos earthquake occurred in the central-eastern Aegean Sea, on the offshore Samos fault, and produced a maximum uplift of 35 ± 5 cm on the north-western part of
the Samos island (Evelpidou et al. 2021). The uplift is also
manifested in the long term (Holocene) as emerged coastal
notches (Stiros et al. 2000). The focal mechanism solutions
of the earthquake suggest a nearly pure normal faulting with
a dip to the North (Fig. 1; AFAD, Papadimitriou et al. 2020,
EMSC 2020 and references therein).
The tsunami of the Samos earthquake affected Samos, Vathy, Karlovasi, Chios Island, Ikaria Island, Akarca (Seferihisar), Alaçatı, Gümüldür, Sığacık and other coastal
settlements in Greece and Turkey (Fig. 1). The maximum
inundations and run-up values for these localities are given
in Table 1. Triantafyllou et al. (2021) measured in Samos
the maximum inundation as 120 m (Vathy) and run-up as 3.35 m (at Karlovasi). The longest inundation was observed
in Alaçatı as 2487 m (Yalçıner et al. 2020a, b). The
maxi-mum run-up value is determined in Sığacık 5.3 ± 0.3 m (this study). The below section presents the observations for Sığacık village.
Results
The tsunami
The Sığacık bay is a NW-trending inlet that lies north of the Kuşadası bay. The bay is approximately 1200 m long and
600 m wide and shallow (Figs. 1, 9). The deepest part is
16 m. The depth decreases to < 5 m in the Teos marina at the south. The bay is bounded at its N and S by moderately steep slopes. The coastal area at the east is in general flat. The Sığacık village rests at an elevation below 2 m in most of its part. After the earthquake, eyewitnesses observed a nearly 100 m retreat of the sea. The tsunami hit violently the entire flat area and partly the southern and northern slopes, approx-imately 25 min after the mainshock. The spatial distribution
Fig. 2 Schematic illustration of the tsunami terminology (modi-fied from ITST 2014)
TSUNAMI
INUNDATION DISTANCE REFERENCE WATER LEVEL
FLOW DEPTH RUNUP HEIGHT TSUNAMI HEIGHT
and flow depth of the tsunami have been documented with
50 observation points (Figs. 1, 9).
In the south, near the Teos marina, the topography is mod-erately steep and the marina is enclosed with
50–200-cm-high walls (Fig. 3). Here, the waves overtopped the marina
walls and penetrated 30 to 40 ± 1 m inland. The maximum flow depth was limited to 46 ± 1 cm along the main road outside the marina. Here, the flow drifted the boats, debris
and garbage containers (Figs. 4, 5c). Additional photographs
of inundation traces in this area are available in Supplemen-tary file (Figs. s1–s6). Towards SE, the topography flattens, here the tsunami travelled 277 ± 2 m inland and occupied
a large area (Fig. 3). The shops along the Akkum avenue
(which runs parallel to the coast), the village clinic, and
a park were inundated (Figs. 3, 5a, b). A shop owner claimed
100 ± 10 cm flow depth in this area (Fig. s7). Little fishes have been observed in the remaining ponds of the park and
surrounding terrain (Fig. 5a, s8).
Towards the north, the tsunami affected a wider area. Flow depths of 105–55 cm were documented along the facilities around the Teos marina (Figs. s7–s10). The flood-ing drifted large tree pots, tables and other furniture of res-taurants. The entire NE-trending main road (Akkum avenue) was inundated. Smartphone recordings show several cars drifting in this area. A coffee-shop owner along the road claimed 60 ± 10 cm flow height. The inundation varied between 270 and 330 m ± 2 m in this part of the village.
Sev-eral mud traces on walls allowed mapping this area (Fig. 5d).
The tsunami hit most parts of the old town, violently. Nar-row streets amplified the waves. Here, a maximum tsunami
height of 2.31 m has been measured by Doğan et al. (2020,
2021). Strong currents dragged furniture standing outdoor
(tables, chairs, etc.) and caused one fatality. The 2–4-m-high walls of the old town served as a blockage and protected the south-east area outside of the old town; therefore, the inundation was limited to < 200 ± 2 m in this part of Sığacık. Eyewitnesses report a flow depth of 10 cm along the Street
137 (Fig. 3). The coastal section further north is highly flat,
low (h < 1 m) and unoccupied (Fig. 6). A limited amount of
structures allowed measuring the flow depth, which ranged from 88 to 120 cm. E–W-trending channels facilitated the travel of the tsunami further inland. The waves toppled
a bridge across one of these channels (Fig. 7b). The tsunami
was sufficiently strong to topple 50- to 80-cm-high walls
(Figs. 7a, 8a, d, s16).
Northwards, the bay is significantly shallower (< − 2 m) and the coastal morphology shows four E–W-trending
chan-nels (Figs. 6, 9). The land section is flat and lies at an
eleva-tion lower than 2.5 m (Fig. 9). The maximum inundation in
Sığacık has been observed in this area. Flow depth
measure-ments range from 20 to 60 cm (Fig. 6, s17–s30). The flow
followed a NE-trending stream channel and reached a
maxi-mum distance of 391 ± 2 m (Fig. 6, s31). The maximum
run-up has been observed on the northern coast of Sığacık. Here, the tsunami drifted a car for nearly 80 m towards inland
(Fig. 10). On the Pleiades satellite image (taken ~ 22 h after
the event), a distinct limit, representing the wet and dry land,
is visible (Fig. 10a). The limit is in accordance with field
observations. A zone of brushwoods, fragments of plastics, or other organic and inorganic material indicate the maxi-mum distance achieved by the tsunami waves. A white dot marks the location of the car and necessarily implies the tsunami to inundate further inland. The horizontal accu-racy of the inundation limit has been constrained with field
Table 1 Tsunami maximum
inundation and run-up values for some coastal areas in Greece and Turkey
The asteriks and letters next to the values mark the corresponding reference in the “References” column The exact locations are available in the references given below
References: (1) Doğan et al. 2020, (2) Triantafyllou et al. (2021), (3) Yalçıner et al. (2020a, b), (4) This study (see Figs. 6 and 10), (5) Sümer et al. (2020), (6) Sözbilir et al (2020)
Location Max. inundation (m) Max. run-up (m) References
Akarca (Seferihisar) 320/285* 3.82* 1, 3*
Alaçatı 2487 1.7* (flow depth) 1, 3*
Zeytineli 760, 700* 1.9 (flow depth) 1, 3*
Demircili 45 0.7 1
Altınköy 600, 650* 0.15 (flow depth) 1, 3*
Teos Ancient City 552 – 1
Sığacık 415/391 ± 2a/420b/260 1.86/5.3 ± 3a/5.08 ± 02b 1/4a/5b/6 Gümüldür 25 0.5 (flow depth) 1 Chios Isl 15–20 1.0 2 Vathy 120 2.0 2 Kedros 5 0.8–1.0 2 Karlovasi 84 1.8–3.35 2 Ikaria Isl 2.0 0.7–1.0 2
observation and the satellite image and is less than 2 m. The elevation of this points has been calculated from the eleva-tion contours of the 1/25.000 scale topographic map of the area. The maximum run-up value for this location is deter-mined as 5.3 ± 0.3 m.
The impact of the tsunami in other Turkish coastal set-tlements has been surveyed by other teams (Doğan et al.
2020, 2021; Sümer et al. 2020; Sözbilir et al. 2020; Yalçıner
et al. 2020a; b). In Alaçatı, NW of the Kuşadası bay, Doğan
et al. (2020) report that the flow depth near the port exceeded
1.7 m and that the inundation reached 2490 m inland using the Alaçatı Azmak stream. The maximum flow depth and inundation at Zeytineli were measured as 1.9 m and 760 m,
respectively (Doğan et al. 2020). Eyewitnesses in Demircili
stated that the sea receded 20 min after the earthquake and
flow back in 3–4 min (Doğan et al. 2020; Yalçıner et al.
2020a, b). This timing is 1–2 min earlier as observed in Sığacık. Further south in Akarca, the maximum inundation
was measured as 285 m and the maximum run-up as 3.8 m
(Doğan et al. 2020, 2021). The tsunami impact decreased
southwards, where at Gümüldür the waves inundated only a 25-m section of the beach.
In Samos, along the northern shore, Triantafyllou et al.
(2021) measured run-up values of 1 m at several sites, except
at Vathy and Karlovasi where run-up reached 2 m and 1.8 m, respectively. The tsunami also affected the Ikaria and Chios-islands, where run-up was measured as 1 m at both
Trian-tafyllou et al. (2021).
Damage caused by the tsunami
The economic income in Sığacık village derives mainly from tourism and the marina; therefore, the coastal area is domi-nantly occupied with restaurants, coffee shops and lodgings, particularly in the old town. The old town is surrounded by 2–4-m-high thick walls and has two entrances facing the
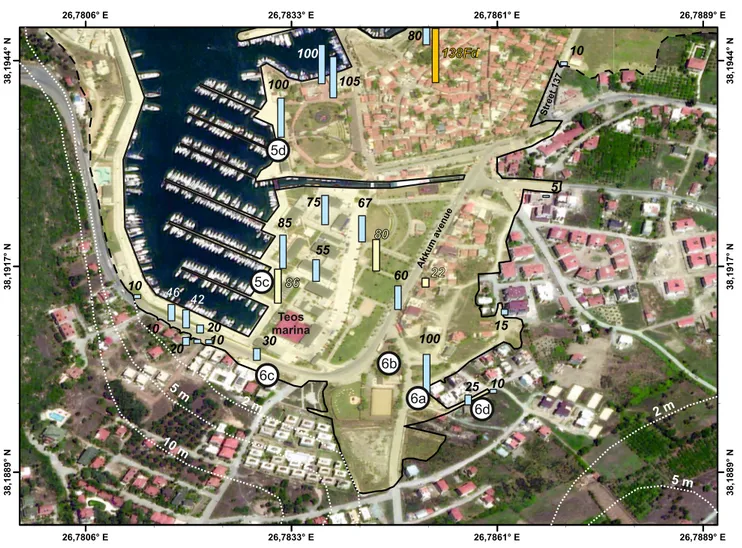
8800 113388FFdd 8866 8800 8866 2222 5 10 20 15 85 10 4422 4466 10 20 30 60 67 75 80 10 55 25 10 100 100 105 100 Teos 6b 6d 6a 6c 5d 5c
Fig. 3 The columns represent the flow depth measurements.
Yel-low, orange, grey and blue columns are from Yalçıner et al. (2020a,
b), Doğan et al. (2020) and this study, respectively. The yellow shad-ing corresponds to the inundated area. White circles indicate figure
locations. White dotted lines are elevation contours. The inundation is controlled by the high topography at the south; therefore, the west of the marina was inundated for 30–40 m, while in the east the sea water reached nearly a distances of 300 ± 1 m
Sığacık bay. The water entered from these entrances and moved along the narrow streets of the town. Strong cur-rents dragged furniture standing outdoor (tables and chairs) into the sea. In Sığacık, seven people were injured and two persons died (one from hearth attack, the other from drown-ing). Many restaurants in the pier suffered heavily from the event. The 80–100-cm-high waves carried away their tables, chairs and other wares. Several cars have been floated ashore. In the marina, eyewitnesses reported 2–2.5 m sea
level rise (Tuncel 2020). Strong water movements ripped
apart four pontoon docks (Fig. 4). The sea oscillated for
4–5 h with an amplitude of 0.70 m and damaged many boats
(Yalçıner et al. 2020a, b). The buildings to the east of the
old town suffered less from the tsunami. However, towards the north, three N–S-trending garden walls (50–60-cm-high,
20–30-cm-thick) received directly the tsunami and collapsed (Figs. 7, 8).
In total, 45 houses and 195 shops, restaurants etc., received damage. Fifty-four cars have been dragged by the tsunami and were damaged. Seventeen boats sunk, while 34
run aground (Cumhuriyet 2020). The Turkish Ministry of
Environment and Urbanisation estimated the total economic loss in Sığacık as 1.5 million €.
The damage of the tsunami in other regions is reported
in other studies (Doğan et al. 2020). In Zeytinli, summer
houses along the shore were severely damaged. Boats were damaged at the fishery port in Demircili. The coastal section of Akarca experienced significant damage, where 20 boats sank and a boat drifted for 90 m towards inland. The impact of the tsunami decreased southward along the coast.
NN
N
N
NN
1 1 2 2 3 3 4 5 6 4 5N
N
N
N
NN
1 1 2 2 3 3 4 5 6 4 5 a b d ca
b
d
c
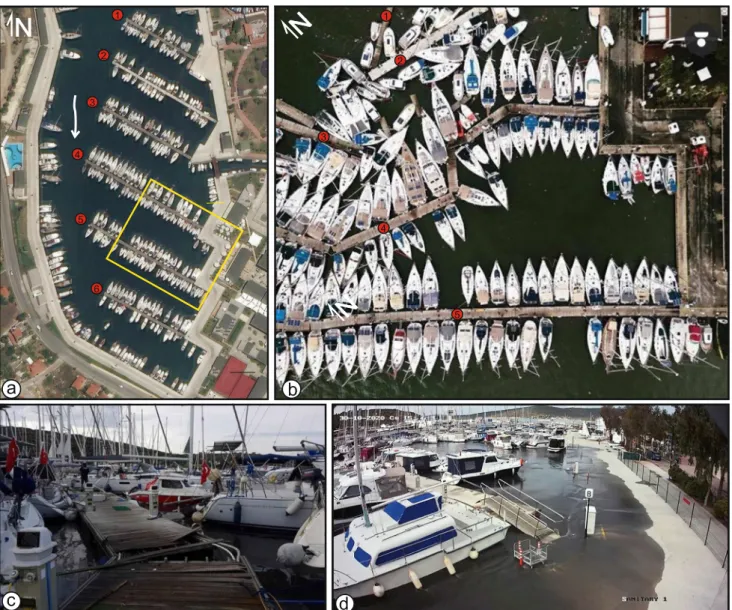
Fig. 4 The tsunami hit Teos Marina violently. The four pontoon
docks did not resist the strong water motion and broke apart (a–c). d The security camera footage show the first stages of the inundation.
The time (upper left) is 15:16:39 (+ 3 UTC) and suggests that the tsu-nami waves arrived to Sığacık 25 min after the earthquake. Images from: a BING maps (2021), b, c Yeniçağ (2020), d Tuncel (2020)
a b
c
25 cm
d
Fig. 5 a Ponds in a park South of Sığacık, 100 cm flow depth at a nearby store, b the village clinic is located south of the marina and was inundated. c The flow drifted wares such as garbage
contain-ers, photograph from the south of the marina. d Mud traces on walls allowed determining the distribution and size of the inundation in the southern parts of Sığacık villages. See Fig. 9 for locations
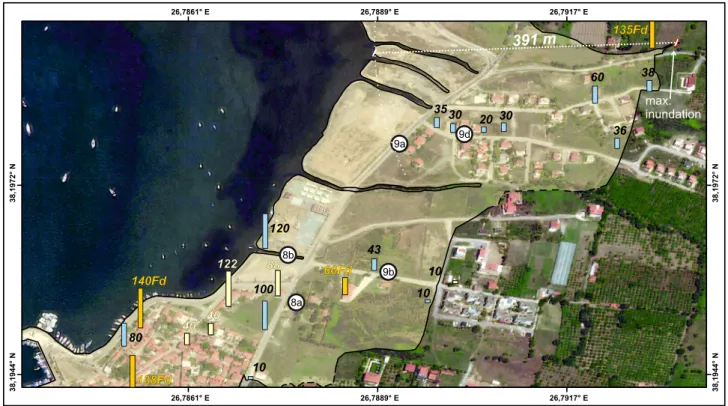
26,7917° E 26,7917° E 26,7889° E 26,7889° E 26,7861° E 26,7861° E 38,1972° N 38,1972° N 38,1944° N 38,1944° N 391 m 8a 9a 8b 9b 9d x max. 114400FFdd 113355FFdd 113388FFdd 6600FFdd 112222 4400 4400 8888 110 38 60 36 30 20 30 35 43 10 80 10 120 100
Fig. 6 The columns represent the flow depth measurements. The
maximum inundation has been observed in the north-eastern part of Sığacık. Yellow, orange, grey and blue columns are from Yalçıner et al. (2020a, b), Doğan et al. (2020) and this study, respectively. The
yellow shading corresponds to the inundated area. The white dot-ted line represents the inundation measurement perpendicular to the coast. White circles indicate figure locations
a b
Fig. 7 a A 80-cm-high N–S-oriented wall facing the shore did not resist the tsunami destroyed walls. b A bridge on the E–W was drifted and toppled by the waves
30 cm c 43 cm b a d Fig. 8 Approximately N–S-oriented walls collapsed when hit by the tsunami with a flow depth of 30–40 cm at the northern part of Sığacık
Discussion
The data I present here consist of 50 flow depth measure-ments and additional observations on the impact and dis-tribution of the Samos tsunami in Sığacık village (see sup-plementary data). Together with other studies, a total of 61 locations provide a basis for evaluating the distribution of the inundation, the flow depth, the maximum run-up and the damage for the Sığacık region. The inundation occurred mainly across the flat land in Sığacık, spreading into an area
that is approximately 1200 m long (N–S) and 300 m wide (E–W). The northern and southern coasts were significantly less inundated due to the steep topography that limits the bay area. I measured the maximum inundation as 391 ± 2 m NE of Sığacık. The measurement corresponds to the
short-est distance to the shore from the given location (Figs. 6,
9, s31). Sümer et al. (2020) proposed a locality further east
of this point; 419 m inland. Doğan et al. (2020) suggest
a comparable value of 415 m; however, the location is given slightly westwards relative to the location suggested in this
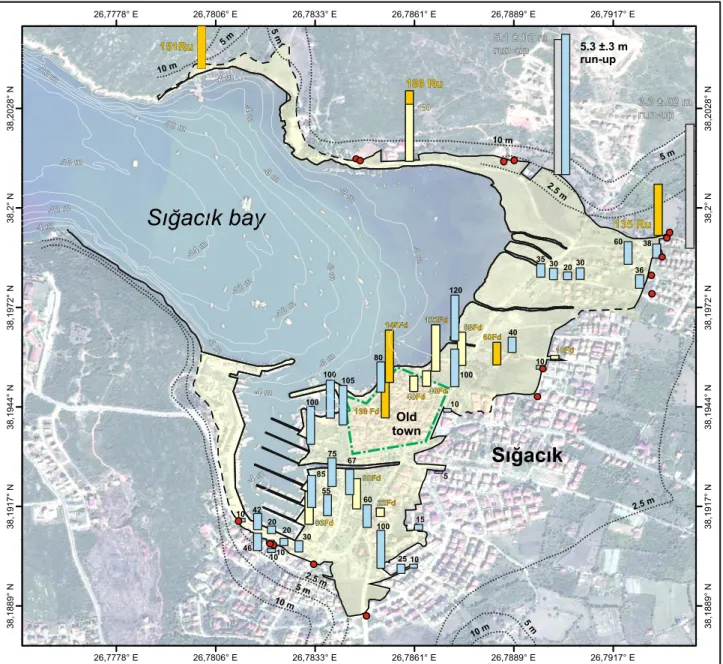
2.5 m 5 m 2.5 m 5 m 2.5 m 10 m 5 m 5 m 10 m 10 m 5 m 10 m 26,7917° E 26,7917° E 26,7889° E 26,7889° E 26,7861° E 26,7861° E 26,7833° E 26,7833° E 26,7806° E 26,7806° E 26,7778° E 26,7778° E 38,2028° N 38,2028° N 38,2° N 38,2° N 38,1972° N 38,1972° N 38,1944° N 38,1944° N 38,1917° N 38,1917° N 38,1889° N 38,1889° N
Sığacık bay
Sığacık
Old town 8800 dd 6600 dd 4400 dd 4400 dd 1100 dd 112222 dd 8888 dd 114400 dd 8866 dd 2222 dd 113388 dd 113355 115511 118866 4400 112222 8888 1100 4400 8866 8800 2222 115500 5 10 20 85 38 60 36 30 20 30 35 40 10 10 42 46 10 20 30 60 80 55 25 10 15 100 100 105 120 100 100 10 5.3 ±.3 m 55..11 ±±..0022 mm nn--33..33 ±±..0022 mm nn----11mm --22 mm --66 mm --1100 mm --1100mm --88mm --66mm --66mm --44 mm --1100 mm --1100mm --1122mm --1144mm --1166 mm --44 mm --44 mm --44 mm --11 mmFig. 9 The Samos earthquake caused a tsunami in the Aegean sea.
Sığacık village suffered heavily from the tsunami. The columns represent the flow depth measurements of this study and other stud-ies. Yellow, orange, grey and blue columns are from Yalçıner et al.
(2020a, b), Doğan et al. (2020), Sümer et al. (2020) and this study,
respectively. Red dots are observation points where no inundation was observed. The yellow shading corresponds to the inundated area. Dotted lines are topographic contours from 1/25.000 scaled topographic maps. The bathymetry is from Navionics Chart Viewer-Sığacık (2021) (solid light grey lines)
study (Fig. 6). Sözbilir et al. (2020) suggest the inundation as 260 m. Despite the slight differences among the stud-ies, all agree that the maximum inundation occurred NE of Sığacık. The difference may derive because not only dif-ferent maximum inundation points are suggested, but also the measurement to the shoreline may have been performed differently. The 391-m distance measured in this study cor-responds to the shortest radius of a curve of which tangent
coincides with the shoreline (see Fig. 6).
Field mapping and available topographic maps allowed determining the maximum run-up at the north of the study
area (Figs. 9, 10). The beetle car shown in Fig. 10 rests on
a gently inclined slope. The slope angle has been calculated as 2.8° from a 1:25.000 scaled topographic map. To carry the beetle up to this location, the tsunami wave requires a minimum flow height and energy, which implies an inun-dation further inland. The car and the inuninun-dation limit are
visible in the Pléiades-1A/B satellite image taken on 31 October 2020 (09:16 UTC) after the tsunami (Copernicus
EMS—Mapping 2021). The elevation at this limit point has
been calculated by georeferencing and overlaying the post-event satellite image and the 1:25.000 scale topographic con-tours. The horizontal accuracy of the georeferenced layers is estimated as ± 5 m, his discrepancy corresponds to a vertical accuracy of ± 30 cm on such gently inclined slope (2.8°). Thus, I calculate a maximum run-up of 5.3 ± 0.3 m. The
value is comparable with Sümer et al. (2020) who measured
a 5.08 ± 0.2 run-up with a RTK-GPS at the same locality
(Table 1). Doğan et al. (2020) measured a run-up of 1.86 m
further West of this locality.
In brief, all studies document that the damage occurred mainly at the South around the old town, but show that the
tsunami was stronger in the north (Doğan et al. 2020;
Söz-bilir et al. 2020; Yalçıner et al. 2020a, b; Doğan et al. 2020,
100 m 1100 mm 22..55mm 55 mm
m
maaxx rruunn--uupp
55..33 ±±00..33 m
m
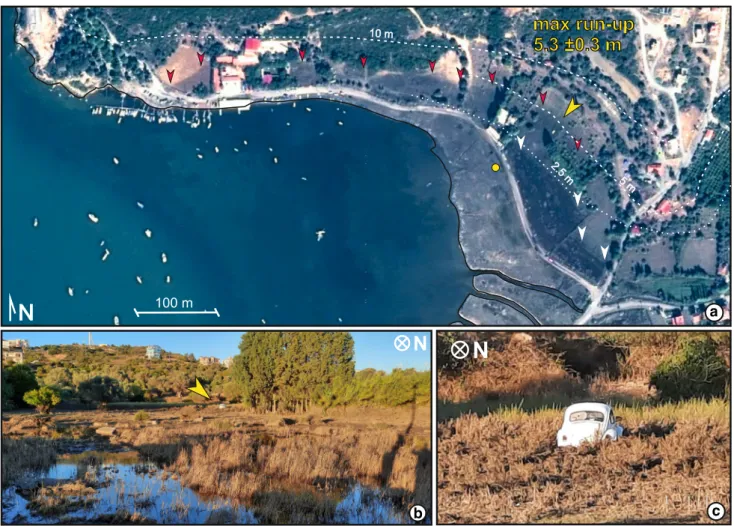
a b cFig. 10 a The Pléiades-1A/B satellite image taken on 31
Octo-ber 2021 (09:16 UTC) shows the NE coastal area of Sığacık bay. Dashed white lines are georeferenced contours from 1:25.000 scale topographic maps (horizontal accuracy < 3 m). The red and yellow arrowheads mark a wet/dry land limit and represent the maximum inundation. The limit is in agreement with field observations. The
yellow arrowhead points towards a white dot which is the beetle car shown in b, c. The original location of the car has been determined with eyewitness reports (yellow dot). The car was drifted nearly 80 m and indicates that the tsunami run further inland. The inundation limit suggests a run-up of 5.3 ± 0.3 m
2021). Morphological and anthropogenic elements have played a role in this result. Morphologically the Sığacık bay has a NW–SE-trending elongated geometry bounded by moderately steep slopes. The entrance of the bay is
nar-row, and the bay is shallow (Figs. 1, 9). Depths are less than
16 m. Towards the eastern shoreline, the northern section gets significantly shallower, which will cause a growth in the tsunami amplitude and increase its velocity (Dias and
Dutykh 2007). In addition, this part of the shore consists of
four, nearly E–W-trending channels that continue for ~ 150 m inland. The channels have likely facilitated the inundation to reach larger distances. The flat topography of the area must have contributed to the conditions favouring the flooding of the sea. Besides, the coastal section is less occupied in the north, compared to the south. The breakers, the pier and the walls of the old town are important structures that reduced the impact of the tsunami in this area.
The tsunami carried debris and marine sediments across the entire inundated area. Sand, silt and clay sediments deposited in some parts of the streets, base floor of
build-ings, parks and wastelands (Figs. 5, 8, 10, and figures in
supplement). The thickness of the sediments was limited to a few millimetres to centimetres. Marine organisms and shells have also been drifted and deposited. The debris and all kind of deposits in the urban area were cleaned imme-diately after the tsunami, leaving very limited evidence for the tsunami. Sediments will be preserved only in wastelands. Similar conditions have been described for other areas in Turkey and Greece for the 30 October 2020 Samos
earth-quake (Mw: 6.9; Triantafyllou et al. 2021; Lekkas et al. 2020;
Doğan et al. 2020). The depositions of limited amount of
sediments have implications for palaeo-tsunami studies along the Aegean Sea coasts. The latter implies that mac-roscopic approaches, such as trenching, are likely to miss several events of comparable magnitude to the Samos earth-quake. Palaeo-tsunami investigations need to be accompa-nied by microscopic-scale analysis and search for microscale fragments of marine organism and sediments.
Conclusion
The 30 October 2020 Samos earthquake (Mw 6.9)
gen-erated a tsunami that hit several Greek and Turkish vil-lages around Samos and the Kuşadası bay. The impact in Sığacık village has been severe. According to eyewit-nesses, the sea retreated for ~ 100 m following the tremor. The tsunami arrived 25 min (at 15:16:39; + 3 UTC) after the mainshock and inundated the entire coastal area. The marina, the old town, restaurants and shops around experi-enced considerable damage. The maximum tsunami height reached 2.31 m in the old town. The walls of the town hin-dered the waves penetrating further into the modern part
of the village. Nevertheless, the inundation reached a dis-tance of 277 ± 2 m using the low topography at the south. Towards north, the flow depths were lower, but the tsu-nami flooded a larger area. The maximum flow depth has been measured as 60 cm. Here the inundation reached its maximum distance of 391 ± 2 m. The run-up is measured as 5.3 ± 0.3 m at a nearby location. The higher inundation and run-up values for this locality have been attributed to the significantly shallower seafloor at the north, the low, flat land morphology, the existence of four > 70-m-long E–W-trending channels and to the fact that the area is less occupied with constructions.
The tsunami carried limited amount of sediments into the low land in Sığacık. Clay to sand size sediments and organic material were deposited in depressions forming a layer of less than 2–3 cm. This sets an example that tsunamis with comparable magnitudes in the Aegean leave very little evi-dence and are difficult to be located in the geological record. Palaeo-tsunami investigations need to integrate microscopic-scale analysis in order to detect traces of tsunamis deriving from earthquakes with magnitude comparable to the Samos earthquake.
Supplementary Information The online version contains
supplemen-tary material available at https:// doi. org/ 10. 1007/ s11600- 021- 00582-w.
Declarations
Funding No funding to declare.
Conflicts of interest The author has no conflicts of interest to declare that are relevant to the content of this article.
Availability of data and material (data transparency) Additional obser-vations and location coordinates of the figures are provided with two supplementary files.
Ethics approval Not required for this study.
References
AFAD, Afet Acil Durum Yönetim Başkanlığı—Disaster and Emer-gency Managment Presidency Turkey (2020) 30 Ekim 2020 Sisam Adası (İzmir Seferihisar Açıkları) Mw 6.6 Depremi Raporu, online report, (Ankara) https:// deprem. afad. gov. tr/ depre mdoku
manla ri/ 2065. Accessed 30 Jan 2020
Aksoy ME (2020) Submarine earthquakes in South–West Anatolia until the 18th century and their probable seismic sources. Turk J Marit Mar Sci 6:181–190
Ambraseys NN (2009) Earthquakes in the Mediterranean and Middle East: a multidisciplinary study of seismicity up to 1900. Cam-bridge University Press, CamCam-bridge
Atlas Harita; Harita Genel Müdürlüğü; PiriReis Bilişim Teknolojileri (2021) Sığacık ve çevresi. https:// atlas. harita. gov. tr/# 14. 38/ 38.
Bing Maps—Sığacık İzmir, directions, trip planning, traffic cameras & more (2021). https:// www. bing. com/ maps/. Accessed 9 Feb 2021 Bozkurt E (2001) Neotectonics of Turkey—a synthesis. Geodin Acta
14:3–30. https:// doi. org/ 10. 1080/ 09853 111. 2001. 11432 432
Copernicus EMS—mapping (2021) [EMSR476] Sigacik: grading prod-uct, version 1, release 1, RTP Map #01. https:// emerg ency. coper nicus. eu/ mappi ng/ ems- produ ct- compo nent/ EMSR4 76_ AOI03_
GRA_ PRODU CT_ r1_ RTP01/1. Accessed 10 Feb 2021
Cumhuriyet, Deprem ve tsunaminin vurduğu Seferihisar’da bilanço belli oldu (2020). https:// www. cumhu riyet. com. tr/ haber/ deprem-
ve- tsuna minin- vurdu gu- sefer ihisa rda- bilan co- belli- oldu- 17881 94.
Accessed 20 Feb 2021
Dias F, Dutykh D (2007) Extreme man-made and natural hazards in dynamics of structures. In: Ibrahimbegovic A, Kozar I (eds) Dynamics of tsunami waves. Springer, Dordrecht
Doğan GG, Yalçıner AC, Yüksel Y, Polat O, Güler I, Ulutaş E, Şahin C, Özbahacı B, Necmioğlu Ö, Kanoğlu U, Kalligeris N, Charalampakis M, Skanavis V, Melis N, Synolakis C (2020) Tsunami effect and Performace of Port Structures. In: Çetin K, Mylonakis G, Sextos A, Stewart J, Akbaş B, Akgün M, Akkar S, Aksel M, Al-Suhaily A, Altindal A, Altun S, Altunel E, Askan A, Ay B, Aydin S, Baba A, Eseller-Bayat E, Binici B, Çakır E (2020) Seismological and Engineering Effects of the M 7.0 Samos Island (Aegean Sea) Earthquake. Report No: GEER-069.
https:// doi. org/ 10. 18118/ G6H088
Dogan GG., Yalciner AC, Yuksel Y, Ulutas E, Polat O, Guler I, Sahin C, Tarih A, Kanoglu U (2021) The 30 October 2020 Aegean Sea Tsunami: Post-Event Field Survey Along Turkish Coast. Pure Appl Geophys. https:// doi. org/ 10. 1007/ s00024- 021- 02693-3
EMODnet Digital Bathymetry (2018) EMODnet bathymetry consor-tium. https:// doi. org/ 10. 12770/ 18ff0 d48- b203- 4a65- 94a9- 5fd8b 0ec35 f6
EMSC—European-Mediterranean Seismological Centre (2020) M7.0 DODECANESE ISLANDS, GREECE on Oct 30th 2020 at 11:51 UTC. https:// www. emsc- csem. org/ Earth quake/ 263/ M7-0- DODEC ANESE- ISLAN DS- GREECE- on- Octob er- 30th-
2020- at- 11- 51- UTC. Accessed 23 Mar 2021
Evelpidou N, Karkani A, Kampolis I (2021) Relative sea level changes and morphotectonic implications triggered by the Samos earthquake of 30th October 2020. J Mar Sci Eng-MDPI 9:40. https:// doi. org/ 10. 3390/ jmse9 010040
Intergovernmental Oceanographic Commission. Fourth Edition. Tsu-nami Glossary, (2019), Paris, UNESCO. IOC Technical Series, 85. (English, French, Spanish, Arabic, Chinese) (IOC/2008/ TS/85 rev.4)
International Tsunami Survey Team (ITST), (2014), Post-tsunami survey field guide. 2nd Edition. IOC Manuals and Guides No. 37, Paris: UNESCO (English)
KOERI Boğaziçi University—Kandilli Observatory and Earthquake Research Institute (2020) 30 Ekim 2020 Ege Denizi Depremi Basın Bülteni, Press Realase in Institute, http:// www. koeri.
boun. edu. tr/ sismo/2/ tr/ 2020/ 10/. Accessed 10 Jan 2021
Lekkas E, Mavroulis S, Gogou M, Papadopoulos G, Triantafyllou I, Katsetsiadou K-N, Kranis H, Skourtsos E, Carydis P, Voulgaris N, Papadimitriou P, Kapetanidis V, Karakonstantis A, Spin-gos I, Kouskouna V, Kassaras I, Kaviris G, Pavlou K, Sakkas V, Karveleas N (2020) The October 30, 2020 Mw 6.9 Samos (Greece) earthquake. Newsl Environ Disaster Crises Manag Strateg Natl Kapodistrian Univ Athens, Athens. https:// doi. org/ 10. 13140/ RG.2. 2. 13630. 10561
Makropoulos K, Kaviris G, Kouskouna V (2012) An updated and extended earthquake catalogue for Greece and adjacent areas since 1900. Nat Hazards Earth Syst Sci 12:1425–1430. https:// doi. org/ 10. 5194/ nhess- 12- 1425- 2012
McKenzie DP (1978) Active tectonics of the Alpine-Himalayan belt: the Aegean Sea and surrounding regions. Geophys J R Astr Soc
55:217–254. https:// doi. org/ 10. 1111/j. 1365- 246X. 1978. tb047 59.x
Navionics Chart Viewer—Sığacık İzmir (2021). https:// webapp. navio nics. com/? lang= en# boati ng/ mapOp tions@ 13& key= yqchF
odmbD. Accessed 9 Feb 2021
Papadimitriou P, Kapetanidis V, Karakonstantis A, Spingos I, Kassaras I, Sakkas V, Kouskouna V, Karatzetzou A, Pavlou K, Kaviris G, Voulgaris N (2020) First results on the Mw=6.9 Samos earthquake
of 30 October 2020. Bull Geol Soc Greece 56:251–279. https:// doi. org/ 10. 12681/ bgsg. 25359
Papadopoulos GA, Daskalaki E, Fokaefs A, Giraleas N (2007) Tsunami hazard in the Eastern Mediterranean: strong earthquakes and tsu-namis in the east Hellenic Arc and Trench system. Nat Hazards Earth Syst Sci. https:// doi. org/ 10. 1142/ S1793 43111 00008 56
Papazachos BC, Papaioannou CA, Papazachos CB, Savvaidis AS (1999) Rupture zones in the Aegean region. Tectonophysics 308:205–221. https:// doi. org/ 10. 1016/ S0040- 1951(99) 00073-6
Le Pichon X, Angelier J (1979) The hellenic arc and trench system: a key to the neotectonic evolution of the eastern mediterranean area. Tectonophysics 60:1–42. https:// doi. org/ 10. 1016/ 0040- 1951(79) 90131-8
Le Pichon X, Angelier J, Osmaston MF, Stegena L, Vine FJ, Smith AG (1981) The Aegean Sea. Philos Trans R Soc Lond Ser A Math Phys Sci 300:357–372. https:// doi. org/ 10. 1098/ rsta. 1981. 0069
Reilinger RE, McClusky S, Vernant P, Lawrence S, Ergintav S, Cak-mak R, Ozener H, Kadirov F, Guliev I, Stepanyan R, Nadariya M, Hahubia G, Mahmoud S, Sakr K, ArRajehi A, Paradissis D, Al-Aydrus A, Prilepin M, Guseva T, Evren E, Dmitrotsa A, Filikov SV, Gomez F, Al-Ghazzi R, Karam G (2006) GPS constraints on continental deformation in the Africa-Arabia-Eurasia continental collision zone and implications for the dynamics of plate inter-actions. J Geophys Res. https:// doi. org/ 10. 1029/ 2005J B0040 51
Soloviev SL, Solovieva ON, Go CN, Kim KS, Shchetnikov NA (2000) Tsunamis in the Mediterranean Sea 2000 B.C.–2000 A.D. vol 13. Advances in Natural and Technological Hazards Research. Springer, Netherlands. https:// doi. org/ 10. 1007/ 978- 94- 015- 9510-0
Stiros SC, Laborel J, Laborel-Deguen F, Papageorgiou S, Evin J, Piraz-zoli PA (2000) Seismic coastal uplift in a region of subsidence: holocene raised shorelines of Samos Island Aegean Sea, Greece. Mar Geol 170:41–58. https:// doi. org/ 10. 1016/ S0025- 3227(00) 00064-5
Sözbilir H, Softa M, Eski S, Tepe Ç, Akgün M, Pamukçu A, Çırmık A, Utku M, Özdağ ÖC, Özden G, Özçelik Ö, Evlek DA, Çakır R, Baba A, Uzelli T, Tatar O (2020) 30 Ekim 2020 Sisam (Samos) Depremi (6.9) Evaluation Report, Dokuz Eylül University, p 111 (in Turkish). http:// daum. deu. edu. tr/ wp- conte nt/ uploa ds/ 2020/ 11/
Samos- Deprem- Raporu. pdf. Accessed 20 Feb 2021
Sümer Ö, Drahor MG, Ongar A, Eski S, Yağlıdere MS, Öztürk C, Kaya BO, Özdoğan L, Berge MA (2020) 30 Ekim 2020 Ege Denizi (Sisam—İzmir) Depremi (Mw: 6.9) Tsunamisinin Saha
Gözlem-leri ve Sayısal ParametreGözlem-leri. In: ATAG 2020 Special Meeting— Active Tectonic Research Group, online, 24.12.2020 2020. Istan-bul Technical University. http:// atag23. itu. edu. tr/
Tan O, Papadimitriou EE, Pabucçu Z, Karakostas V, Yörük A, Lep-tokaropoulos K (2014) A detailed analysis of microseismicity in Samos and Kusadasi (Eastern Aegean Sea) areas. Acta Geophys 62:1283–1309. https:// doi. org/ 10. 2478/ s11600- 013- 0194-1
Taymaz T, Jackson J, McKenzie D (1991) Active tectonics of the north and central Aegean Sea. Geophys J Int 106:433–490. https:// doi. org/ 10. 1111/j. 1365- 246X. 1991. tb039 06.x
Triantafyllou I, Gogou M, Mavroulis S, Lekkas E, Papadopoulos GA, Thravalos M (2021) The Tsunami caused by the 30 October 2020 Samos (Aegean Sea) Mw7.0 Earthquake: hydrodynamic features, source properties and impact assessment from post-event field survey and video records. J Mar Sci Eng 9:68. https:// doi. org/ 10. 3390/ jmse9 010068
Tuncel, Tanıl (2020) Sığacık’tan Tsunami geçti! (Yacht Türkiye),
https:// www. yacht turki ye. com/ yazar lar/ tanil- tuncel/ sigac iktan-
tsuna mi- gecti. html Accesed 10 Feb 2021
Vernant P, Reilinger R, McClusky S (2014) Geodetic evidence for low coupling on the Hellenic subduction plate interface. Earth Planet Sci Lett 385:122–129. https:// doi. org/ 10. 1016/j. epsl. 2013. 10. 018
Yalçıner AC, Doğan GG, Ulutaş E, Polat O, Tarih A, Yapa ER, Yavuz E (2020a) The 30 October 2020 (11:51 UTC) Izmir-Samos earth-quake and tsunami: post-tsunami field survey preliminary results. METU field report
Yalçıner AC, Doğan GG, Yüksel Y, Ulutaş E, Polat O, Güler I, Şahin C, Kanoğlu U, Tarih A, Yapar ER, Yavuz E, Süzen L, Enginar DT, Bingöl C, Gözlet S, Güler HG, Yalçıner B, Özacar AA (2020b)
Chapter 4—post-tsunami field observations, In: Azak S, (Ed.,) The October 30, 2020 İzmir–Seferihisar offshore (Samos) earth-quake (Mw=6.6) Reconnaissance Observations and Findings,
Vol-ume METU/EERC 2020–03: Ankara, METU, p 15–21
Yeniçağ (2020) Tsunami Seferihisar’ı aldı götürdü, Tsunami sonrası Sığacık Marina bu hale geldi! In Yeni Çağ, 10/31/2020. https:// www. yenic aggaz etesi. com. tr/ tsuna mi- sonra si- sigac ik- marina- bu-
hale- geldi- deprem- sefer ihisa ri- yikti- gecti- 31203 0h. htm, Accessed
20 Feb 2021
Zoom Earth (2021) LIVE weather satellite, radar, storm maps. https://
zoom. earth/# view= 38. 19639 5,26. 78739 4,15z. Accessed 1 Feb