Optimal Operation of a Smart Multi-Energy
Neighborhood
Mustafa Ata1, Ayşe Kübra Erenoğlu2, İbrahim Şengör3, Ozan Erdinç4
Dept. of Electrical Engineering Yildiz Technical University,
Istanbul, Turkey 1[email protected] {2erenayse,3isengor, 4oerdinc}@yildiz.edu.tr,
Akın Taşcıkaraoğlu
Dept. of Electrical and Electronics Engineering Mugla Sitki Kocman University
Mugla, Turkey [email protected]
João P. S. Catalão Faculty of Engineering of the University of Porto (FEUP) and
INESC TEC, Porto 4200-465, Portugal
Abstract—Together with the increasing population and prosperity
levels of the growing countries, the economic and technological developments and modernized lifestyles of the end users have increased their electrical, heating and cooling energy demands extraordinarily. These services are generally provided to the end users independently, which leads to considerable reductions in the system efficiencies. For the purpose of providing a decrease in the demands of the end users and to transfer the energy carriers to the end users in an integrated and more efficient way, the concept of multi energy systems (MESs) has emerged. MESs could be developed at a district level, a city level and lastly at a country level. In this paper, a smart neighborhood MES model is proposed with the aim of achieving cost optimization by mixed integer linear programming (MILP) based formulation considering a time-of-use (TOU) tariff. In order to testify the effectiveness of the proposed optimization algorithm, two different case studies are conducted by taking into account flexible energy production capability of different energy carriers.
Index Terms—Multi energy system, mixed-integer linear
programming, optimization, system modelling, smart neighborhood.
NOMENCLATURE
The sets and indices, parameters, and variables used throughout the study are stated below.
TABLE I. SETS AND INDICES Set of CHP units.
Set of HP units. Set of time periods.
TABLE II. PARAMETERS Coefficient-of-performance of ℎ HP unit. Energy efficiency ratio of ℎ HP unit. Sufficiently big number.
, , , Maximum electricity supply level of ℎ CHP unit (kW). , , , Maximum heat supply level of ℎ CHP unit (kW).
, Cooling demand of end-user in period (kW). , Electricity demand of end-user in period (kW). , Heating demand of end-user in period (kW). , , , Maximum cooling supply level of ℎ HP unit (kW). , , , Maximum heat supply level of ℎ HP unit (kW).
Wholesale electricity price (TL/kWh).
Marginal cost of the natural gas supplied from gas source (TL/kWh).
Energy conversion efficiency from gas to electricity at ℎ CHP unit.
Energy conversion efficiency from gas to heat at ℎ CHP unit.
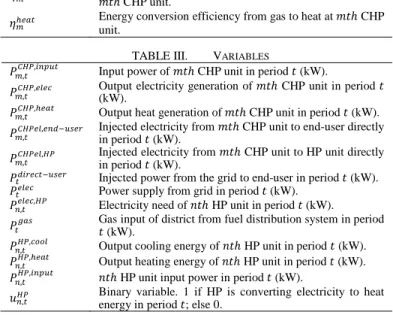
TABLE III. VARIABLES
, , Input power of ℎ CHP unit in period (kW). , , Output electricity generation of (kW). ℎ CHP unit in period , , Output heat generation of ℎ CHP unit in period (kW). , , Injected electricity from in period (kW). ℎ CHP unit to end-user directly , , Injected electricity from in period (kW). ℎ CHP unit to HP unit directly
Injected power from the grid to end-user in period (kW). Power supply from grid in period (kW).
, , Electricity need of ℎ HP unit in period (kW).
Gas input of district from fuel distribution system in period (kW).
, , Output cooling energy of ℎ HP unit in period (kW). , , Output heating energy of ℎ HP unit in period (kW). , , ℎ HP unit input power in period (kW).
, Binary variable. 1 if HP is converting electricity to heat energy in period ; else 0.
I. INTRODUCTION
A. Motivation and Background
The operation, planning and regulation of energy systems have been conventionally designed independently from each other and this structure has continued for a long time. Fossil fuel-based sources have been widely used to operate this structure, which caused to accelerate greenhouse gas emission (GHG) into the climate at an unprecedented rate which led to grow concerns about environmental issues. Therefore, there has been a strong trend towards transferring energy in an efficient and economic fashion while addressing the environmental concerns in the recent years. This modern structure, which is defined as the energy trilemma, has become the energy quadrilemma considering social impacts [1]-[3].
It is clearly seen that interactions of power grid, gas networks, heat, and transportation system have been always taken into consideration under various concepts, such as combined cooling, heat and power framework, cogeneration and trigeneration systems, heat pumps, air conditioning systems and electric vehicles.
Figure 1. Proposed smart multi-energy neighborhood. Moreover, it is expected that these types of integrated
structures will be increased over the time. Many researchers have comprehensively and systematically investigated the concept of multi-energy system (MES) from different points of view in order to achieve integrated and efficient energy system architecture [4]-[6]. There are great deals of advantage that should be considered thoroughly when paved the way for high penetration of MES in the energy network.
In fact, it has significant impacts on energy markets, i.e., the electricity prices can be stabilized thanks to the combined heat and cooling systems when they are active participants of energy market. Last but not least, this system can play a critical role in increasing operational flexibility owing to the smart grid and smart cities paradigm.
Also, it should be noted that MES could be designed at different architectures in the literature such as district level, city level and country level [6]-[7].
Combined heat and power units (CHP), heat pumps (HP), compression electric refrigerators, water absorption refrigerators, combustion heat generators, auxiliary boilers, and other units are the main components of the MESs. It makes possible to convert different energies into another forms to supply end-users demand effectively.
B. Relevant Literature
There have been various efforts in the literature to tackle the above mentioned concerns by taking MESs into account. Relevant studies can be classified into manifold categories such as the overview of MESs applications, which examines the subject from different points of view such as designing and sizing of MESs, power flow examinations, and optimal operation of MESs. The categorization of the studies on MESs might be changed or expanded according to different perspectives.
Drivers, existing models of MESs, barriers and possible future studies were addressed in [1]. In [4]-[5], distributed multi generation, cogeneration and trigeneration concepts that have crucial impacts on MESs were explained, and furthermore distributed multi generation characteristics and structures were outlined.
Mancarella [6] comprehensively overviewed the MES structure, where the latest models and assessment techniques were provided in detail. Moreover, the energy hub, microgrids and virtual power plants concepts were presented in addition to several economic evaluations. Geidl and Andersson [7] presented a general power flow optimization model of a MES considering a conceptual-based approach.
Besides, a mixed integer linear programming (MILP) based power flow model for a MES was developed in [8]. In order to dispose of non-convexity related to the natural gas transmission, a piecewise linear approximations method was used in this study. In addition, to reveal the effectiveness of the proposed MILP model, a detailed comparison with the nonlinear model was also provided.
Reference [9] performed power flow optimizations for MESs and the energy flow optimization for multi-carrier systems were also conducted in [10]. In [11], a MES structure that contains transformer, gas generator/boiler, electric heater/cooler, and absorption cooler for electricity, heating and cooling demand of end-users was proposed. Besides, an operational optimization model was constructed, load shifting together with the curtailment was applied to the system, and the related results were discussed in detail. In [12], the coordinated operation of a multi-energy distribution system with combined cooling, heat and power and renewable energy sources was carried out. It should be stated that the devised model consists of a photovoltaic power station, a wind farm and micro gas turbines, boilers, and chillers. In [13], a small scale MES was presented and aimed at operating it in an optimal way. It is worth underlining that the model consists of CHP, auxiliary boiler, water absorption refrigerators and compression electric refrigerators.
Somma et al. [14] devised a design optimization model to investigate about the exergy in distributed energy systems by considering renewables, the quality of supply sources and demand. The main objective of the proposed model is to determine the types, numbers, and sizes of the energy assets in distributed energy systems so as to minimize annual cost and maximize overall exergy efficiency. Ju et al. [15] constructed a hybrid system composed of solar and wind based renewable energy systems along with the combined cooling, heating and power systems. Afterwards, a multi-objective optimization problem was propounded to cope with energy rate, total operational cost, carbon dioxide emission, and the joint optimization. The different types of distributed multi generation that have boilers, CHP units, electric HP units, thermal energy storages and auxiliary boilers layouts were given, and also an economical optimization problem was evaluated in [16]. Chicco and Mancarella [17] presented the optimal operation strategies for multi-generation system by using a black-box modelling approach. Moreover, a trigeneration plant was used with the aim of minimizing operational cost and maximizing energy saving.
C. Contributions and Organization
In this study, a MES model that includes various types of CHP and HP units together with power grid is designed. The propounded model is formulated as a MILP-based optimization problem with the objective of minimizing the total cost of electricity and gas usage of the end-users. The contributions of the study are twofold.
• The devised model includes different types of CHP and HP units, in which the mentioned units have different rated powers and efficiencies in order to meet the end-user premises demand.
• In order to reveal the effectiveness of the proposed model as well as providing optimal operation of MES architecture, different case studies are conducted and investigated from different points of view.
-
+
-
- 0 --llnu·ldr, Heatln&: CoolinE
:¼~
~
:
Power Grid G:asPl:mt+~
---
+
----
®
~)
~
l _ _ _ _;L
~;
--
~
,
-
+
0 -' - - ~ JThe organization of the study is presented as follows. Section 2 provides a clarification of the proposed structure and the MILP-based formulation of the optimization problem in detail. Section 3 presents the results of the study and provides comparative discussions according to the results. Afterward, Section 4 accounts for the concluding remarks and the relevant future works.
II.METHODOLOGY
A. An overview of the proposed structure
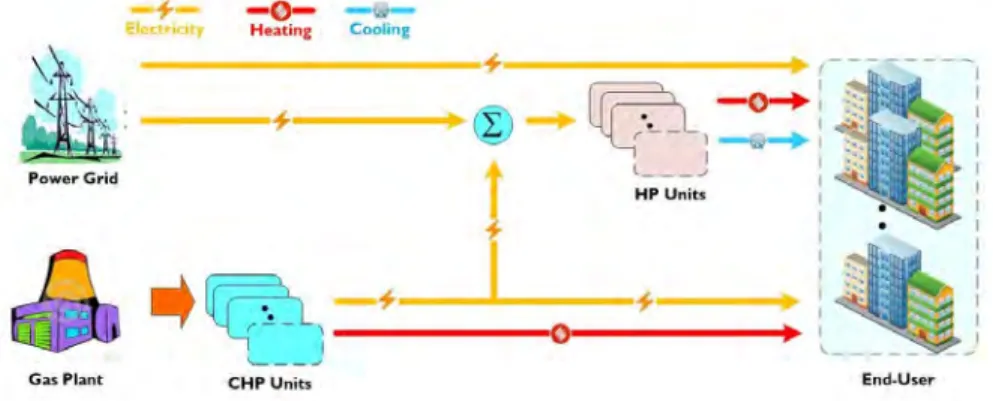
The network topology of the MES composing of electricity, heat and cooling production units is depicted in Figure 1 with the “black box” representation, which is one of the easiest ways for demonstrating complicated concepts. In this proposed layout, there are connections between the Electrical Distribution System (EDS) and the Fuel Distribution System (FDS) in order to provide electricity and gas inputs for the network. Two of the main components of this structure are CHP and HPs, which cooperate effectively with the aim of meeting demands of the commercial end-users while considering optimal operational economy.
It is obvious that CHP generators are capable of producing combined electricity and heat with different efficiency levels by utilizing natural gas as the primary energy source. From different points of view,
HPs are responsible for procuring heat and cooling needs of end users by drawing electricity from the grid or CHP output in this framework. Hence, an integrated gas and electrical network presents flexible operation in terms of cost, losses or emissions within the smart grid and smart cities paradigm. The formulation belonging to different sources and the objective functions are expressed in the following section.
B. Mathematical Formulation
MILP-based formulation of the proposed smart MES is presented in this subsection by taking into consideration multi-energy demand, electricity and heat supply units, and also energy conversion systems operational constraints.
B.1. Objective Function
= ∙ + ∙ , ∀ , ∀ (1)
In the optimization problem, the objective function denoted by (1) is required to be minimized in terms of total energy costs including several terms. This is based on the injected power from the grid ( ), the amount of imported gas by the district ( ) and the time-dependent electricity ( ) and fuel ( ) prices, respectively. B.2. Modelling of CHPs = , , , ∀ , ∀ (2) , , ≤ , , , + , , , , ∀ , ∀ (3) , , = , , + , , , ∀ , ∀ (4) , , = , , + , , , ∀ , ∀ (5)
It is important to highlight that outer gas network supplies natural gas demand ( ) of total CHP units ∑ , , , which is expressed in Equation (2). Energy conversion of CHP
devices including gas to electricity and gas to heat outputs is represented with (3) as a linear function, indicating that the power input of each ℎ CHP units should not exceed the maximum electricity ( , , , ) and heat productions ( , , , ) divided by the efficiencies ( , ). More specifically, the time-dependent energy demand of HP ( , , ), also the heat and electricity demand of end-users
( , , , , , ) are directly supplied by CHP
outputs within the operating restrictions as modelled with (4) and (5). B.3. Modelling of HPs = , , + , ∀ , ∀ (6) , , = , , + , , , ∀ , ∀ , ∀ (7) , , = , , + , , , ∀ , ∀ (8) , , ≤ , , , + , , , , ∀ , ∀ (9) , , ≤ ∙ , , ∀ , ∀ (10) , , ≤ ∙ 1 − , , ∀ , ∀ (11)
From the outer energy system operator perspective, energy can be injected from the grid ( ) in order to meet end-users electricity demand directly ( ) and to feed HP units’ as an electricity source (∑ , , ) for its energy conversion process as denoted by (6). Equation (7) imposes that the total electricity input of HPs (∑ , , ) is supplied by both CHPs
(∑ , , ) and the network (∑ , , ) as mentioned
before. It is worth noting that HP is an emerging technology that is responsible for matching cooling ( , , ) and some part of heating ( , , ) demand of end-users’, basically converting electricity into these forms of energies by dividing efficiency rates as indicated in (8). Energy efficiency ratio ( ) and coefficient of performance ( ) are two of the main indicators of how individual HPs effectively utilize electricity in heating and cooling process. Moreover, the operational constraint is formulated in (9)
considering maximum heat ( , , , ) and cooling
( , , , ) output capacities. Meanwhile, the HP is ensured to not produce heating and cooling energy at the same time using binary variable ( , ), as denoted by (10) and (11).
B.4. Modelling of end-users , = + , , , ∀ , ∀ (12) , = , , + , , , ∀ , ∀ , ∀ (13) , = , , , ∀ , ∀ (14)
The cooperation of multi-energy technologies such as regional power grid, gas network and heating/cooling systems in a smart district presents wide range of benefits, including energy efficiency, economic savings with cost-effective solutions and flexible operational axioms. Equations (12)-(14) enforce commercial end-users’ real-time demand which is supplied by different units with the energy conversion process. Electricity
need of end-users ( , ) can be met by the power
system ( ) and the sum of all CHP units’ output
energy (∑ , , ) as denoted by (12). Although
heating demand can be supplied by CHP and HP outputs, cooling demand can only be procured by the HP units as indicated in (13) and (14).
III.TEST AND RESULTS
A. Input Data
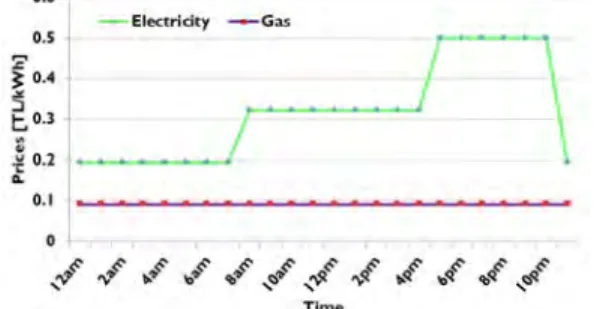
In this paper, the real time-of-use (ToU) tariff data is used to show how different electricity prices change the proposed optimal system response in terms of operating CHP and HP units also scheduling electricity and gas inputs. The electricity and gas prices are taken from [18] and [19] and depicted in Fig. 2. It is clearly seen that electricity prices are changing 3 times in daily operation which are 0.194 TL/kWh, 0.321 TL/kWh and 0.499 TL/kWh for 12 am -7 am, 7 am - 5 pm and 5 pm - 11 pm, respectively. On the other hand, constant gas tariff is considered in this study which is always cheaper than electricity prices, obviously.
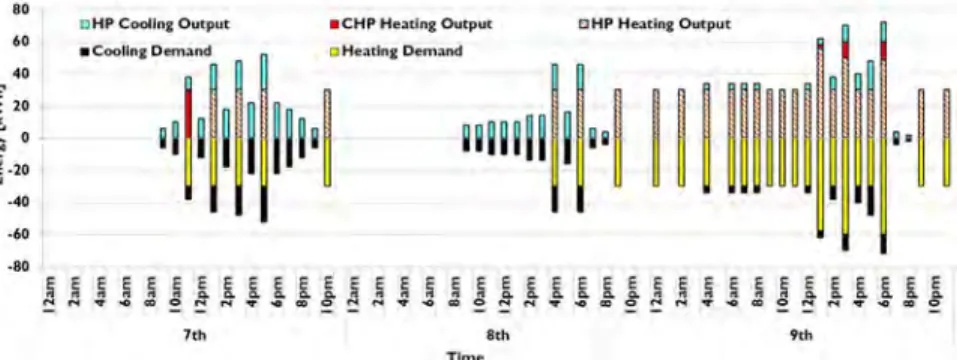
The real energy consumption of neighborhood is taken from [20] consisting of hourly electricity, heating and cooling demand of end-users. In order to make clearer representation and to draw general scheme for optimization algorithm’s working principle, three days of June 7th, 8th and 9th are taken into consideration as shown in Fig. 3. It is worthy to noting that types of energy need are changing every period, i.e., only electricity is demanded in certain periods (12 am - 8 am) while both cooling and electricity can be demanded (9 am -10 am).
The real CHP and HP units’ data are taken from [4] and [5] including theirs electric and heating efficiencies as well as rated powers as stated in Table IV and Table V. Various units are considered in different specifications for the purpose of making realistic assumptions.
Figure 2. Electricity and gas prices.
TABLE IV. COMBINED HEAT AND POWER UNITS TECHNICAL DATA
, ,
1 0.27 0.663 6.5 16
2 0.325 0.628 33 63.7
3 0.32 0.633 30 59.4
4 0.325 0.616 48 91
TABLE V. HEAT PUMP UNITS TECHNICAL DATA
, , 1 4.52 4.51 3.2 2.5 2 3.94 3.83 4 3.3 3 3.8 3.43 8.1 7.1 4 3.82 3.55 6.8 6 5 3.57 3.16 9 8 B. Simulation Results
For the sake of simplicity, the results are represented for only three consecutive days 7th, 8th, 9th of June. To address the heating, cooling and electricity demand of neighborhood, they are supplied from different sources by considering objective function. The main goal of the optimization algorithm is to minimize the total cost from the end-user perspective.
The electricity need of neighborhood can be met by upstream grid and/or CHP units as illustrated in Fig. 4. The electricity demand fluctuates between 40 kW and 130 kW for three days. It can be deduced from the figure the transferred energy from the upstream grid provides this consumption during 12 am to 7 am while it is matched by only CHP units during 8 am to 10 pm for 7th of June.
In fact, it has almost the same characteristics when comparing with the other days. This is because, there is not so much difference between the electricity and gas prices at the beginning of the day. Therefore, it is the right time to transfer power from upstream grid in a cheaper way instead of utilizing CHP units. On the other hand, the energy consumption has started to be supplied by CHPs from 8 am to 10 pm due to continuously increasing electricity prices. It is hence to be highlighted that the proposed algorithm schedules energy transactions between parties considering the optimization target and system requirements. CHP and HP units rated powers, efficiencies and prices are the main determinant in energy management architecture of MES.
Neighborhood cooling and heating energy balance is depicted in Fig. 5 which can be matched from CHP and/or HP system components without interruption. HPs are capable of producing both heating and cooling energy while CHPs only provide heating consumption in this graph. It is clearly seen that the HPs are utilized as a primary source and the energy need is fully provided for most of the time by HPs. Because, the heating rated powers are less than those of CHPs, which makes this source a more affordable source to supply this consumption. However, CHPs are also to be operated in 1 pm, 3 pm and 6 pm for 9th of June at the highest consumption hours. The main reason is that HPs’ maximum heating output is not enough to satisfy this peak demand, which leads to produce heating energy from gas by CHP units. Considering the economic benefits, the optimum decision-making process is being performed effectively.
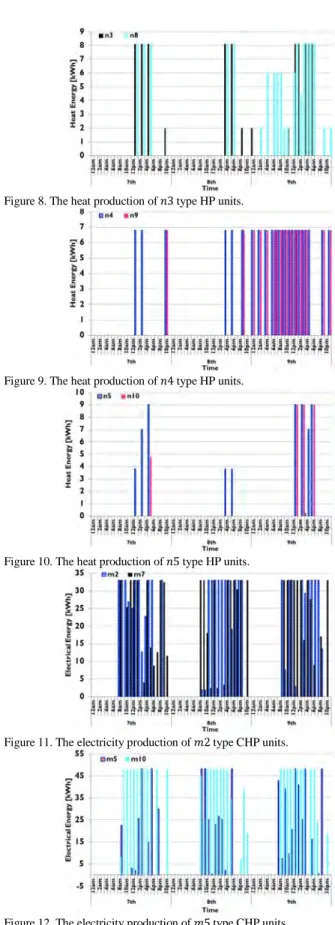
Figures 6-10 show the various HPs’ heating output data which have different specifications. Identical HPs are grouped and the results are given in five graphs. Even if they have same characteristics ( 1 6; 2 7; 3 and 8; 4 and 9; 5 and 10), it is possible to be operated in different hours based on decision-making outputs. In fact, the algorithm firstly gives signals to the identical HPs if the demand is not so high. However, the increasing consumption makes the others produce energy by taking economic constraints into account. It is not wrong to indicate that HPs are operated excessively during 12 am to 12 pm for 9th of June, but, mostly 1 (also 6), 2 (also 7) and 4 (also 9) due to less rated powers comparing 3 (also 8) and 5 (also 10). When affordable units are not capable of providing peak consumption, the high-priced components are to be performed in order to prevent interruption. Also, the 5 type is utilized for only necessary intervals due to its highest power consumption and lowest efficiency.
Figures 12 and 13 are drawn to show 2 and 5 type CHP units’ electricity outputs for again three consecutive days.
0.6 • 1 EIO<Ctrldty - Gas o,s ~ • '.c' ~ 0.4
5
t. 0.3 ; ~0.2 · ~ .. Q. 0.1 ~ ~ 0,•l'
,,l
.,.f' ..l
.,.f',.l'
,-$~ ,:l" .. Q~ ._q~ .,l·,,l'
TlmoI
I
I
I
I
I
I
I
I
I
I
Normally, ten CHPs are considered in this study but only some of them are analyzed. Electricity consumption of neighborhood is supplied by CHPs especially in 8 am to 10 pm for each day according to the low gas prices. CHPs are not operated in 12 am to 7 am by taking into electricity prices consideration.
Finally, two case studies are carried out in order to evaluate various pricing schemes impact on optimization algorithm outputs. The electricity prices are decreased and increased by 20% in the first and second case studies, respectively. The results are compared based on the case which utilizes normal electricity
prices as indicated in Table VI. The MES scheme tries to transfer more energy from upstream grid instead of CHPs in the first case and the total cost decreases quietly. On the other hand, increasing electricity prices makes CHPs to operate more due to the rising differences between two prices.
TABLE VI. COMPARISON OF THE CASE STUDIES Total Cost (TL)
Normal Electricity Prices 1459,888
20% increased case 1505,719
20% decreased case 1339,019
Figure 3. Total energy consumption of neighborhood for three consecutive days of June.
Figure 4. Total electrical energy balance for three consecutive days of June.
Figure 5. Total heating and cooling energy balance for three consecutive days of June
Figure 6. The heat production of 1 type HP units. Figure 7. The heat production of 2 type HP units.
18()
l&O 140
•CooflncDemand EJHe.i.tlng Dem;,.nd CElec:.crldryOemand
l.5 •n6 •nl 0.5 ... 1'20
1
1001
~
m
m
ii
l
7th 8th Time llS 0ElectridtyOem,;and •Upstrc.lm Gdd aCHPJ:
1111111
W -7Sj
BO &O 40f
20 ~ £i 0 !•lO •40 -•o -80 CHP Coollna Output •Coo1lnt Oem.:md 7th111
11111111
•CHP Hl!:ttlng Output 11Hut1na: Demand 8th Time 0!
~
i
~~~nfffi\
.!l
}~
!!
~
H
~
l
~
~!
~
H
)~
Time1
11111111
EJHP Heatlna; Our-put 4.S Cln2 Dnl 9th·
111
1
9thFigure 8. The heat production of 3 type HP units.
Figure 9. The heat production of 4 type HP units.
Figure 10. The heat production of 5 type HP units.
Figure 11. The electricity production of 2 type CHP units.
Figure 12. The electricity production of 5 type CHP units. VI.CONCLUSIONS
In this study, a neighborhood optimization model is proposed to schedule different energy units in a coordinated manner by taking into consideration multi-energy demand, energy conversion devices constraints and the physical limitations of the integrated network under a cost minimization objective. A MILP-based mathematical formulation is implemented for MES planning with the aim of managing electricity/heating/cooling requirements, as well as to increase energy efficiency.
Furthermore, ToU electricity price is employed to investigate the impact of different price schemes on the integrated energy system. The model is demonstrated with the case studies to validate the effectiveness of the proposed framework, which is based on real data taken from NREL for a multi-energy neighborhood. In this system, energy carriers are characterized based on their rated power, cost and efficiency. As a result of this, the best operational strategies are developed by considering the mentioned quantities and system conditions such as peak periods. MES presents significant advantages to operate the smart neighborhood from the economic perspective.
ACKNOWLEDGMENT
J.P.S. Catalão acknowledges the support by FEDER funds through COMPETE 2020 and by Portuguese funds through FCT, under SAICT-PAC/0004/2015 (POCI-01-0145-FEDER-016434) and 02/SAICT/2017 (POCI-01-0145-FEDER-029803).
REFERENCES
[1] P. Mancarella, G. Andersson, J. A. Peças-Lopes, and K. R. W. Bell, “Modelling of integrated multi-energy systems: drivers, requirements, and opportunities,” 19th Power Syst. Comput. Conf. PSCC 2016, 2016. [2] J. A. Sautter, J. Landis, and M. H. Dworkin, “The energy trilemma in the
green montain state: an analysis of Vermont’s energy challenges and policy options,” Vermont J. Environ. Law, vol. 10, pp. 478–506, 2010.
[3] Online Available.
https://www.businessgreen.com/bg/opinion/2306739/only-efficiency-can-solve-the-energy-quadrillema. June, 2018.
[4] G. Chicco and P. Mancarella, “Distributed multi-generation: a comprehensive view,” Renew. Sustain. Energy Rev., vol. 13, no. 3, pp. 535–551, 2009.
[5] X. Liu and P. Mancarella, “Modelling, assessment and sankey diagrams of integrated electricity-heat-gas networks in multi-vector district energy systems,” Appl. Energy, vol. 167, pp. 336–352, 2016.
[6] P. Mancarella, “MES (Multi-Energy Systems): An overview of concepts and evaluation models,” Energy, vol. 65, pp. 1–17, 2014.
[7] M. Geidl and G. Andersson, “A modeling and optimization approach for multiple energy carrier power flow,” IEEE Power Tech, pp. 1–7, 2005. [8] C. Shao, X. Wang, M. Shahidehpour, X. Wang, and B. Wang, “An
MILP-based optimal power flow in multicarrier energy systems,” IEEE Trans. Sustain. Energy, vol. 8, no. 1, pp. 239–248, 2017.
[9] M. Geidl, G. Andersson, M. Geidl, and G. Andersson, “Optimal power flow of multiple energy carriers,” IEEE Trans. Power Syst., vol. 22, no. 1, 2007.
[10] A. Shabanpour-Haghighi and A. R. Seifi, “Energy flow optimization in multicarrier systems,” IEEE Trans. Ind. Informatics, vol. 11, 2015. [11] Y. Li, C. Wei, D. Guo, W. Liu, and X. Chen, “Bilateral collaborative
operation optimisation model in integrated multi-energy system,” J. Eng., vol. 2017, no. 13, pp. 2519–2524, 2017.
[12] Y. Jiang, J. Xu, Y. Sun, C. Wei, J. Wang, S. Liao, D. Ke, X. Li, J. Yang, and X. Peng, “Coordinated operation of gas-electricity integrated distribution system with multi-CCHP and distributed renewable energy sources,” Appl. Energy, vol. 211, no. September 2017, pp. 237–248, 2018. [13] G. Chicco and P. Mancarella, “Matrix modelling of small-scale
trigeneration systems and application to operational optimization,” Energy, vol. 34, no. 3, pp. 261–273, 2009.
[14] M. Di Somma et al., “Multi-objective design optimization of distributed energy systems through cost and exergy assessments,” Appl. Energy, pp. 1299–1316, 2017.
[15] L. Ju, Z. Tan, H. Li, Q. Tan, X. Yu, and X. Song, “Multi-objective operation optimization and evaluation model for CCHP and renewable energy based hybrid energy system driven by distributed energy resources in China,” Energy, vol. 111, pp. 322–340, 2016.
[16] T. Capuder and P. Mancarella, “Techno-economic and environmental modelling and optimization of flexible distributed multi-generation options,” vol. 71, pp. 516–533, 2014.
[17] G. Chicco, P. Mancarella, P. Torino, and I. Elettrica, “Optimal operational strategies for multi-generation systems,” 16th PSCC, pp. 1–7, 2008. [18] Online Available.
https://www.epdk.org.tr/Detay/Icerik/3-1327/elektrik-faturalarina-esas-tarife-tablolari, March, 2019.
[19] Online Available. http://www.igdas.istanbul/serbest-tuketici-satis/, June, 2018.
[20] Online Available. https://openei.org/datasets/dataset/nrel-rsf-measured-data-2011, June, 2018. •n3 n8 an4 •n9 0