Fluorescent Heterodoped Nanotetrapods as Synergistically
Enhancing Positive and Negative Magnetic Resonance Imaging
Contrast Agents
V. K. Sharma,
†,‡A. Alipour,
†Z. Soran-Erdem,
†Y. Kelestemur,
†Z. G. Aykut,
†and H. V. Demir
*
,†,‡ †LUMINOUS! Center of Excellence for Semiconductor Lighting and Displays, School of Electrical and Electronic Engineering,School of Physical and Mathematical Sciences, Nanyang Technological University, Singapore 639798, Singapore
‡UNAM-Institute of Materials Science and Nanotechnology, UMRAM-National Magnetic Resonance Research Center, Department
of Electrical and Electronics Engineering, Department of Physics, and Department of Molecular Biology and Genetics, Bilkent University, Ankara 06800, Turkey
*
S Supporting InformationABSTRACT: In this work, we report Mn−Fe heterodoped ZnSe tetrapod nanocrystals (NCs) synthesized to synergisti-cally enhance contrast in both T1- and T2-weighted magnetic resonance imaging (MRI). The proposed NCs were prepared using a customized heteroarchitecture such that the manganese (Mn) is confined in the core and iron (Fe) in the branches of the tetrapods. The elemental composition and profile of these NCs were studied using X-ray photoelectron spectroscopy, energy-dispersive X-ray spectroscopy, and inductively coupled plasma mass spectroscopy. Photoluminescence quantum yield of these heterodoped NCs in water is ∼30%. Magnetic measurements reveal the simultaneous presence of
super-paramagnetic and super-paramagnetic behavior in these NCs because of the coexistence of Mn2+and Fe2+dopants. Their potential as simultaneous positive and negative MRI contrast agents was demonstrated by relaxivity measurements and in vivo MRI. From the in vivo studies, we also found that these NCs (with a hydrodynamic diameter of 20 nm) are excreted from the body within 24 h after the injection. Therefore, these heterodoped tetrapods NCs, while being fluorescent and safe, hold great future as a synergistically enhancing dual-modal MRI contrast agent.
KEYWORDS: nanotetrapods, heterodoped ZnSe nanocrystals, magnetic resonance imaging,fluorescence imaging, contrast agents
1. INTRODUCTION
Multimodal imaging using nanomaterials integrated with two or more functionalities is pursued actively worldwide, offering accurate and reliable tools for medical applications.1,2Thus, by integrating the complementary merits of different imaging modes, accurate and reliable biomedical information can be obtained. Several multimodal imaging techniques already exist in the market, for example, positron emission tomography (PET)/computer tomography (CT) and PET/magnetic resonance imaging (MRI) are successfully being used clinically worldwide.3However, compared to CT, PET, and MRI, optical imaging (OI) techniques while being low cost are also promising for revealing biomedical information with high sensitivity.
Among different kinds of fluorescent materials, quantum dots (QDs) have been demonstrated as a potential imaging probe for obtaining detailed subcellular information in vitro.4 QDs possess exceptional optical features which are mostly controlled by their size, composition, and surface chemistry.5Also, when compared to other classes offluorescent materials, they exhibit narrower emission spectra and enhanced stability. However,
fluorescence imaging (FI) suffers from poor spatial resolution and limited optical penetration depth in the tissue. MRI, on the other hand, is an important clinical tool for screening the anatomical details with high resolution. Nevertheless, despite its three-dimensional imaging capability, the inherent low sensitivity of the MRI technique demands the use of contrast agents.
MRI contrast agents are categorized according to their effects on spin−lattice or longitudinal (T1) and spin−spin or transversal (T2) relaxations. Superparamagnetic iron oxide (SPIO) nanoparticles (NPs) are well-known and commercially available T2contrast agents.
6
T2contrast agents are known for low toxicity and have good biocompatibility, but their intrinsic dark signal can mislead the clinical diagnosis. In contrast, T1 contrast agents, typically based on paramagnetic (Gd and Mn) materials,7,8provide a distinctive resolution between the tissues because of its high signal intensity. Therefore, it is highly
Received: February 26, 2016
Accepted: May 3, 2016
Published: May 3, 2016
www.acsami.org
Downloaded via BILKENT UNIV on December 23, 2018 at 18:08:01 (UTC).
desirable to design contrast agents that can synergistically enhance T1 and T2 contrast in MRI to overcome the shortcoming of individual contrast agents. Furthermore, the combination of FI and MRI (both T1- and T2-weighted) offers robust imaging capabilities that will significantly improve the detection accuracy in clinical diagnosis. To the best of our knowledge, there is no commercial probe available in the market with MRI/FI dual-modal imaging capabilities.
Dual-modal imaging (FI and T1-weighted7,9 or T2 -weighted10) based on the unification of QDs and magnetic NPs are of intense interest worldwide among various research groups. Most of these works use cadmium (Cd)-based QDs for FI, whereas for MRI, Gd is used for T1-weighted imaging and SPIO NPs for T2-weighted imaging. Gadolinium (Gd) has been the most used paramagnetic material for T1-weighted MRI, but recently it has been associated with a progressive, potentially fatal multiorgan systemfibrosing disease known as nephrogenic systemic fibrosis (NSF).8 Because of this risk, the U.S. Food and Drug Administration discourages the use of gadolinium-based contrast agents in patients who suffer from acute renal insufficiency.11 Similar to Gd, cadmium is another toxic element (RoHS, Europe) restricting its usage for applications linked to human health. These drawbacks led researchers to work on Cd- and Gd-free materials for dual-modal contrast agents. As a good alternative to Gd-based MRI contrast agents, manganese-based NCs are considered safer.8In this direction, there are few reports12−15 available in the literature that use manganese for the combined FI and T1-weighted MRI. Gaceur et al.13 studied the Zn0.9Mn0.1S NPs and reported their high relaxivity with a short discussion on the optical performance. In another study, Ding et al.14 demonstrated FI and MRI capabilities from the CuInSn2@ZnS:Mn QDs. As a potential candidate for dual-modal imaging, Mn-doped ZnSe NCs15have also been studied.
T1- and T2-weighted MR imaging using nonfluorescent NCs is not a new field. For example, manganese iron-doped (MnxFe1−xO) NPs16−20have been widely studied by different groups for positive and negative contrast agents in MRI. In these doped NPs, high-quality imaging in both T1- and T2 -weighted MRI strongly depend on the dopant concentration. Recently, it is also pointed out that T1and T2contrast agents should not be in direct contact with each other. Otherwise, the magnetic field generated by a superparamagnetic (SPM) T2 contrast materials perturbs the relaxation process of the paramagnetic (PM) T1 contrast material which undesirably quenches the T1signal.21Considering these issues, researchers came up with new architectures. One of these designs was based on the SPM core (T2) and PM shell (T1) structure with a spacer layer such as silica and platinum between them. Shin et al.22used SiO2as spacer layer in their study and reported that 16 nm silica thickness is adequate between two magnetic materials to have high T1and T2signals. In addition, Cheng et al.23synthesized hybrid nanotrimers obtained by combining T1 iron oxide and Gd-coated Au nanocrystals separated by 5 nm platinum nanocubes. Another design was based on bioconju-gation of T1- and T2-based materials. Using this architecture, Bae et al.24 synthesized gadolinium-labeled magnetite nano-particles for T1- and T2-weighted MRI. However, all these architectures require complex conjugation steps and synthesis procedure which results in bigger size, leading to problems in renal excretion.
In this work, we propose a simple architecture exhibiting simultaneous T1 and T2 contrast enhancement in MRI. The
schematic of Mn−Fe heterodoped ZnSe nanotetrapod
structure is shown inFigure 1a. In our nanotetrapod design,
Mn sits at the core whereas the Fe is on the branches of these nanocrystals. Also, to the best of our knowledge, there has been no report on the fluorescent NCs, which can simultaneously enhance both T1- and T2-weighted MR imaging. In addition, these NCs are safer since they are both Cd- and Gd-free. Moreover, these NCs possess small hydrodynamic diameter (20 nm) and are easily excreted through the renal system which is also confirmed by our in vivo studies.
2. EXPERIMENTAL SECTION
Mn−Fe heterodoped ZnSe tetrapod nanocrystals (NCs) are synthesized using a modified recipe25and details are provided in the
Supporting Information. UV−vis absorption (Abs) spectra were
obtained using an UV−vis spectrophotometer (Varian Cary 100). Photoluminescence (PL) spectra of the NCs were obtained with a fluorescence spectrophotometer (Varian Cary Eclipse). The quantum yield (QY) of the NCs was measured using Horiba Jobin Yvon time-resolved fluorescence setup using an integrating sphere F-3018. Transmission electron microscopy (TEM, Tecnai G2 F30) images were obtained using a high-resolution transmission electron micro-scope (HR-TEM) operating at 300 kV. Prior to the imaging, 2μL of diluted samples was dropped onto a copper TEM grid and allowed to dry. Elemental analyses are performed using energy-dispersive X-ray spectroscopy (EDS), X-ray photoelectron spectroscopy (XPS, Thermo K-Alpha), and inductively coupled plasma mass spectroscopy (ICP-MS, Thermo X Series II). All elemental analyses are performed three times. Fluorescence imaging of NCs drop-casted on the quartz were obtained using Carl Zeiss Axio Scope Fluorescence Microscope. An excitation wavelength of 405 nm (LED) (power less than 5 mW) was used with a 560−600 nm emission pass filter. MRI experiments (phantom and in vivo) were performed on a 3 T Siemens TrioTim MR scanner. MRI were acquired using a spin-echo image sequence (slice thickness = 3 mm,flip angle = 90°, acquisition matrix = 256 × 256 pixels,field-of-view (FoV) = 90 × 90 mm2, echo time (TE) = 13 ms, repetition time (TR) from 100 to 10 000 ms), where T1 is extracted byfitting an exponential function to these curves by using least-squares curve-fitting algorithm.
In Vivo MR Imaging. Animal experiments were performed using a Sprague-Dawley (200−250 g) rat according to a protocol approved by the animal ethics committee of Bilkent University, Turkey. MRI experiments were performed at room temperature on a 3 T Siemens Figure 1. (a) Schematic of the growth of Mn−Fe heterodoped tetrapod NCs (yellow color is Mn and red is Fe). TEM images of MZS NCs obtained after (b)first and (c) second injection of Zn precursor. (d) TEM image of Mn−Fe heterodoped tetrapod NCs.
TrioTim MR scanner. T1-weighted and T2-weighted in vivo rat MR images were acquired using a spin-echo (SE) sequence under the following parameters: TR/TE = 550/11 ms (T1), TR/TE = 4420/94 ms (T2) (slice thickness = 2 mm,flip angle = 90°, acquisition matrix = 384 pixels× 384 pixels, FoV = 90 × 90 mm2).
Cytotoxicity Studies. To investigate the in vitro cytotoxicity of 3-mercaptopropionic acid (MPA)-coated water-soluble MFZS tetrapod NCs, we performed Alamar Blue Assay using L929 mouse cell line. Before the cell culture study, MFZS NCs were exposed to UV for 45 min for sterilization. Then 2× 10⁴L929 cells were seeded into a 96 well plate and waited for 4 h for cell adhesion. MPA-coated MFZS NCs were added onto the cells with the concentrations of 0, 25, 75, and 100 μg/mL cells were cultured in Dulbecco’s modified Eagle’s medium (DMEM) containing 10% fetal bovine serum at 37°C and 5% CO2for 24 h. Subsequently, a cell medium was discarded and 200 μL of Alamar Blue solution (10% dye solution in DMEM-high glucose colorless medium) was added onto the cells. Following 1 h incubation at 37°C, the supernatant was transferred into a 96-well plate, and the absorbances at 570 and 595 nm were measured. A calibration curve was constructed using known concentrations of cells (L929) to relate the cell numbers to the dye reduction (%). Statistical analyses were performed using GraphPad Prism 7, and one-way ANOVA and Tukey’s multiple comparisons post-tests were employed to determine the statistical difference of viability in different concentrations.
3. RESULTS AND DISCUSSION
Mn−Fe heterodoped ZnSe (MFZS) tetrapod NCs were
synthesized using modified nucleation doping strategy where Mn is mostly localized in the core and Fe in the branches. The schematic of the strategically synthesized nanotetrapods is shown in Figure 1a. TEM was used to investigate the morphology and crystal structure of these NCs. Figure 1b,c shows the TEM images of Mn-doped ZnSe (MZS) NCs obtained afterfirst and second injection of Zn precursor. It is observed that after second injection, the shape of NCs has been deviated from spherical to branched/tetrapods. Figure 1d represents the TEM image of MFZS NCs after the addition of Fe into MZS NCs. The branched NCs (nanotetrapods) have an average size of ∼16 nm, with a core diameter of ∼4.2 nm, a branch length of∼5.9 nm, and the thickness of ∼2.5 nm. There are few reports available in the literature on the varied shaped MZS NCs.26,27Wu and Warner26reported that the shape of the MZS NCs can be easily tuned between spherical and branched by controlling the Zn precursor amount and the injection temperature. According to them, the branching starts immediately after thefirst injection of Zn precursor, but can be controlled by the rate of injection. Similarly, the Peng group27 reported that the shape of the NCs can be altered between sphere and tetrapods by varying the concentration of fatty acids and fatty amines. In both of the references mentioned above, Mn was localized in the core. We believe that, in our case, the Zn precursor amount together with the rate of injection resulted in tetrapod shapes. The proposed atomic model for tetrapod shapes of the MZS NCs is described in detail in our previous study.25Also, the shape of the NCs was already tetrapods25,28before the introduction of Fe as observed in our case as well. Thus, we believe that Fe is present on the branches of the NCs. This has been further confirmed with the energy-dispersive X-ray spectroscopy measurements in con-junction with HR-TEM.
Figure 2shows a HR-TEM and spatially resolved elemental data (EDS) analysis of tetrapod NCs. The EDS spectra of the core (A) and branch (B) areas are obtained and the Mn or Fe to Zn molar ratio (Mn/Zn or Mn/Fe) are shown in the inset of Figure 2. Results reveal that Mn was detected only in the core
area of the tetrapods whereas Fe is observed in the branches of the tetrapod NCs. Our synthesis strategy in conjunction with the results conclude that Fe is mostly located at the edges of the nanotetrapods (represented by red color in the schematics).
We have carried out a detailed selected area electron diffraction (SAED) investigation to probe the crystal structure and impurity phases in these NCs. The SAED pattern of MZS NCs obtained before and after Fe doping is shown inFigure S1 (see Supporting Information). Clear nanocrystalline rings were observed for MZS NCs which can be indexed to the ZB (zinc blende) phase of ZnSe. However, we do not observe any new phase from the SAED pattern of MFZS NCs obtained after Fe doping, suggesting that Fe is doped into MZS NCs.
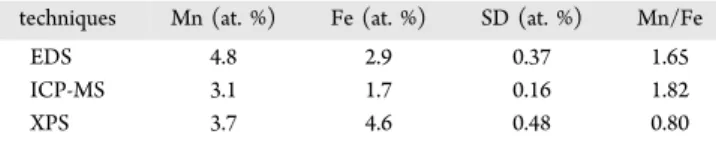
We have performed a detailed elemental characterization of these NCs using EDS, ICP-MS, and XPS to establish the location and concentration of Mn and Fe in these NCs. Three sets of measurements have been taken for all the character-izations and the average and standard deviation (SD) data are presented inTable 1. EDS has been used in conjunction with
TEM to ascertain the location of Mn and Fe in the NCs. The results demonstrated that the Mn is in the core, whereas Fe is mostly localized in the shell (Figure 2). The corresponding Mn/Fe ratio in the MFZS NCs obtained using EDS and ICP-MS techniques are quite similar, which is expected. EDS and ICP-MS techniques provide the overall ratio of the two cations in the sample; therefore, the observed Mn/Fe ratio should be close to the actual value. On the other hand, XPS, which is a surface-sensitive technique, shows (lower Mn/Fe ratio value compared to EDS and ICP-MS) consistency with the targeted core−shell structure and proves that Mn atoms are confined in the core whereas Fe is mostly found in the shell. The reason for difference in Mn/Fe ratio between XPS and other techniques (EDS and ICP-MS) is most probably due to the tetrapod geometry of the NCs. Since one of their branches is always in the up direction, it is expected to observe more Fe than Mn in
Figure 2.HR-TEM image of the Mn−Fe heterodoped ZnSe tetrapod NCs along with EDS data.
Table 1. Elemental Data Obtained by EDS, ICP-MS, and XPS of MFZS NCs
techniques Mn (at. %) Fe (at. %) SD (at. %) Mn/Fe
EDS 4.8 2.9 0.37 1.65
ICP-MS 3.1 1.7 0.16 1.82
XPS 3.7 4.6 0.48 0.80
XPS data. For this reason, we take account of these results of the ICP-MS measurement andfind that the actual value of Mn and Fe concentration is 3.1 and 1.7 at. % in these NCs, respectively. In our previous study, we have found that the Mn concentration of 3.2 at. % is the optimum where we have highest efficiency for MZS NCs.15Photoluminescence studies of MFZS NCs with different Fe doping concentrations has been carried out and is presented in Figure S2 of the Supporting Information. On the basis of this data, it is found that Fe concentration of 1.7 at. % in MFZS NCs is optimum for high FI and MRI.
PL studies of all the NCs were carried out by a 300 nm excitation source and are shown inFigure 3. PL spectra of MZS
NCs show a broad emission band at 583 nm with a full-width at half-maximum (fwhm) of∼52 ± 1 nm, which is attributed to the4T
1to6A1transition in Mn2+.
29
We only observe the pure Mn-doped emission without any band edge emission originating from ZnSe, thus confirming that Mn2+ is successfully incorporated into ZnSe host. After the doping of Fe into the MZS NCs, we observed a decrease in the intensity of the Mn-doped emission with the additional appearance of emission from ZnSe band gap. Fe doping is popularly known for quenching the emission in ZnSe and ZnS nanocrystals.30−32 It is believed that after the Fe introduction, the Mn-doped emission intensity decreases because the absorbed energy is transferred from Mn2+ ions to the quenching centers such as Fe2+-related centers and surface state.31It is known that in bulk Fe-doped ZnS,30 Fe atoms act as electron-trapping centers which results in nonradiative recombination. In our case, we observe quenching in the emission as well. In the literature, there is no consensus on the Fe2+-related emission; that is, Cao et al.33reported 490 nm whereas Kang et al.34attribute 520 nm emission to the iron doping in ZnS nanowires. Moreover, some groups reported that they do not observe any emission in the visible range in Fe-doped ZnS NCs.31,32,35,36In our case, we also did not obtain any Fe-related emission, but we observe quenching in the emission of Mn-doped NCs after Fe introduction. These results suggest that Fe is doped successfully into the ZnSe NCs which is also confirmed by SAED pattern and elemental studies. After the last shell of ZnSe is deposited, the doped PL emission has been recovered with no emission from the ZnSe band gap. Therefore, we confirm that both Mn and Fe are doped into the ZnSe NCs.
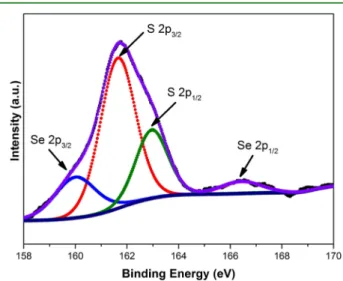
PL QY measurements performed by an integrating sphere revealed ∼23% efficiency for the MFZS NCs. Water-soluble NCs were obtained by ligand exchange (see Supporting Information for details) for biomedical applications. These NCs showed excellent colloidal stability in water with the hydrodynamic diameter of 20.6 nm, as measured by dynamic light scattering (DLS) (see Figure S3 of the Supporting Information). The comparative PL spectra (and absorption spectra) of the MFZS NCs dissolved in toluene and water are presented inFigure S4of the Supporting Information. The PL emission peak shifted by 5 nm (from 583 to 588 nm) after the ligand exchange, having a similar fwhm. Interestingly, QY of these NCs increases to ∼30% in water after ligand exchange from toluene, which is quite contradictory to what is reported in the literature.12 We believe that, in our case, it may be because of an additional ZnS shell formed on the MFZS NCs after the ligand exchange. Because our synthesis procedure includes an excess amount of Zn and this may possibly form ZnS by reacting with MPA. The formation of this possible ZnS shell on these NCs has been confirmed by XPS as shown in Figure 4. The peaks at 160.0 and 165.6 eV correspond to Se 3p
doublet transitions, and the peaks at 161.7 and 163.5 eV correspond to S 2p doublet transitions. The XPS data are consistent with the previous reports on the core−shell NCs.37 The 5 nm red shift in the PL peak after ligand exchange also supports this hypothesis.
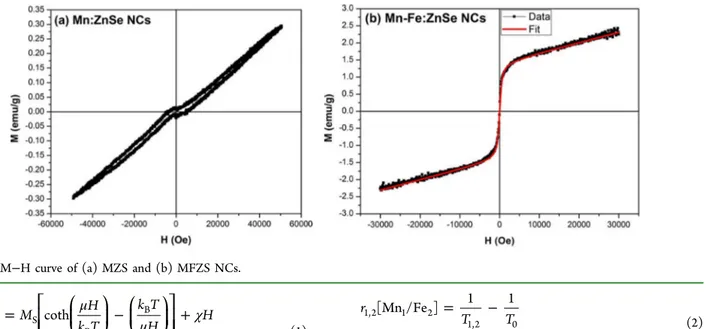
The field-dependent magnetic properties (M−H curve) of these NCs were measured using a physical property measure-ment system (PPMS) at body temperature (310 K). M−H curve of MZS NCs shows paramagnetic (PM) behavior (Figure 5a), whereas iron codoping introduces SPM (Figure 5b) behavior to the inherent PM behavior of these NCs. M−H data (Figure 5b) of MFZS NCs reveals that the magnetization is continuously increasing with the applied field, most probably because of the competing paramagnetic (PM) and SPM interactions resulting from the doping of Mn and Fe into these NCs. Also, there is a tenfold increase in the magnetization after the introduction of Fe into the MZS NCs. Therefore, we believe that the MFZS NCs possess mixed magnetic (PM and SPM) phases simultaneously. The presence of mixed magnetic (SPM + PM) phases in these NCs is substantiated byfitting the M−H curve ofFigure 5b with the relation below,
Figure 3.Photoluminescence spectra of the NCs excited at 300 nm.
Figure 4.High-resolution XPS spectrum of water-soluble MFZS NCs obtained after the ligand exchange.
μ μ χ = − + ⎡ ⎣ ⎢ ⎢ ⎛ ⎝ ⎜ ⎞ ⎠ ⎟ ⎛ ⎝ ⎜ ⎞⎠⎟⎤ ⎦ ⎥ ⎥ M T M H k T k T H H ( ) S coth B B (1)
where kBis the Boltzmann constant, M(T) is the temperature-dependent magnetization, Msis the saturation magnetization,μ is the magnetic moment, andχ is the susceptibility of the NCs. Thefirst and second term ineq 1represents the SPM and PM contribution, respectively. Thefit obtained by using eq 1(red color in Figure 5b) is in complete agreement with the experimental data, confirming the simultaneous presence of SPM and PM magnetic phases in the MFZS NCs. Therefore, we would expect simultaneous contrast enhancement in T1 -and T2-weighted MR images similar to MnFeO19and GdFeO38 NPs.
T1 and T2 relaxation efficiencies of the water-soluble fluorescent MFZS NCs were obtained from the phantom imaging experiments performed using a 3T Siemens MR Scanner. Prior to the imaging, we calculated the concentrations of Mn and Fe within MFZS NCs using ICP-MS and prepared four samples with different concentrations. T1- and T2-weighted phantom images of these samples and DI water are shown in Figure 6a,b. The increase in the intensity of bright contrast with
the increased Mn concentration is clearly observed for T1 -weighted MR phantom images. Similarly, a clear decrease in the intensity of dark contrast with increasing concentration of Fe has been observed for T2-weighted MR images. Thus, phantom results confirm the simultaneous contrast enhancement in T1 -and T2-weighted MR images using MFZS NCs.
The longitudinal (r1) and transverse (r2) relaxivities were determined from the following relation39
= − r T T [Mn /Fe ] 1 1 1,2 1 2 1,2 0 (2)
where T0and T1,2are the longitudinal and transverse relaxation times of DI water and the MFZS NCs, respectively.
The longitudinal (r1) and transverse (r2) relaxivities for the MFZS NCs were obtained from the slope of (1/T1,2− 1/T0) vs Mn/Fe concentration (Figure 7a,b), and are found to be 2.2 and 47.5 mM−1s−1, respectively. The r1relaxivity value of 2.2 mM−1s−1for these NCs is due to the large number of Mn2+ ions withfive unpaired electrons. These values are somewhat similar to the clinically available gadolinium-based MRI contrast agents (∼4 mM−1s−1),40thus offering promising substitutes to these contrast agents which are associated with NSF. Our MFZS NCs also exhibit T2relaxivity because of the presence of Fe2+ ions which introduces the SPM behavior in these NCs. Resovist41is a well-known commercially available T2contrasts agent with (hydrodynamic size∼60 nm) r2relaxivity as high as ∼150 mM−1s−1. Relaxivity values of our NCs are lower since their sizes were one-third of the Resovist sizes. The advantage of being smaller in size will help with the clearance of these NCs from the body which is discussed in detail in the next section. From Figure 6, we clearly observe increased (bright) and reduced (dark) signals intensities in T1- and T2-weighted MR images using MFZS NCs by increasing the concentration of Mn2+ and Fe2+, respectively. These results substantiate that these NCs can simultaneously act as both negative and positive MR contrast agents. Moreover, these NCs exhibit high PL QY (∼30%), which can be used as a complementary tool for obtaining detailed information for accurate medical diagnosis along with MRI. Afluorescence image of these NCs is taken with 405 nm excitation wavelength and is presented in the Supporting Information as Figure S5 to demonstrate their fluorescence imaging capabilities.
The in vitro cytotoxicity of MPA-coated MFZS NCs was investigated using the L929 mouse cell line with the concentrations of 0, 25, 50, 75, and 100μg/mL. No appreciable toxicity was observed up to the concentrations of 100μg/mL as shown in Figure 8. The result of cell assays confirmed that these NCs are not cytotoxic, up to high concentrations of 100 μg/mL.
We have further demonstrated the in vivo T1-weighted (Figure 9a) and T2-weighted (Figure 9b) MR imaging of blood vessels and kidneys using MFZS NCs. For in vivo MR imaging, T1 and T2 abdominal imaging before and after injection was Figure 5.M−H curve of (a) MZS and (b) MFZS NCs.
Figure 6. T1- and T2-weighted MR phantom images of the MFZS NCs.
conducted by using a 3T MR scanner. To observe the effect of our contrast agent, MFZS NCs were injected intravenously (dosage∼1 mg kg−1) into a Sprague-Dawley rat. The coronal images of blood vessels and kidney were recorded before the injection and after 5, 30, and 60 min following the injection. Abdominal MR images taken at postinjection time demon-strated that the veins carrying blood to kidneys and kidney itself progressively turned to brighter and darker in T1 and T2 coronal planes, respectively. The removal of NCs from the body was investigated by comparing the MR images of the rat at the same position (kidneys) after 24 h. The signal changes in kidneys and blood vessels obtained by both T1- and T2 -weighted MR imaging suggest that these NCs were removed from the body within 24 h.
Investigation of the biocompatibility and biodistribution of the nanoparticles is very crucial for the biological applications. In general, the biodistribution and clearance mechanisms of the
Figure 7.(a) T1and (b) T2relaxivity plots of the MFZS NCs obtained at 3 T @ 25°C.
Figure 8.Viability of L929 cell line treated with the MFZS tetrapod NCs for 24 h (ns, nonsignificant).
Figure 9.(a) T1- and (b) T2-weighted MR images of rat abdomen showing kidneys before MFZS NCs injection and 5, 30, and 60 min after injection at room temperature. Region of interests have been marked by the orange arrow.
NCs are related to the size, morphology, and surface characteristics together with their degradation duration within the physiological environment.42In the literature, a broad range of QD types were investigated for their potential toxicity along with their distribution and clearance in animal models.43−45For example, Hauck et al. studied the toxic effect of CdSe/ZnS core−shell QDs in rats along with their biodistribution and reported that there is no toxic effect even after the degradation of the QDs.46In another report, a pilot study carried out with rhesus macaques demonstrated that intravenously injected phospholipid micelle-encapsulated CdSe/CdSZnS QDs have no toxic effect. This study showed that the QD concentration was much higher in the liver, spleen, and kidney in the primates compared to those in the rats.44The effect of nanoparticle size on the clearance of QDs were also studied by Gao et al.47In this study, two different carboxylate-coated InAs/InPZnSe QDs with the hydrodynamic diameters of ca. 25 (QD800-COOH) and 10 nm (QD800-MPA) were used. Results demonstrated that QD800-MPA were excreted from the body more efficiently compared to the larger QD800-COOH nanoparticles. Furthermore, PL intensity of the smaller QDs gradually decreased in the kidney with time, which suggests renal removal of nanoparticles. In addition to size, surface coating is another important factor affecting the particle excretion. Fischer et al. injected CdSe/ZnS QDs having different coatings such as MPA, lysine, or bovine serum albumin (BSA) and found different distributions based on the coatings. They reported that MPA-coated QDs are taken up more by the lung and kidney compared to the BSA-coated QDs.48
In our in vivo experiments, we used MPA-linked MFZS NCs with a hydrodynamic diameter (HD) of 20.6 nm. In the light of the literature, we can attribute the renal clearance of the NCs to the MPA ligands together with their smaller size. Moreover, intravenous injection49 may possibly trigger the fast renal excretion of MFZS NCs from the rat within 24 h. However, to investigate the distribution of the NCs to the other tissues such as liver, lung, and spleen, more detailed biodistribution study is required, which may help to understand the clearance mechanism of MFZS NCs in detail.
These results confirm that MFZS NCs are potential contrast agents for MRI, owing to their designed architecture resulting in contrast enhancement in both T1- and T2-weighted imaging. Moreover, these NCs possess high PL QY∼ 30% in addition to their T1- and T2-weighted MRI capabilities, which in turn provide detailed information for accurate clinical diagnosis.
4. CONCLUSION
In summary, we have demonstrated that fluorescent MFZS tetrapod NCs can simultaneously enhance contrast in both T1 -and T2-weighted MR images. They exhibit high QY (∼30% in water) for FI and r1and r2relaxivities values of∼2.2 and ∼47.5 mM−1 s−1 for MRI. Magnetic characterization reveals the simultaneous presence of superparamagnetic and paramagnetic phases in these NCs that triggers simultaneous T1 and T2 contrast enhancement. These NCs possess small hydrodynamic diameter (∼20 nm) and are excreted from the body within 24 h following the injection. Thus, these NCs possess potential for accurate clinical diagnosis using dual mode (T1- and T2 -weighted) MR imaging, with additional fluorescence imaging capabilities.
■
ASSOCIATED CONTENT*
S Supporting InformationThe Supporting Information is available free of charge on the ACS Publications websiteat DOI:10.1021/acsami.6b02407.
Details on the synthesis of Mn−Fe heterodoped tetrapod nanocrystals; SAED pattern of Mn-doped ZnSe NCs before and after Fe doping; PL spectra of MZS heterodoped tetrapod NCs with Fe doping; hydro-dynamic diameter of MFZS heterodoped tetrapod NCs obtained by DLS measurements; Abs and PL spectra comparision of MFZS heterodoped tetrapod NCs in toluene and water; fluorescence image of a drop-cast MFZS NCs on a quartz substrate (PDF)
■
AUTHOR INFORMATIONCorresponding Author
*E-mail:[email protected](H.V.D.). Notes
The authors declare no competingfinancial interest.
■
ACKNOWLEDGMENTSThe authors thank the EU-FP7 Nanophotonics4Energy NoE, TUBITAK EEEAG 109E002, 109E004, 110E010, 110E217,
NRF-RF-2009-09, NRF-CRP-6-2010-02, and A*STAR of
Singapore forfinancial support. H.V.D. acknowledges support from ESF-EURYI and TUBA-GEBIP.
■
REFERENCES(1) Jing, L.; Ding, K.; Kershaw, S. V.; Kempson, I. M.; Rogach, A. L.; Gao, M. Magnetically Engineered Semiconductor Quantum Dots as Multimodal Imaging Probes. Adv. Mater. 2014, 26 (37), 6367−6386. (2) Lee, D.-E.; Koo, H.; Sun, I.-C.; Ryu, J. H.; Kim, K.; Kwon, I. C. Multifunctional Nanoparticles for Multimodal Imaging and Therag-nosis. Chem. Soc. Rev. 2012, 41 (7), 2656.
(3) Na, H. B.; Song, I. C.; Hyeon, T. Inorganic Nanoparticles for MRI Contrast Agents. Adv. Mater. 2009, 21 (21), 2133−2148.
(4) Yu, J. H.; Kwon, S.-H.; Petrášek, Z.; Park, O. K.; Jun, S. W.; Shin, K.; Choi, M.; Park, Y. I.; Park, K.; Na, H. B.; Lee, N.; Lee, D. W.; Kim, J. H.; Schwille, P.; Hyeon, T. High-Resolution Three-Photon Biomedical Imaging Using Doped ZnS Nanocrystals. Nat. Mater. 2013, 12 (4), 359−366.
(5) Kim, J. Y.; Voznyy, O.; Zhitomirsky, D.; Sargent, E. H. 25th Anniversary Article: Colloidal Quantum Dot Materials and Devices: A Quarter-Century of Advances. Adv. Mater. 2013, 25 (36), 4986−5010. (6) Corot, C.; Warlin, D. Superparamagnetic Iron Oxide Nano-particles for MRI: Contrast Media Pharmaceutical Company R&D Perspective. WIREs Nanomed. Nanobiotechnol. 2013, 5 (5), 411−422. (7) Caravan, P.; Ellison, J. J.; McMurry, T. J.; Lauffer, R. B. Gadolinium(III) Chelates as MRI Contrast Agents: Structure, Dynamics, and Applications. Chem. Rev. 1999, 99 (9), 2293−2352.
(8) Pan, D.; Schmieder, A. H.; Wickline, S. A.; Lanza, G. M. Manganese-Based MRI Contrast Agents: Past, Present, and Future. Tetrahedron 2011, 67 (44), 8431−8444.
(9) Guo, W.; Yang, W.; Wang, Y.; Sun, X.; Liu, Z.; Zhang, B.; Chang, J.; Chen, X. Color-Tunable Gd-Zn-Cu-In-S/ZnS Quantum Dots for Dual Modality Magnetic Resonance and Fluorescence Imaging. Nano Res. 2014, 7 (11), 1581−1591.
(10) Lawaczeck, R.; Menzel, M.; Pietsch, H. Superparamagnetic Iron Oxide Particles: Contrast Media for Magnetic Resonance Imaging. Appl. Organomet. Chem. 2004, 18 (10), 506−513.
(11) Schlaudecker, J. D.; Bernheisel, C. R. Gadolinium-Associated Nephrogenic Systemic Fibrosis. Am. Fam. Physician 2009, 80, 711− 714.
(12) Wang, S.; Jarrett, B. R.; Kauzlarich, S. M.; Louie, A. Y. Core/ shell Quantum Dots with High Relaxivity and Photoluminescence for Multimodality Imaging. J. Am. Chem. Soc. 2007, 129 (13), 3848−3856. (13) Gaceur, M.; Giraud, M.; Hemadi, M.; Nowak, S.; Menguy, N.; Quisefit, J. P.; David, K.; Jahanbin, T.; Benderbous, S.; Boissière, M.; Ammar, S. Polyol-Synthesized Zn0.9Mn0.1S Nanoparticles as Potential Luminescent and Magnetic Bimodal Imaging Probes: Synthesis, Characterization, and Toxicity Study. J. Nanopart. Res. 2012, 14 (7), 932.
(14) Ding, K.; Jing, L.; Liu, C.; Hou, Y.; Gao, M. Magnetically Engineered Cd-Free Quantum Dots as Dual-Modality Probes for Fluorescence/magnetic Resonance Imaging of Tumors. Biomaterials 2014, 35 (5), 1608−1617.
(15) Sharma, V. K.; Gokyar, S.; Kelestemur, Y.; Erdem, T.; Unal, E.; Demir, H. V. Manganese Doped Fluorescent Paramagnetic Nano-crystals for Dual-Modal Imaging. Small 2014, 10 (23), 4961−4966.
(16) Choi, D.; Han, A.; Park, J. P.; Kim, J. K.; Lee, J. H.; Kim, T. H.; Kim, S.-W. Fabrication of MnxFe1−xO Colloidal Solid Solution as a Dual Magnetic-Resonance-Contrast Agent. Small 2009, 5 (5), 571− 573.
(17) Chen, W.; Lu, F.; Chen, C.-C. V; Mo, K.-C.; Hung, Y.; Guo, Z.-X.; Lin, C.-H.; Lin, M.-H.; Lin, Y.-H.; Chang, C.; Mou, C.-Y. Manganese-Enhanced MRI of Rat Brain Based on Slow Cerebral Delivery of manganese(II) with Silica-Encapsulated MnxFe1−xO Nanoparticles. NMR Biomed. 2013, 26 (9), 1176−1185.
(18) Wang, L.; Wu, Q.; Tang, S.; Zeng, J.; Qiao, R.; Zhao, P.; Zhang, Y.; Hu, F.; Gao, M. Ultrasmall PEGylated MnxFe3−xO4 (X = 0−0.34) Nanoparticles: Effects of Mn(ii) Doping on T1- and T2-Weighted Magnetic Resonance Imaging. RSC Adv. 2013, 3, 23454−23460.
(19) Huang, G.; Li, H.; Chen, J.; Zhao, Z.; Yang, L.; Chi, X.; Chen, Z.; Wang, X.; Gao, J. Tunable T1 and T2 Contrast Abilities of Manganese-Engineered Iron Oxide Nanoparticles through Size Control. Nanoscale 2014, 6, 10404−10412.
(20) Wang, Z.; Liu, J.; Li, T.; Liu, J.; Wang, B. Controlled Synthesis of MnFe2O4 Nanoparticles and Gd Complex-Based Nanocomposites as Tunable and Enhanced T1/T2-Weighted MRI Contrast Agents. J. Mater. Chem. B 2014, 2 (Dcc), 4748.
(21) Choi, J.-S.; Lee, J.-H.; Shin, T.-H.; Song, H.-T.; Kim, E. Y.; Cheon, J. Self-confirming “AND” logic Nanoparticles for Fault-Free MRI. J. Am. Chem. Soc. 2010, 132 (32), 11015−11017.
(22) Shin, T.-H.; Choi, J.; Yun, S.; Kim, I.-S.; Song, H.-T.; Kim, Y.; Park, K. I.; Cheon, J. T1 and T2 Dual-Mode MRI Contrast Agent for Enhancing Accuracy by Engineered Nanomaterials. ACS Nano 2014, 8 (4), 3393−3401.
(23) Cheng, K.; Yang, M.; Zhang, R.; Qin, C.; Su, X.; Cheng, Z. Hybrid Nanotrimers for Dual T1 and T2-Weighted Magnetic Resonance Imaging. ACS Nano 2014, 8 (10), 9884−9896.
(24) Bae, K. H.; Kim, Y. B.; Lee, Y.; Hwang, J.; Park, H.; Park, T. G. Bioinspired Synthesis and Characterization of Gadolinium-Labeled Magnetite Nanoparticles for Dual Contrast T(1)- and T(2)-Weighted Magnetic Resonance Imaging. Bioconjugate Chem. 2010, 21, 505−512. (25) Sharma, V. K.; Guzelturk, B.; Erdem, T.; Kelestemur, Y.; Demir, H. V. Tunable White-Light-Emitting Mn-Doped ZnSe Nanocrystals. ACS Appl. Mater. Interfaces 2014, 6 (5), 3654−3660.
(26) Wu, Y. A.; Warner, J. H. Shape and Property Control of Mn Doped ZnSe Quantum Dots: From Branched to Spherical. J. Mater. Chem. 2012, 22 (2), 417.
(27) Viswanatha, R.; Battaglia, D. M.; Curtis, M. E.; Mishima, T. D.; Johnson, M. B.; Peng, X. Shape Control of Doped Semiconductor Nanocrystals (D-Dots). Nano Res. 2008, 1 (2), 138−144.
(28) Manna, L.; Milliron, D. J.; Meisel, A.; Scher, E. C.; Alivisatos, A. P. Controlled Growth of Tetrapod-Branched Inorganic Nanocrystals. Nat. Mater. 2003, 2 (6), 382−385.
(29) Gan, C.; Zhang, Y.; Battaglia, D.; Peng, X.; Xiao, M. Fluorescence Lifetime of Mn-Doped ZnSe Quantum Dots with Size Dependence. Appl. Phys. Lett. 2008, 92 (24), 241111.
(30) Borse, P. H.; Deshmukh, N.; Shinde, R. F.; Date, S. K.; Kulkarni, S. K. Luminescence Quenching in ZnS Nanoparticles due to Fe and Ni Doping. J. Mater. Sci. 1999, 34 (24), 6087−6093.
(31) Cao, J.; Fan, L.; Yang, J.; Yan, Y.; Wei, M.; Yang, L.; Feng, B.; Han, D.; Wang, B.; Fu, H. The Effect of the Concentration of the Mn2+ Ions on the Optical and Magnetic Properties of the ZnS:Fe2+(1%) Nanowires. Superlattices Microstruct. 2013, 57, 58−65. (32) Eryong, N.; Donglai, L.; Yunsen, Z.; Xue, B.; Liang, Y.; Yong, J.; Zhifeng, J.; Xiaosong, S. Photoluminescence and Magnetic Properties of Fe-Doped ZnS Nano-Particles Synthesized by Chemical Co-Precipitation. Appl. Surf. Sci. 2011, 257 (21), 8762−8766.
(33) Cao, J.; Han, D.; Wang, B.; Fan, L.; Fu, H.; Wei, M.; Feng, B.; Liu, X.; Yang, J. Low Temperature Synthesis, Photoluminescence, Magnetic Properties of the Transition Metal Doped Wurtzite ZnS Nanowires. J. Solid State Chem. 2013, 200, 317−322.
(34) Kang, T.; Sung, J.; Shim, W.; Moon, H.; Cho, J.; Jo, Y.; Lee, W.; Kim, B. Synthesis and Magnetic Properties of Single-Crystalline Mn/ Fe-Doped and Co-Doped ZnS. J. Phys. Chem. C 2009, 113, 5352− 5357.
(35) Yang, L.; Zhu, J.; Xiao, D. Microemulsion-Mediated Hydro-thermal Synthesis of ZnSe and Fe-Doped ZnSe Quantum Dots with Different Luminescence Characteristics. RSC Adv. 2012, 2 (21), 8179. (36) Godlewski, M.; Skowroński, M. Effective Deactivation of the ZnS Visible Photoluminescence by Iron Impurities. Phys. Rev. B: Condens. Matter Mater. Phys. 1985, 32 (6), 4007−4013.
(37) Pan, D.; Wang, Q.; Pang, J.; Jiang, S.; Ji, X.; An, L. Semiconductor “Nano-Onions” with Multifold Alternating CdS/ CdSe or CdSe/CdS Structure. Chem. Mater. 2006, 18 (18), 4253− 4258.
(38) Zhou, Z.; Huang, D.; Bao, J.; Chen, Q.; Liu, G.; Chen, Z.; Chen, X.; Gao, J. A Synergistically Enhanced T(1) -T(2) Dual-Modal Contrast Agent. Adv. Mater. 2012, 24 (46), 6223−6228.
(39) Sharma, V. K.; Alipour, a.; Soran-Erdem, Z.; Aykut, Z. G.; Demir, H. V. Highly Monodisperse Low-Magnetization Magnetite Nanocubes as Simultaneous T 1 − T 2 MRI Contrast Agents. Nanoscale 2015, 7 (23), 10519−10526.
(40) Gultekin, D. H.; Raidy, T. E.; Gore, J. C. Effects of Radiation on the NMR Relaxation Effects of Aqueous Solutions of Gadolinium Contrast Agents. Contrast Media Mol. Imaging 2009, 4 (1), 33−36.
(41) Wang, Y.-X. J. Superparamagnetic Iron Oxide Based MRI Contrast Agents: Current Status of Clinical Application. Quant. Imaging Med. Surg. 2011, 1 (1), 35−40.
(42) Jain, T. K.; Reddy, M. K.; Morales, M. A.; Leslie-Pelecky, D. L.; Labhasetwar, V. Biodistribution, Clearance and Biocompatibility of Iron Oxide Magnetic Nanoparticles in Rats. Mol. Pharmaceutics 2008, 5 (2), 316−327.
(43) Fitzpatrick, J. A. J.; Andreko, S. K.; Ernst, L. A.; Waggoner, A. S.; Ballou, B.; Bruchez, M. P. Long-Term Persistence and Spectral Blue Shifting of Quantum Dots in Vivo. Nano Lett. 2009, 9 (7), 2736− 2741.
(44) Ye, L.; Yong, K.; Liu, L.; Roy, I.; Hu, R.; Zhu, J.; Cai, H.; Law, W.; Liu, J.; Wang, K.; Liu, J.; Liu, Y.; Hu, Y.; Zhang, X.; Swihart, M. T.; Prasad, P. N. A Pilot Study in Non-Human Primates Shows No Adverse Response to Intravenous Injection of Quantum Dots. Nat. Nanotechnol. 2012, 7 (7), 453−458.
(45) Oh, E.; Liu, R.; Nel, A.; Gemill, K. B.; Bilal, M.; Cohen, Y.; Medintz, I. L. Meta-Analysis of Cellular Toxicity for Cadmium Containing Quantum Dots. Nat. Nanotechnol. 2016, 11, 479−486.
(46) Hauck, T. S.; Anderson, R. E.; Fischer, H. C.; Newbigging, S.; Chan, W. C. W. In Vivo Quantum-Dot Toxicity Assessment. Small 2010, 6 (1), 138−144.
(47) Gao, J.; Chen, K.; Xie, R.; Xie, J.; Lee, S.; Cheng, Z.; Peng, X.; Chen, X. Ultrasmall near-Infrared Non-Cadmium Quantum Dots for in Vivo Tumor Imaging. Small 2010, 6 (2), 256−261.
(48) Fischer, I.; Kaeser, A.; Peters-Gumbs, M. a M.; Schenning, A. P. H. J. Fluorescentπ-Conjugated Polymer Dots versus Self-Assembled Small-Molecule Nanoparticles: What’s the Difference? Chem. - Eur. J. 2013, 19, 10928−10934.
(49) He, X.; Nie, H.; Wang, K.; Tan, W.; Wu, X.; Zhang, P. In Vivo Study of Biodistribution and Urinary Excretion of Surface-Modified Silica Nanoparticles. Anal. Chem. 2008, 80 (24), 9597−9603.