Received: November 14, 2016 Revision received: March 3, 2017 Accepted: April 26, 2017 OnlineFirst: August 20, 2017
Copyright © 2017 EDAM www.estp.com.tr DOI 10.12738/estp.2017.5.0577 October 2017 17(5) 1675–1698
Research Article
Bahar Berberoğlu1
Anadolu University Rabia Ece Omay
2
Cafer Necat Berberoğlu3
Anadolu University Çağlar Karaduman
4
Anadolu University
Abstract
Provinces that vary by socioeconomic levels in Turkey are among the main starting points of planned development. Meanwhile, one of the most important indicators considered in determining differences in development is education. Anadolu University clearly has a very important place in Turkey’s higher education system with its Open and Distance Education System. Therefore, we aim in our study to investigate how socioeconomic development affects provincial demand for an open education system. First, we perform analyses over 81 provinces. However, we thought the demand in Istanbul, Ankara, and Izmir to have a special place and excluded them to perform analyses over the remaining 78 provinces using the developmental index of 2012. We evaluated 48 different regression models statistically and, using four different regression techniques, created these models by dividing them into four classes: linear, nonparametric, generalized linear, and generalized nonparametric. The relations in the models between education and development are examined not only as a parametric and linear relationship but also as a nonparametric and nonlinear relationship. We found a positive, nonparametric, and nonlinear relationship for the demand for the Open and Distance Education System with the provincial socioeconomic developmental levels.
Keywords
Socioeconomic development • Open and Distance Education System • Linear regression model • Nonparametric regression model • Generalized regression model • Generalized nonparametric regression model
The Effects of Turkey’s Level of Socioeconomic
Development on the Open Education System
** This study is only a part of the project 1505E446 supported by Anadolu University Scientific Research Project, which was carried out and conducted by Assoc. Dr. Bahar Berberoğlu.
1 Correspondence to: Bahar Berberoğlu, Faculty of Open Education, Anadolu University, Yunusemre Campus, Eskişehir Turkey. Email: [email protected]
2 Independent Researcher. İstanbul Turkey. Email: [email protected]
3 Faculty of Economics and Administrative Sciences, Anadolu Universty, Yunusemre Campus, Eskişehir Turkey. Email: [email protected]
4 Faculty of Economics, Anadolu Universty, Yunusemre Campus, Eskişehir Turkey. Email: [email protected]
Citation: Berberoğlu, B., Omay, R. E., Berberoğlu, C. N., & Karaduman, Ç. (2017). The effects of Turkey’s level of
socioeconomic development on the open education system. Educational Sciences: Theory & Practice, 17, 1675–1698.
University education can be regarded as a steppingstone of lifelong education. Lifelong education can be defined as the method of fulfilling the very prevalent educational needs of society in such a way that everyone can learn, fill in missing knowledge, update information, and change branches or level of education regardless of age or background (Janne, 1973). Fulfilling this widespread need and lifelong education of large masses can only be possible through open and distance education because these days information can be easily accessed by individuals through the rapid advancements in information and communication technologies and the developments in open and distance education. The more advanced the technology is in a country, the more varied and geographically mobile the active population is (Janne, 1973). Variations and mobility in the active population can certainly prevent interruptions or breaks from occurring in the lifelong education process of individuals when open and distance education is used.
King (1966) considered universities as a potential function supporting regional economic and social development. Universities established in developing countries should develop their economic and labor plans in parallel; consider the country’s social expectations through local and regional cultures; and lean towards the local, political, and social developmental needs of the country under the impact of such elements as history, raw materials, and commercial opportunities (Kavak, 1990).
Forming intellectual capital, creating advanced technology, developing information-containing products, and creating an educated labor force are only possible through investments in education and social infrastructure. Only in this way can a country achieve the position it deserves in the global economy. Developing countries such as Turkey can create new areas of employment and production and achieve their sustainable developmental economic targets with these investments (Urfalıoğlu & Seyfullahoğulları, 2004). In this context, governmental investments in education and technological infrastructure development greater affect development by creating positive effects on accumulating human capital (Kibritçioğlu, 1998).
Education leads the main factors that affect human capital accumulation. Investments made in education increase the efficiency of the labor force and ensure significant externalities for sustainable growth (Bekmez, Köne, & Günal, 2009). The relationships among education, society, and development constantly interact with each other and are subjects that should be addressed multi-dimensionally. Education contributes to development sociologically, reduces the differences among social classes, and ensures social mobility and social integration (Kurtkan, 1977).
Addressing the socioeconomic variations among provinces is also among the main starting points of planned development in Turkey. Certain imbalances occur in the country because socioeconomic development occurs at different paces. These imbalances result from variations in many parameters, such as the effectiveness or
prevalence of a population, industry, agriculture, income distribution, monetary/ financial sector, infrastructure, geographical location, public and private investments, transportation, construction and housing, education, and health services. Turkish provinces can be balanced in their development by conducting field research and interpreting the results well, thus applying successful socioeconomic policies as a consequence (Albayrak, 2005).
Our study is one of these field studies; it extends from city to countryside in all 81 provinces of Turkey and covers Anadolu University’s Open and Distance Education System (ODES), which we will investigate in our study (Anadolu Üniversitesi, n.d.). In the study, we focus on the effect of socioeconomic factors on education in general. Specifically, we examine the demand for Anadolu University’s ODES as of 2012 by developing provincial indices. We use the linear (LM), nonparametric (NPM), generalized linear (GLM), and generalized nonparametric (GNPM) regression models for methodologies. The definitions of the indices in question and the data from these indices have been obtained from Gül and Çevik’s (2014) study. In addition to being a proportional measurement, the indices also allow for making comparisons by location.
Identifying socioeconomic tendencies in a country and the appropriateness of the decisions to be made in this respect are only possible with correct, reliable, and readily accessible statistical information. Indices are important statistical tools for creating the information in question. Indices can generally vary by the study’s aim, variables, and variable type and number. In our study, all variables are expressed proportionally by making normalizations.
Berberoğlu, Berberoğlu, Omay, and Karaduman’s (2016) study determined through cluster analyses based on the Open Education Faculty’s offices at Anadolu University that particularly the offices in Istanbul, Ankara, and Izmir were in the top clusters for offices responding to the greatest student demands in 2012, 2013, and 2014. When making calculations based on provinces rather than offices, this study observed that Istanbul, Ankara, and Izmir especially form one cluster alone and these three provinces have been excluded from the analysis with the idea that a cluster constituting a single element cannot be correct according to k-means clustering (Berberoğlu et al., 2016).
The main aim of this study is to evaluate the relative differences among provincial developmental levels in the context of demand for open education, as well as to analyze how a province’s socioeconomic status affects the demand for open education. The obtained results can serve the aims of balanced and sustainable socio-economic development and provide a basis for the development of new policies on open education.
We conducted our study by first creating the LM, NPM, GLM and GNPM for the 81 provinces. We next continued our study by excluding Istanbul, Ankara, and Izmir from our sample because their values showed an extreme difference from the overall country when compared to the other provinces. In particular, nonlinearity (curvilinearity) was observed more clearly on the graphs based on data from these three provinces. Thus, we wanted to have our analysis based on the other provinces. The situation encountered when repeating the same analyses in the context of 78 provinces was of specific importance for us. Hence, we conducted our statistical analyses by creating 48 models in total: 24 models for the 81 provinces and 24 models for the 78 provinces. While we achieved statistically significant results in the created models, our true main focal point is the search for the best model. As a result of all the analyses, a nonparametric and nonlinear (curvilinear) relationship was determined within the scope of searching for the best model both for the 81 and the 78 provinces. However, upon evaluating all 48 of the models in accordance with deviations, Akaike information criteria (AIC), and the R2 coefficient of determination, the best model
group was found to statistically be the NPM for all 81 provinces.
The Importance of Open Education and Socioeconomic Development
The needs of a society depend on its socioeconomic status and are a part of its values system. Needs vary from society to society. Furthermore, needs change as the socioeconomic status and values of a society change. Education is one of these needs.
Education is a significant factor in growing the qualified workforce required for fulfilling socioeconomic needs, transmitting knowledge and skills suited to the demand structure that changes according to developmental targets, using resources more rationally and efficiently, making sounder political selections, realizing good governance, and forming a population prepared for healthy and qualified employment. Creating extra resources in addition to allocating more resources for education affects development positively. When providing educational services, developmental effects are observed to decrease imbalance in the economic, social, and geographical distribution; eliminate gender-based discrimination; and adapt sectorial distribution in employment to the structure of and change in production (Özyakışır, 2011). When detailing the subject of education, school education, in-service training, lifelong learning, learning through certificate programs, learning by doing, and learning by observation and social interaction can be listed (Berberoğlu, 2010a).
Human capital is used to indicate all concepts such as the knowledge, skills, abilities, level of education, health status, and social relations that an individual or society has and constitutes the cornerstone of economic development (Kar & Ağır, 2003). For example, flexibility in adapting to changes in business life increases as literacy rates and length of education increase in a society. Therefore, such human
capital investments are a gain for society because the future benefits exceed the cost. As lifelong learning is one factor that increases the length of education, institutions that provide lifelong education to society positively contribute to increasing the flexibility of adapting human capital (Berberoğlu, 2010a).
The demand for higher education is among the problems of higher education in Turkey (Erk, 1989; Korkut, 2001; Lewis & Dundar, 1999; Maxwell, 1987; Şimşek, 1999; Uzun, Özel, & Yalçın, 1990). Anadolu University’s ODES clearly takes an important place in meeting this demand.
Developing countries focus on such subjects as higher education demands, technological automation, and management skills, particularly for the workforce, because low labor costs are insufficient at attracting investments. Countries with a strong potential for human capital provide an advantage when attracting capital because they have an educated population (Bloe, 2004). Therefore, developing countries lean towards open and distance education because it is a way to provide education to more people at lower cost (Berberoğlu, 2010b).
The problems in considering the quality and sufficiency of manpower force developing countries to make human capital investments. While the micro effects of human capital investments are observed in areas such as the individual, family, and company, their macro effects should also not be disregarded. For example, while the increase in personal income as a result of education investments may have an effect on the family and company, its expansion affects variations in income distribution, technological development, labor markets, agricultural and industrial sectors, efficiency, and regional development at different rates (Özyakışır, 2011; Yumuşak & Bilen, 2000).
Factors that affect provinces’ socioeconomic levels can generally be gathered under three main categories: social, economic, and geographic (Albayrak, 2005). However, our study uses the index values calculated by Gül and Çevik (2014) as economic and social indicators. The 32 economic variables used when creating the indices of provinces’ developmental levels are as follows: population, net migration, assigned tax revenues, investment incentives, number of companies in the ISO1000, number of companies in the Export1000, electricity consumption, number of trucks, number of tractors, exports, imports, total number of companies opened, savings deposits, number of bank branches, cash loans, follow-up receivables percentage, non-cash loans, number of ATMs, number of POSs, number of merchants, number of interactive banking customers, plant production, animal production, tourism, population density, population development, percentage of the population under 15, number of automobiles per thousand people, labor force participation rate, unemployment rate, public investments, and number of enterprises. The 17 social variables used when creating indices for provinces’ developmental levels are as
follows: air pollution, home-ownership rate, number of doctors, number of hospitals, number of beds, infant mortality, number of moviegoers, housing sales, total number of arrivals and departures, number of passengers, cargo carried, innovativeness, number of graduate students, number of faculty members, number of high-speed Internet subscribers, number of fixed lines, and number of mobile phones.
While indices express proportional changes, they sometimes constitute a single variable or group of variables, just as in this study. Upon examining the data structure in social sciences and the economy in general, one can observe that the relationships are sometimes one-way and sometimes two-way (mutual) interactions. The socioeconomic structure of a province cannot be considered separate from the behaviors of the people living in that province. One factor alone cannot be changed while keeping all the other factors constant when examining the economic behaviors of people. In real life, all variables change constantly and simultaneously. Sometimes, observing the direct effect of a variable is not possible. However, indirect effects can be responsible. Using index data is appropriate in such cases.
Comprehending the direct relationship of all data at first sight from the above index through the variable of education may not be possible. For human behavior is rather fickle and is based on many factors. For example, while keeping prices, preferences, and all other factors constant, changing only the income is not possible because all these change as a result of a change in income. Hence, indices that gather more than one variable as a single numerical value can be used in socioeconomic studies.
Can (2004) found that distance learning students come from the lower class of society, have a wide age and geographic distribution, and have high levels of motivation and different educational backgrounds (Can, 2004). Erarı’s (2002) study on Denizli province determined that both Anadolu University ODES students and their families generally have middle- and low-income levels (Erarı, 2002).
Berberoğlu (2010b) investigated the effect of Turkey’s economic performance on the number of graduates from Anadolu University’s distance learning faculties. Gross domestic product and rate of enrollment in higher education were used as the criteria for economic performance. The economic performance was determined to positively correlate with the number of graduates between 1998 and 2008. Decreases in the number of graduates, especially during periods of economic crises, are noteworthy (Berberoğlu, 2010b). In general, distance learning students have middle- and low-income levels and are severely affected by Turkey’s economic status. However, the most important aim in establishing the Open Education Faculty at Anadolu University is to create an opportunity for individuals who want to receive higher education but do not have the opportunity due to various societal reasons. Therefore, the faculty from the day of its establishment up to the present has adopted the principle of expanding
itself to all segments of society and taking open education services to all provinces without discrimination. One important target of Anadolu University’s ODES is to create equal opportunity in higher education through open and distance education, thereby contributing to ensuring gender equality in society. Nowadays in Turkey, each province has a state university or faculty. However, establishing the Open Education Faculty at Anadolu University, which responds to the many demands of students in many provinces, dates back to approximately 35 years ago (Anadolu Üniversitesi, n.d.). When the Open Education Faculty was established, it started off with a motif that quite clearly emphasized both its aims and the point it desired to achieve. This motif was to take the flag of Anadolu University and with it the opportunity for higher education to all cities in Turkey (Berberoğlu, 2015). Therefore, the wish of Anadolu University’s Open Education Faculty to spread out and reach large masses is noted.
Our study takes the 2012 data for the ODES into consideration in parallel with the indices. The independent and dependent variables that were included are presented in Table 1.
Data on the dependent variables, addressed in Table 1, have been provided to the researchers with special permission from the ODES Management of Anadolu University. The six dependent variables express the demand for Anadolu University’s
Table 1
The Variables and Their Definitions
Variables Definitions Explanations
y1 (Dependent
variable) New enroll-ments The normalization value (proportion) of the number of students that enroll in Anadolu University’s ODES for the first time y2 (Dependent
variable) Additional placement
The normalization value of the number of students admitted to depart-ments where the quota has not been filled and which remain unfilled as no final registration is made, thus filling the quota, and to newly estab-lished departments at Anadolu University’s ODES.
y3 (Dependent
variable) Vertical trans-fer
The normalization value of the number of students who enroll within the scope of “Vertical Transfer” in order for graduates from associate degree programs of Higher Education Vocational Schools and ODES to continue their bachelor’s degree programs at Anadolu U’s ODES.
y4 (Dependent
variable) License com-pletion
The normalization value of the number of students enrolled in the 5th se-mester of the license departments at ODES within the scope of “License Completion” without exams to complete a license; the students who have associates degrees by completing all courses in the first, second, third, and fourth semesters of a 4-year higher education school or faculty and then dropped out.
y5 (Dependent
variable) Second univer-sity
The normalization value of the number of students enrolled in associates and bachelor’s degree programs at Anadolu University’s ODES within the scope of “Second University” without taking an entrance exam. y6 (Dependent
variable) Enrollment renewal The normalization value of the number of students who continue to Anadolu University’s ODES and renew their enrollment. x (Independent
variable)
Provincial Developmental
Index
Index values of 81 provinces calculated (using the normalization formu-la) by Gül & Çevik (2014) through economic and social indicators. Note. All data in Table 1 are values transformed into proportional data using the normalization formula.
ODES, and as such recognize students’ ability to enroll in ODES in six different ways. The independent variable is the provincial socioeconomic developmental index. This study investigates the different regression models and the relations among the variables.
The relationships among each dependent variable and the independent variable in Table 1 have been investigated using 24 models in total: six LMs, six NPMs, six GLMs, and six GNPMs. A total of 48 models were formed, 24 for the 81 provinces and then repeated for the 78 provinces that excludes Ankara, Istanbul, and Izmir. Methodology and Implementation of the Analysis
When investigating the relations among the variables, four different regression models (LM, NPM, GLM, and GNPM) were addressed. The models in question are included in Equations 1, 2, 3, and 4 through their main mathematical formats. They will be examined and interpreted under the headings that follow.
LM: yi = a + x′iβ + ɛi 1
NPM: yi = f (xi) + ɛi 2
GLM: ni = a + x′iβ + ɛi 3
GNPM: ni = f (xi) + ɛi 4
In Equations 1 and 3, a is the constant term, yi(i = 1, 2, ..., n)) is the dependent
variable, is the independent variable, and is the vector of slope parameters. In Equations 2 and 4, f (xi) is a smooth continuous unknown function with its first and
second order derivatives in the [a, b] part. While different options are possible with this function, the natural cubic spline that minimizes the sum of penalty-square errors has been used in this study (Green & Silverman, 1994; Hastie & Tibshirani, 1999; Wood, 2000; Wood & Augustin, 2002). In Equations 3 and 4, ηi signifies the linear
estimator. The link function for a model with a dependent variable showing binomial distribution is the link logit. In all four models, ɛi are the random variables with the
same independent normal distribution, a mean of 0, and a variance of σ2.
While constructing the models, variables related to the ODES demand were assessed by Gül and Çevik (2014) as a percentage using x100 in the normalization of the indices. The generally signifies the lowest value of the variable in question while the is the highest value of the variable in question. Therefore, all data in our study (i.e., ODES data signifying the y dependent variable and the socioeconomic index data signifying the x independent variable) were transformed
into a proportionate data structure with the normalization formula . In this normalization formula, the denominator shows the range of the variable in question by adding the lowest and highest values of the series to the calculation process. Therefore, the expressions used in the normalization formula are as follows:
• x = the actual value of the province where the index will be derived. Referred to as ige in the Figures.
• xmin = the lowest value in the series. • xmax = the highest value in the series
This study aims to use the normalization formula in particular to approach the condition of normality and thus reduce the effects of outliers or extreme values because the techniques used are within the scope of the least squares (LS) family (regular LS, penalty LS, iteratively reweighted LS). In the regression analysis, extreme values increased the residuals sum of squares (RSS) and consequently the 2 value. The f, t,
and R2 statistical values are also very sensitive towards these outliers (Draper & Smith, 1998). However, outliers can be encountered in the study despite normalization.
Table 2 Linear Models (LM) β0 β1 adj. R2 f x-y1 Coefficients (SE) (0.3079)5.6273 (0.0656)2.5497 0.9497 p < 2.2e1510-16 t-value
p-value < 2.2e18.27-16 < 2.2e38.86-16
x-y2
Coefficients
(SE) (0.3683)6.2482 (0.0785)2.5330 0.9286 1042
p < 2.2e-16
t-value
p-value < 2.2e16.96-16 < 2.2e32.28-16
x-y3
Coefficients
(SE) (0.2879)51814 (0.0613)2.4534
0.9524 p < 2.2e1600-16
t-value
p-value < 2.2e18-16 < 2.2e40-16
x-y4
Coefficients
(SE) (0.7090)6.5126 (0.1511)2.9426 0.8255 379.4
p < 2.2e-16
t-value
p-value < 4.23e9.185-14 < 2.2e19.479-16
x-y5
Coefficients
(SE) (0.3616)5.2992 (0.0770)2.5651 0.9326 1108
p < 2.2e-16
t-value
p-value < 2.2e14.65-16 < 2.2e33.29-16
x-y6
Coefficients
(SE) (0.2877)4.4828 (0.0613)2.4710
0.9530 p < 2.2e1624-16
t-value
In the first stage of the study, 24 models in total were constructed, six models for six variable groups in each of the four different model structures (LM, NPM, GLM, and GNPM) for the 81 provinces. All statistical analyses are carried out using R Programming. The analysis results of the LM are presented in Table 2.
Upon examining the t- and f-test values in Table 2, all the formed models and their coefficients are determined to be statistically significant. High R2 values also show
that the dependent variable can be sufficiently explained by the independent variable. According to the LM, the Turkish provincial developmental index positively affects the new enrollments, additional placements, vertical transfers, license completions, second university, and enrollment renewals in ODES. A proportional increase occurs in all the variables in question as the provincial developmental level increases.
So far, we have assessed the LM and its significance. After this stage, the NPMs, formed with R Programming in our analysis, are specified in Table 3.
Table 3
Nonparametric Models (NPM) with Regression Spline
β0 adj. R2 x-y1 Coefficient (SE) (0.2234)5.5987 df = 6.365 0.974 t- and f-values t = 25.06 f = 398.1
p-values <2e-16 <2e-16
x-y2
Coefficient
(SE) (0.2986)6.2197 df = 6.759
0.953 t- and f-values t = 20.83 f = 209.6
p-values <2e-16 <2e-16
x-y3 Coefficient(SE) (0.1891)5.1538 df = 5.462
0.979 t- and f-values t = 27.25 f = 591.4
p-values <2e-16 <2e-16
x-y4
Coefficient
(SE) (0.2075)6.4795 df = 7.594
0.985 t- and f-values t = 31.23 f = 622.3
p-values <2e-16 <2e-16
x-y5
Coefficient
(SE) (0.1887)5.2704 df = 7.179
0.982 t and F values t = 27.93 f = 525.9
p-values <2e-16 <2e-16
x-y6
Coefficient
(SE) (0.1408)4.4550 df = 7.783
0.989 t- and f-values t = 31.64 f = 819.6
p-values <2e-16 <2e-16
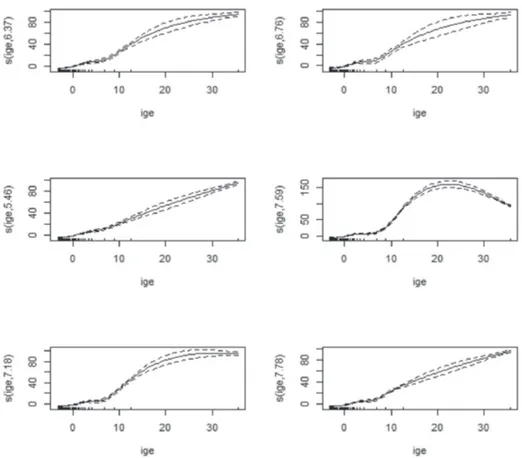
The nonparametric and nonlinear effect of the provincial developmental index in Turkey on the six variables in question is statistically significant. Upon investigating Table 3, the f values in all models show them to be statistically significant. In addition to this result, adjusted. R2 values are quite high. For each model, the df (estimated
degrees-of-freedom) values support the nonparametric and nonlinear effect of the variables. This result is shown visually in Figure 1.
In Figure 1, the tendency to reverse form as a rise and then a fall is prominent in the variables of license completion (df = 7.59) and second university (df = 7.18) as a continuation of learning. Ankara province is where public institutions and organizations are concentrated. Therefore, people may not make an effort to develop themselves when they get jobs like this. Izmir and Istanbul are port cities and well-developed in terms of industry. Having experience and professionalism, especially in business life, are at the forefront in these provinces. Furthermore, these three provinces have more than one university and department of open and distance education in their universities. In addition to this, private courses that can provide educational services for meeting the various demands of the business world also occur in these provinces. Therefore, maintaining the research over 78 provinces by excluding these 3 provinces from the study will add a distinctive meaning to the analyses.
Generalized models are required to reveal the estimated increases in the provincial socioeconomic developmental indices for the successfulness of the variables in
question. Therefore, GLM (see Table 4) was formed, and consequently, GNPM (see Table 5) was formed in order to investigate the nonparametric changes in the subsequent stages of the study.
Coding was performed considering the arithmetic means and GLM (Table 4), and GNPMs (Table 5) were formed using the link logit with binomial distributions in the next stage of the study.
Table 4
Generalized Linear Models (GLM)
β0 β1 AIC exp( 1) x-y1 Coefficients (SE) (0.4037)0.6788 (0.3105)1.3116 72.664 3.7121 z-values 1.682 4.224 p-values 0.0927 2.4e-05 x-y2 Coefficients (SE) (0.3243)0.0278 (0.2338)0.9099 80.661 2.4841 z-values 0.086 3.891 p-values 0.932 9.98e-05 x-y3 Coefficients (SE) (0.3909)0.4988 (0.3099)1.3158 70.555 3.7277 z-values 1.276 4.246 p-values 0.202 2.18e-05 x-y4 Coefficients (SE) (0.5296)1.1573 (0.4646)1.9869 56.399 7.2929 z-values 2.185 4.277 p-values 0.0289 1.9e-05 x-y5 Coefficients (SE) (0.4927)0.9454 (0.4354)1.8776 57.377 6.5378 z-values 1.919 4.312 p-values 0.055 1.62e-05 x-y6 Coefficients (SE) (0.5639)1.5847 (0.4381)1.8467 63.614 6.3389 z-values 2.81 4.215 p-values 0.00495 2.49e-05
Upon investigating Table 4, the z statistics for estimations were observed to yield statistically significant results.
As a result of one unit of change in the provincial developmental index using the GLM, the estimated increase in the successfulness of the variables in question were found to be 3.71, 2.48, 3.73, 7.29, 6.54, and 6.34, respectively. If these results need interpretation, one unit of increase in the provincial socioeconomic developmental level leads to an increase of:
• 3.71% in the possibility of newly enrolled students.
• 3.73% in the possibility of vertical transfer students.
• 7.29% in the possibility of students coming for license completion. • 6.54% in the possibility of students studying in a second university. • 6.34% in the possibility of students who renew enrollment.
The probability values (of these dependent values being found greater than 1 shows a positive relationship between the provincial socioeconomic developmental level and the demand for ODES. The reason for including these interpretations is that GLM also yields statistically significant results.
When the linear estimator has only one independent variable, the adapted value of the model for the special values of x ( and) becomes:
When the independent variable is xi, the logarithmic probability is (xi); when
the independent variable is xi + 1 the logarithmic probability is (xi+1). Therefore, the Table 5
Generalized Nonparametric Models (GNPM)
β0 f(x) adj. R2 x-y1 Coefficient (SE) (0.4015)0.6641 df = 1 0.421 z- and χ2-values z = 1.654 χ2 = 17.84 p-values 0.0981 2.41e-05 x-y2 Coefficient (SE) (0.3231)0.0176 df = 1 0.344 z- and χ2-values z = 0.054 χ2 = 15.14 p-values 0.957 9.99e-05 x-y3 Coefficient (SE) (1.4919)711.3 df = 4.75 0.577 z- and χ2-values z = 0.477 χ2 = 1.332 p-values 0.634 0.929 x-y4 Coefficient (SE) (0.5258)1.1350 df = 1 0.567 z- and χ2-values z = 2.159 χ2 = 18.29 p-values 0.0309 1.9e-05
x-y5 Coefficient(SE) (0.9841)1.0566 df = 1.11
0.603 z- and χ2-values z = 1.074 χ2 = 11.42
p-values 0.283 0.00129
x-y6 Coefficient(SE) (0.560)1.564 df = 1
0.518 z- and χ2-values z = 2.793 χ2 = 17.77
difference between these two adapted values is expressed with the probability ratio of exp( ). The probability ratio can be interpreted as the estimated increase in the probability of success when one unit of change occurs in the value of the estimator variable. In general, the estimated increase in the probability ratio is exp( ). for d units of change in the value of the estimator variable.
Lastly, analyses were performed using GNPM in the study. Their results are presented in Table 5.
Upon investigating Table 5, while the test statistics yielded significant results for f(x), very low R2s were observed in all the formed models. In addition to this, the df
values give results that deny the existence of a nonparametric relationship. Upon investigating the model performances, using NPM in terms of the GLM in Table 6 does not seem useful. No improvement is observed in the model performances when using GNPM instead of GLM. On the other hand, the best models to use in order to explain the relationship between the variables in question are NPM when generalized models are not required (i.e., when classifying the dependent variable is not required; see Table 6).
Table 6
Model Performances for LM, NPM, GLM and GNPM according to the 81 Provinces Deviation LM NPM GLM GNPM x-y1 x-y2 x-y3 x-y4 x-y5 x-y6 606.7713 868.0396 530.2855 3216.7190 836.7089 529.8470 297.6000 529.0983 215.9963 252.4538 209.9811 115.9606 68.6639 76.6612 66.5552 52.3990 53.3775 59.6136 68.6638 76.6612 47.2876 52.3990 53.1513 59.6135 AIC LM NPM GLM GNPM x-y1 x-y2 x-y3 x-y4 x-y5 x-y6 398.9780 427.9829 388.0643 534.0832 425.0052 387.9973 354.0042 401.4000 326.2377 343.1346 327.3839 280.4977 72.6639 80.6612 70.5552 56.3990 57.3775 63.6136 72.6639 80.6612 58.7900 56.3991 57.3685 63.6136 adj. R2 LM NPM GLM GNPM x-y1 x-y2 x-y3 x-y4 x-y5 x-y6 0.9497 0.9286 0.9524 0.8255 0.9326 0.9530 0.974 0.953 0.979 0.985 0.982 0.989 -0.421 0.344 0.577 0.567 0.567 0.518
The model performances are assessed in Table 6 in order to find which parametric and linear or nonparametric and nonlinear models better express the relationship of the developmental index for the 81 provinces with the new enrollment, additional
placement, vertical transfer, license completion, second university and reenrollment processes held at Anadolu University’s ODES.
Upon investigating the deviation values in Table 6, the deviations for NPM are quite low when compared to the deviation values for LM, and their AIC values are also extremely low alongside this. In addition, their R2 values are higher compared
to the LM although the difference is not much. The graphs of the NPMs have also displayed images that support the nonlinearity. Therefore, the use of NPMs to reveal the relations in question is statistically more significant and appropriate.
In the nonlinear models of the analyses conducted for the 81 provinces, the values for Istanbul, Ankara, and Izmir provinces can be said to have appeared as statistically extreme, causing nonlinearity in the graphs of the regression analyses. Separately assessing the other provinces would be beneficial in the context of the demand for Anadolu University’s ODES, both for the reasons mentioned in the previous sections and the reasons arising here.
The three provinces in question are very important in that they represent approximately 23 million people within the total population, as well as being among the largest provinces of Turkey. However, observing the effect of expansion for at
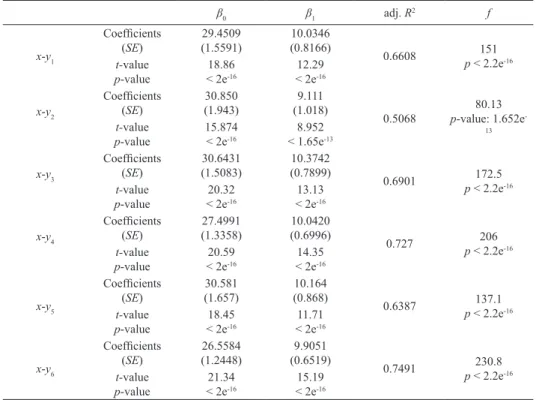
Table 8 Linear Models (LM) β0 β1 adj. R2 f x-y1 Coefficients (SE) (1.5591)29.4509 (0.8166)10.0346 0.6608 p < 2.2e151 -16 t-value p-value < 2e18.86-16 < 2e12.29-16 x-y2 Coefficients
(SE) (1.943)30.850 (1.018)9.111 0.5068 p-value: 1.652e80.13
-13 t-value p-value 15.874< 2e-16 < 1.65e8.952-13 x-y3 Coefficients (SE) (1.5083)30.6431 (0.7899)10.3742 0.6901 p < 2.2e172.5-16 t-value p-value < 2e20.32-16 < 2e13.13-16 x-y4 Coefficients (SE) (1.3358)27.4991 (0.6996)10.0420 0.727 206 p < 2.2e-16 t-value p-value < 2e20.59-16 < 2e14.35-16 x-y5 Coefficients (SE) (1.657)30.581 (0.868)10.164 0.6387 137.1 p < 2.2e-16 t-value p-value < 2e18.45-16 < 2e11.71-16 x-y6 Coefficients (SE) (1.2448)26.5584 (0.6519)9.9051 0.7491 p < 2.2e230.8-16 t-value p-value < 2e21.34-16 < 2e15.19-16
least the 78 provinces apart from these three is as important as examining all 81 provinces in order for the education services to spread out and become effective throughout Turkey, which is the main target of open education. Thus, investigating the extent that open education achieves its goals and the ways to achieve them more quickly and effectively becomes possible, as well as making inferences in this respect.
In the study, LMs were formed and examined for 78 provinces, and the statistical results are presented in Table 8.
All models and coefficients created according to the t- and f-testing values in Table 8 are statistically significant. As the developmental levels of 78 provinces increase, an increase is also observed in the rate of all variables in question.
In the second stage of the study, NPMs were formed using the roughness penalty approach as another alternative to LM.
Table 9
Nonparametric Models (NPM) with Regression Spline
β0 f(x) adj. R2 x-y1 Coefficient (SE) (1.313)22.009 df = 7.405 0.717 t- and f-values t = 16.77 f = 23.84
p-values <2e-16 <2e-16
x-y2
Coefficient
(SE) (1.69)24.09 df = 4.12
0.561 t- and f-values t = 14.26 f = 19.74
p-values <2e-16 2.54e-14
x-y3
Coefficient
(SE) (1.303)22.949 df = 3.703
0.728 t- and f-values t = 17.61 f = 45.38
p-values <2e-16 <2e-16
x-y4
Coefficient
(SE) (1.087)20.051 df = 4.659
0.787 t- and f-values t = 18.44 f = 50.56
p-values <2e-16 <2e-16
x-y5
Coefficient
(SE) (1.389)23.042 df = 7.881
0.701 t- and f-values t = 16.59 f = 21.66
p-values <2e-16 <2e-16
x-y6
Coefficient
(SE) (0.9731)19.2121 df = 7.837
0.819 t- and f-values t = 19.74 f = 41.15
p-values <2e-16 <2e-16
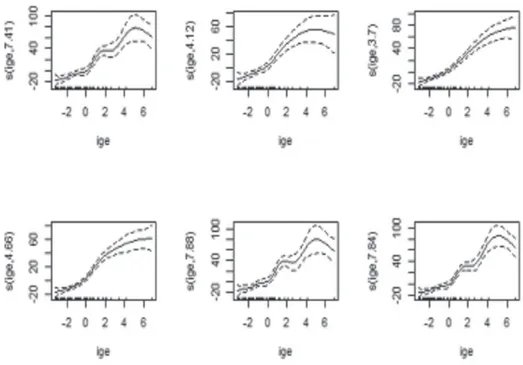
The f-values for all models in Table 9 are statistically significant. Moreover, the adjusted R2 values are found to be higher than those for LM. These results are also
Figure 2. Graphical representation of NPM. Table 10
Generalized Linear Models (GLM)
β0 β1 AIC exp( ) x-y1 Coefficients (SE) (0.4197)0.4168 (0.3778)1.6396 58.872 5.15 z-values 0.993 4.340 p-values 0.321 1.42e-05 x-y2 Coefficients (SE) (0.32441)0.02766 (0.23402)0.90974 80.661 2.48 z-values 0.085 3.887 p-values 0.932055 0.000101 x-y3 Coefficients (SE) (0.4242)0.5147 (0.3723)1.6142 60.705 5.02 z-values 1.214 4.336 p-values 0.225 1.45e-05 x-y4 Coefficients (SE) (0.44226)0.08567 (0.48786)0.07567 44.722 1.08 z-values 0.194 4.255 p-values 0.846 2.09e-05 x-y5 Coefficients (SE) (0.4582)0.8675 (0.3817)1.6460 63.368 5.18 z-values 1.893 4.312 p-values 0.0583 1.62e-05 x-y6 Coefficients (SE) (0.4677)0.3042 (0.5181)2.2072 43.823 9.09 z-values 0.65 4.26 p-values 0.515 2.05e-05
Upon assessing the results in Tables 8 and 9 and Figure 2, a nonlinear relationship was found for the provincial developmental indices with the new enrollment, additional placement, vertical transfer, license completion, second university, and enrollment renewal processes held at Anadolu University’s ODES.
In the next stage of the study, the generalized models GLM and GNPM are examined in addition to the structure of the two models above; the structure of these two sets of models are compared. The statistical results for GLM and GNPM are listed in Tables 10 and 11, respectively.
When examining Table 10, the z statistics for estimations are statistically significant. The estimated increases in the successfulness of the variables in question as a result of one unit of change in the provincial developmental index are obtained as 5.15, 2.48, 5.02, 1.08, 5.18, and 9.09, respectively. Interpreting the results is important as these models have been found to be statistically significant. One unit of increase in the provincial socioeconomic developmental level leads to an increase of: • 5.15% in the possibility of newly enrolled students.
• 2.48% in the possibility of students coming through additional placement.
Table 11
Generalized Nonparametric Models (GNPM)
β0 f(x) adj. R2 x-y1 Coefficient (SE) (16.1)11.4 df = 5.115 0.606 z- and χ2-values z = 0.708 χ2 = 6.308 p-values 0.479 0.339 x-y2 Coefficient (SE) (0.2824)-0.6471 df = 1 0.301 z- and χ2-values z = -2.291 χ2 = 15.11 p-values 0.022 0.000101 x-y3 Coefficient (SE) (20.14)14.03 df = 5.168 0.599 z- and χ2-values z = 0.696 χ2 = 9.892 p-values 0.486 0.109 x-y4 Coefficient (SE) (324.29)94.07 df = 4.908 0.798 z- and χ2-values z = 0.29 χ2 = 0.971 p-values 0.772 0.973 x-y5 Coefficient (SE) (27.79)11.51 df = 4.995 0.603 z- and χ2-values z = 0.414 χ2 = 5.881 p-values 0.679 0.362 x-y6 Coefficient (SE) (17.970)7.005 df = 3.256 0.761 z- and χ2-values z = 0.39 χ2 = 4.603 p-values 0.697 0.288
• 5.02% in the possibility of vertical transfer students.
• 1.08% in the possibility of students coming for license completion. • 5.18% in the possibility of students studying at a second university. • 9.09% in the possibility of students renewing enrollment.
When continuing the analysis upon the question of whether one can obtain better results after the GLM models, Table 11 has been created as a consequence using the GNPM models to determine the demand for ODES.
Upon investigating Table 11, the test statistics for f(x) are significant. However, the R2s are low when compared to GLM in all the models created here. No significant
improvement is observed in model performance when GNPM is used instead of GLM.
The performances of the models for 78 provinces were calculated after this stage of the study, and these values are presented in Table 12.
Table 12
Model Performances for LM, NPM, GLM, and GNPM according to 78 Provinces Deviation LM NPM GLM GNPM x-y1 x-y2 x-y3 x-y4 x-y5 x-y6 12236.35 19011.24 11450.93 8982.166 13825.51 7799.492 9353.584 16239.14 9704.146 6668.745 10397.4 5108.602 54.87238 76.66053 56.70538 40.72157 59.36755 39.82291 42.10462 76.66052 42.33983 21.25503 41.79775 23.29992 AIC LM NPM GLM GNPM x-y1 x-y2 x-y3 x-y4 x-y5 x-y6 621.6801 656.0484 616.5056 597.5648 631.2043 586.5526 615.536 651.9952 611.0019 583.6528 624.7386 569.2221 58.87238 80.66053 60.70538 44.72157 63.36755 43.82291 54.33536 80.66055 54.67583 33.07101 53.78847 31.81184 adj. R2 LM NPM GLM GNPM x-y1 x-y2 x-y3 x-y4 x-y5 x-y6 0.6608 0.5068 0.6901 0.7270 0.6387 0.7491 0.717 0.561 0.728 0.787 0.701 0.819 -0.606 0.301 0.599 0.798 0.603 0.761
When the model performances are investigated according to Table 12, NPMs are observed to yield better results than the linear and other models. When the deviation values for LM and NPM are investigated, the deviations for NPM are quite low when
compared to the deviation values for LM, and the AIC-values are also extremely low alongside these. Furthermore, the R2 values are also higher when compared to the
LMs. Moreover, the graphs of the NPMs were previously seen to show images that support the nonlinearity. Therefore, the use of NPMs to show the relations in question is statistically more significant and appropriate.
In summary, when carefully examining Table 12, the best models to use to explain the relations between the variables in question are observed to be NPMs according to the three important criteria of deviation, AIC, and adjusted R2.
Results
Sustainable development and economic growth are not possible without an innovative higher education system that leads to an increase in capacity. A positive relationship is known to exist between higher education and economic development. This especially applies to countries with low income, weak corporate structure, and limited human capital (Maxwell, 1994; Salmi, 2003). In this context, a relationship clearly exists among the higher education issues in Turkey. The issue of demand is more severe, especially in such a developing country with a high population of youths as Turkey (Aypay, 2003). On this point, open and distance education becomes very important because it should be particularly preferred and applied in developing countries with high youth populations, both because it reaches wide masses and the unit cost per student is low.
The socioeconomic development of a region is an indicator of both its social structure and the development of its human capital. Lifelong learning is extremely important for sustained development of human capital. Using open and distance learning opportunities and technologies is necessary to fulfill the need for lifelong learning. The development of higher education is also closely related to socioeconomic development, and this relationship can be mutual. Furthermore, higher education is of critical importance in terms of ensuring the intellectual human input that is necessary to turn the society of a country or region into an information-based and innovation-focused society. Apart from these, the socioeconomic structure in a province or region positively affects the point of view on and demand for higher education.
This study investigates the reflection of socioeconomic development in a province on the Open and Distance Education System, which is a higher education institution. Studies carried out have shown that the relationship in question should be examined not only linearly but also as a nonlinear relationship. In this study, the model with the best performance among the LM, NPM, GLM, and GNPM is the NPM. Therefore, a nonlinear (i.e., nonparametric) relationship exists for the provincial developmental index with the variables of new enrollment, additional placement, vertical transfer, license completion, second university, and enrollment renewal.
Table 13
NPM Performances for the 81 and the 78 Provinces
NPM adj. R2 for the 81 provinces NPM adj. R2 for the 78 provinces
x-y1 x-y2 x-y3 x-y4 x-y5 x-y6 0.974 0.953 0.979 0.985 0.982 0.989 0.717 0.561 0.728 0.787 0.701 0.819
This determination has two important aspects. Firstly, analyses were carried out for both the 81 provinces and the 78 provinces in this study. The study is the first one in its field designed specifically for Anadolu University’s ODES, both with a detailed outlook on the subject and the richness of the regression models created. The fact that Ankara, Istanbul, and Izmir provinces were excluded from the dataset because they caused nonlinearity in the models should not lead one to conclude that these provinces are insignificant. On the contrary, these three provinces take a more special place within the scope of these variables. The socioeconomic features of these three provinces led us to repeat the analyses over 78 provinces in this study. Whether the relationship was linear when analyses were carried out according to 78 provinces was also investigated because the socioeconomic development being high and the increase starting to fall slowly by curving in the graph (i.e. better explaining the relationship with a nonlinear function) lead to a new point-of-view. New policies that may increase the demand for ODES should be directed towards provinces with rapid socioeconomic development. The system should be promoted more, especially in big provinces. Big provinces having more than one university and being involved in new incentives on distance and lifelong learning are also facts. Therefore, the Anadolu University making important attempts to keep the demand for the system in these provinces alive by using the results of the article can provide good results.
Secondly, although this study has been carried out specifically for Anadolu University, it can also be said to reveal the functional structure of a very important relationship in terms of Turkey, because Anadolu University’s ODES provides very wide masses around Turkey with the opportunity for higher education through open and distance education. Apart from this, Anadolu University is an important higher education institution that has been struggling for lifelong learning around the country from the past to the present. The obtained results will also allow one to make inferences over the effects of socioeconomic development in Turkey on open and distance learning as a result of the sample size addressed. Although the LMs were found to be significant in this study, this result was not found to be satisfactory, which caused us to look for the best model by creating different ones and selecting the best ones from among them. In terms of the performances, the nonlinear relationship being found better among many statistical models is an important and interesting detail.
References
Albayrak, A. S. (2005). Türkiye’de illerin sosyoekonomik gelişmişlik düzeylerinin çok değişkenli istatistiksel yöntemlerle incelenmesi [An investigation in Turkey of provinces’ socioeconomic development levels using multivariate statistical methods]. ZKÜ Sosyal Bilimler Dergisi, 1(1), 153–177.
Anadolu Üniversitesi. (n.d.). General information. Retrieved from https://www.anadolu.edu.tr/en/
academics/faculties/2/open-education-faculty/general-info
Aypay, A. (2003). Yükseköğretimin yeniden yapılandırılması: Sosyoekonomik ve politik çevrelerin üniversitelerde kurumsal adaptasyona etkileri [Restructuring higher education: The effects of socioeconomic and political environments on institutional adaptation in universities]. Kuram ve
Uygulamada Eğitim Yönetimi, 34(Spring), 194–213.
Bekmez, S., Köne, A. Ç., & Günal, D. (2009). Beşeri sermayenin Türkiye’de bölgeler arası ekonomik gelişme açısından önemi [The importance of human capital in terms of interregional economic development in Turkey]. Tisk Akademi, 4(7), 67–82.
Berberoğlu, B. (2010a). Bilgi toplumu ve bilgi ekonomisi oluşturma yolunda Türkiye ve Avrupa Birliği [Turkey and the European Union on the path of forming the information society and knowledge economy]. Marmara Üniversitesi İktisadi ve İdari Bilimler Fakültesi Dergisi
Journal of the Faculty of Economic and Administrative Sciences, XXIX(II), 111–131.
Berberoğlu, B. (2010b). Ekonomik performansın Anadolu Üniversitesi’nde uzaktan eğitim yapan fakültelerin mezun sayılarına etkisi [The effect of economic performance on the number of graduates in the faculty of distance education at Anadolu University]. Anadolu Üniversitesi
Sosyal Bilimler Dergisi, Anadolu University Journal of Social Sciences, 10(2), 99–110.
Berberoğlu, B. (2015). Open and distance education programs of Anadolu University since its establishment. Procedia, Social and Behavioral Sciences, 174, 3358–3365.
Berberoğlu, C. N., Berberoğlu, B., Omay, R. E., & Karaduman, Ç. (2016). Statistical analysis of the heterogeneous structure of student demand by province for the faculty of open education at Anadolu University [Special issue]. Turkish Online Journal of Educational Technology, 532–539. Bloe, D. P. (2004). Development and human capital. The Heinz Journal, 1(1). Retrieved August 1,
2012, from http://journal.heinz.cmu.edu/articles/development-and-human-capital
Can, E. (2004, July). Uzaktan eğitim öğrencilerinin eğitimlerini değerlendirmeleri [Evaluations of the education of students of distance education]. Paper presented at the XIII. Ulusal Eğitim Bilimleri Kurultayı [13th National Education Sciences Congress]. İnönü Üniversitesi, Eğitim Fakültesi, Malatya, Turkey.
Draper, N. R., & Smith, H. (1998). Applied regression analysis. New York, NY: Wiley and Sons. Erarı, F. (2002, May). Küreselleşme sürecinde eğitimin kalkınmadaki önemi, Açıköğretimin yeri
ile Açıköğretim öğrencileri ile ailelerin sosyoekonomik durumu ve beklentileri [The importance
of educational development in the process of globalization: The socioeconomic status and expectations of families with open-education students through pace of open education]. Paper presented at the 20th Anniversary of the Open Education Faculty Symposium on Open and Distance Learning with International Participation, Anadolu University, Eskişehir, Turkey. Erk, N. (1989). The economics of higher education and tests of equity criteria in Turkey. Higher
Education, 18, 137–147.
Green, P. J., & Silverman, B. W. (1994). Nonparametric regression and generalized linear models. London, UK: Chapman & Hall.
Gül, H. E., & Çevik, B. (2014, February). 2010 ve 2012 verileriyle Türkiye’de illerin gelişmişlik
düzeyi araştırması [The level of provincial development in Turkey using data from 2010 and
2012]. Türkiye İş Bankası’s Economic Research Department. Retrieved from https://ekonomi.
isbank.com.tr/userfiles/pdf/ar_03_2012.pdf
Hastie, T. J., & Tibshirani, R. (1999). Generalized additive models. London, UK: Chapman & Hall. Janne, H. (1973). Üniversite ve çağdaş toplumun ihtiyaçları [Universities and the needs of modern
society] (B. Karafakıoğlu, Trans.). İstanbul, Turkey: İstanbul Teknik Üniversitesi Yayını. Kar, M., & Ağır, H. (2003). Türkiye’de beşeri sermaye ve ekonomik büyüme: Nedensellik Testi
[Human capital and economic growth in Turkey: The causality test]. In II. Ulusal Bilgi, Ekonomi
ve Yönetim Kongresi [Information booklet] (pp. 181–190). İzmir, Turkey.
Kavak, Y. (1990). Kalkınmada öncelikli yörelerdeki yükseköğretim kurumlarının çevreye dönük
faaliyetleri [Environmentally-oriented activities under development of higher education
institutions in priority areas]. Ankara, Turkey: Afşaroğlu Matbaası.
Kibritçioğlu, A. (1998). İktisadi büyümenin belirleyicileri ve yeni büyüme modellerinde beşeri sermayenin yeri [The determinants of economic growth and the place of human capital in new growth models]. Ankara Üniversitesi Siyasal Bilgiler Fakültesi Dergisi, 53(1-4), 207–230. King, A. (1966, 23 August–04 September). Eğitim, toplum ve gelişim, ekonomik gelişmeyi
hızlandıran etken olarak eğitim [Education, society, and development: Education as a factor
accelerating economic development]. Paper presented at Ekonomik ve Sosyal Etüdler Konferans Heyeti, İstanbul, Turkey.
Korkut, H. (2001). Sorgulanan yükseköğretim [The higher education in question]. Ankara, Turkey: Nobel Yayın Dağıtım.
Kurtkan, A. (1977). Sosyolojik açıdan eğitim yolu ile kalkınmanın esasları [The fundamentals of development through the path of education: The sociological perspective]. İstanbul, Turkey: Fatih Gençlik Vakfı Matbaa İşletmesi.
Lewis, D. R., & Dundar, H. (1999). Costs and productivity in higher education: Theory, evidence, and policy implications. In J. C. Smart (Ed.), Higher education: Handbook of theory and
research (Vol. XIV, pp. 39–102). New York, NY: Agathon.
Maxwell, W. E. (1987). The expansion of higher education enrollments in agrarian and developing world. In J. C. Smart (Ed.), Higher education: Handbook of theory and research (Vol. III, pp. 360–401). New York, NY: Agathon.
Özyakışır, D. (2011). Beşeri sermayenin ekonomik kalkınma sürecindeki rolü: Teorik bir değerlendirme [The role of human capital in the process of economic development: A theoretical assessment]. Journal of Entrepreneurship and Development, 6(1), 46–71.
Salmi, J. (2003). Constructing knowledge societies: New challenges for tertiary education. Higher
Education in Europe, 28(1), 65–69.
Şimşek, H. (1999). The Turkish higher education system in the 1990’s. Mediterraanean Journal of
Educational Studies, 4(2), 133–153.
Urfalıoğlu, F., & Seyfullahoğulları, A. (2004). İllerin bazı sosyoekonomik kriterler altında gelişmişlik sınıflaması [The advanced classification of provinces under certain socioeconomic criteria]. Marmara Üniversitesi, İktisadi ve İdari Bilimler Fakültesi Dergisi, XIX(1), 209–232. Uzun, A., Özel, M. E., & Yalçın, C. (1990). Main trends in graduate study in basic sciences in
Wood, S. N. (2000). Modeling and smoothing parameter estimation with multiple quadratic penalties. Journal of Royal Statistical Society, B(62), 413–428.
Wood, S., & Augustin, N. H. (2002). GAMs with integrated model selection using penalized regression splines and applications to environmental modelling. Ecological Modelling, 157, 157–177.
Yumuşak, İ. G., & Bilen, M. (2000). Gelir dağılımı- beşeri sermaye ilişkisi ve Türkiye üzerine bir değerlendirme [The relationship of income distribution and human capital: An assessment over Turkey]. Kocaeli Üniversitesi Sosyal Bilimler Dergisi, 1(1), 77–96.