Determining the Change in Retail Prices of Veal in Turkey by GARCH
Method Between 2014-2017
[1]Mehmet Saltuk ARIKAN
1,a Mustafa Bahadır ÇEVRİMLİ
2,bAhmet Cumhur AKIN
3,cMustafa Agah TEKİNDAL
4,d[1] This study was presented as oral presentation in the 4th International Congress on Veterinary and Animal Science, 12-15
July 2018, Nevşehir, Turkey”
1 Department of Animal Health Economics and Management, Fırat University Faculty of Veterinary Medicine, TR-23119
Elazıg - TURKEY
2 Department of Livestock Economics and Management, Selcuk University Faculty of Veterinary Medicine, TR-42003
Konya - TURKEY
3 Department of Animal Health Economics and Management, Mehmet Akif Ersoy University Faculty of Veterinary
Medicine, TR-15030 Burdur - TURKEY
4 Department of Biostatistic, Selcuk University Faculty of Veterinary Medicine, TR-42003 Konya - TURKEY
a ORCID: 0000-0003-4862-1706; b ORCID: 0000-0001-5888-242X; c ORCID: 0000-0003-3732-0529; d ORCID: 0000-0002-4060-7048 Article ID: KVFD-2018-21187 Received: 17.10.2018 Accepted: 28.02.2019 Published Online: 02.03.2019 How to Cite This Article
Arikan MS, Çevrimli MB, Akin AC, Tekindal MA: Determining the change in retail prices of veal in Turkey by GARCH method between 2014-2017. Kafkas Univ Vet Fak Derg, 25 (4): 499-505, 2019. DOI: 10.9775/kvfd.2018.21187
Abstract
In Turkey, the demand for veal in the red meat market is steadily increasing. In the formation of this demand and price; additional factors such as consumer preferences, government interventions in the red meat market, import decisions, also the implemented policies and subsidies are effective besides the main factors. However, the fact that such practices do not affect the veal prices in the market makes it impossible to ensure price stability and a sustainable market. The analysis of the change in retail prices is important for both producers and consumers so that the validity of this view can be tested. The aim of this study was to analyze the retail prices of minced meat and the veal cubes from the first week of January 2014 to the last week of December 2017 via using the volatility estimation modeling method in the context of the effectiveness of the policies and market interventions applied in the red meat sector implemented in Turkey. Non-stationary series were made stationary by differencing. By developing a Generalised Autoregressive Conditional Heteroskedasticity (GARCH 1,1) model using the series subject to a unit root test, it was found to be the optimal model that best explains the fluctuation of the prices. The results of the estimation show that the retail prices of veal cubes and minced meats fluctuated conspicuously in the said period and that the implemented policies and the market interventions were not adequate to eliminate the instability and uncertainty of the prices.
Keywords: GARCH, Price volatility, Time series, Turkey, Veal
Türkiye’de Perakende Dana Eti Fiyatlarındaki Değişimin Garch Yöntemiyle
Belirlenmesi, 2014-2017
Öz
Türkiye’de kırmızı et tüketiminde büyükbaş hayvan etine olan talep her geçen gün artmaktadır. Bu talebin ve fiyatın oluşmasında tüketici tercihleri, kırmızı et piyasasına yapılan devlet müdahaleleri, alınan ithalat kararları, uygulanan politikalar ve desteklemeler de etkili olmaktadır. Ancak bu uygulamaların etkisinin reel piyasada dana eti fiyatlarına olumlu yansımaması sebebiyle, fiyat istikrarının sağlanması ve sürdürülebilir yapıya kavuşması imkânsızlaşmaktadır. Bu çalışmada; Ocak 2014 ilk hafta ile Aralık 2017 son haftası arasındaki döneme ait verilere göre Türkiye’de kırmızı et sektöründe uygulanan politikalar ve devlet müdahaleleri kapsamında perakende dana kıyma ve kuşbaşı ortalama fiyatları volatilite tahmin modelleme yöntemi ile analiz edilmesi amaçlanmıştır. Durağan olmayan serilerin farkları alınarak durağan hale getirilmiştir. Birim kök testi uygulanan serilere daha sonra Genelleştirilmiş Otoregresif Koşullu Değişen Varyans (GARCH 1,1) modeli kurularak, fiyatlardaki dalgalanmayı açıklayan en uygun model olduğu tespit edilmiştir. Tahmin sonuçları incelenen dönemde perakende dana kuşbaşı ve kıyma fiyatlarında belirgin dalgalanmaların yaşandığını göstermekle birlikte bu dönemde uygulanan politikaların ve piyasaya yapılan müdahalelerin fiyatlardaki istikrarsızlık ve belirsizliği gidermede yeterli olmadığını açıklamaktadır.
Anahtar sözcükler: GARCH, Fiyat oynaklığı, Zaman serisi, Türkiye, Dana eti
İletişim (Correspondence)
+90 424 237 00 00-3995 Mobile: +90 505 3254651INTRODUCTION
In Turkey, the demand for red meat is met by sheep, goat, water buffalo and cattle producers, with beef constituting 87.67% of the total red meat production [1]. However, retail
beef prices have substantially increased in recent years. While retail veal prices rose by 130% between 2005-2013, retail mutton prices increased by 154% and the feed prices by 115%. The increases in the prices of red meat were higher than the increases in the CPI (Consumer Price Index), which was 118% in the same period [2]. This drastic increase
in the retail prices resulted in approximately 30% decrease in the per capita consumption of red meat [3]. The increase
in prices continued in the period from 2014 to 2017 as well, and retail prices of veal rose by 19.54% [4]. The increasing
prices of red meat have been a subject of debate both in the media and among the policy-makers in Turkey [2].
The increasing prices both mean a higher level of uncertainty regarding the prices in the next years and poses a significant price risk, which adversely affects producer welfare where there are without risk protection mechanisms in place [5]. The increasing demand for red
meat and global pressures on climate change have pushed up wholesale and retail prices of meat products in many parts of the world [6]. Abrupt changes in retail prices
usually affect the food security for a part of the population, resulting in changes to the dietary habits [7,8].
Price volatility indicates the range in which the prices may vary in the future [9]. Knowledge of the degree of price
volatility is very important in the sense that it would allow policy-makers to formulate appropriate strategies to protect against risks. In primary commodity markets such as the red meat market, production decisions are based on expected prices. When such expectations are not met, producers face the risk of decreasing revenues [10].
Price fluctuations affect all actors in the food supply chain. Volatility decreases the inputs of production and investments, causing a risk for producers who can react [11-13].
Unexpected price increases for consumers who spend a large portion of their income on food have a negative impact on sustainable food consumption [14].
It’s a common fact that the volatilities in meat prices can be successfully modelled with the ARCH (Autoregressive Conditional Heteroscedasticity)/GARCH (Generalized Auto- regressive Conditional Heteroscedasticity) time series models. GARCH is a model that can be used to analyse both mean and variance effects of policy and market structure changes, and in a changing environment such as the livestock market there is a need for such a model that combines the desirable aspects of dynamics, static equilibrium and price volatility [15,16]. It has been successfully
used to analyse and explain the price changes of red meat in various countries [10,15,17,18].
Changes in prices of red meat products are a significant economic risk that affects the level of production. Thus, the research on the changes in retail prices of meat in Turkey is important to understand how to equilibrate the market. This study is intended to analyse the average retail prices of minced meats and veal cubes under the government policies and interventions in the red meat sector of Turkey between 2014 and 2017 using the volatility estimation modelling method. The main purpose of this study is contributing the literature on the effectiveness of the policies and market interventions applied in the red meat sector. In the long run, this study also aims to provide significant information to the decision and policy makers about the econometric method that they can need.
MATERIAL and METHODS
Data SetIn order to explore the changes in meat prices, the weekly retail prices of minced and veal cubes in Turkey from the first week of 2014 to the last week of 2017 were used as the data for the analysis. The short-term asymmetric effect was determined by considering the time interval to measure the response of price changes. The data sets of the minced meats and veal cubes prices used in the analysis were obtained from the weekly bulletin of the Meat and Milk Board [4].
Analysis Method
The analyses conducted using ARIMA model and ARCH/ GARCH models are intended to measure the index uncertainty. In the present study, due to the absence of future predictions, volatility of the price change series has been measured over the current asymmetric effect GARCH model instead of hybrid models. In order to measure the index uncertainty, the ARCH model suggested by Engle [19]
for the first time and the GARCH model, which had been developed by Bollerslev [20] were used in the study.
The functioning of the ARCH model can be addressed as follows [21]:
Let’s assume a regression model with k explanatory variables. Yt = β1 + β2X2t + ...+ βkXkt + εt [1]
In equation (1), under the assumption that conditional information can be obtained at time (t-1), the error term εt, is normally distributed with zero means and variance
(α0 + α1 + ε2t-1), which can be expressed as εt ~ N[0,(α0 + α1
+ ε2
t-1)]. While the error term with zero mean is one of the
assumptions of the method of least squares, the addressing of the error term’s variance at time t as a function of the square of the error term at t-1 was introduced by the ARCH model. Additionally, the expression of the error term’s variance as (α0 + α1 + ε2t-1) is called the ARCH(1) process.
Since relatively long lags are used and a fixed lag structure is suggested in applying the ARCH model, some constraints are imposed on the parameters in the conditional variance equation. In an attempt to avoid problems with negative variance parameter estimates, Bollerslev [20] extended the
ARCH model and developed a new one that allowed for both more past information and a more flexible lag structure. As the said model was developed not as an alternative to the ARCH model, but as a model intended to improve it, it is called generalised ARCH, or shortly GARCH [22].
Using the conditional variance equation, standard GARCH(p, q) process can be expressed as follows:
σ2
t = ω + α ε2t-1 + β σ2t-1 [2]
The equation (2) indicating the conditional variance is a function of the mean (ω), ARCH term (ε2
t-1) and GARCH
term (σ2
t-1). Therefore, p and q in GARCH(p, q) denote the
ARCH term and GARCH term, respectively. In the ARCH(q) process, conditional variance is a function of only the past sample variances, whereas the GARCH(p, q) process allows lagged conditional variances to enter as well.
When working with time series, one should always pay attention to the stationarity of the data. Time series data of economic and financial variables usually involve trend and seasonality, which may violate the principle of stationary time series [23]. A stationary time series can be defined as
mean and variance are independent over time. Where time series are not stationary, the estimated econometric models may produce misleading results. Thus, in the econo- metric analyses conducted using time series, unit root test (stationarity test) is performed on the time series. Therefore, Augmented Dickey-Fuller (ADF) and Phillips-Perron (PP) tests were conducted to test whether the time series had a unit root (stationarity). Results of the unit root test are given in Fig. 1 and Fig. 2 as well as in Table 1 and
Table 2.
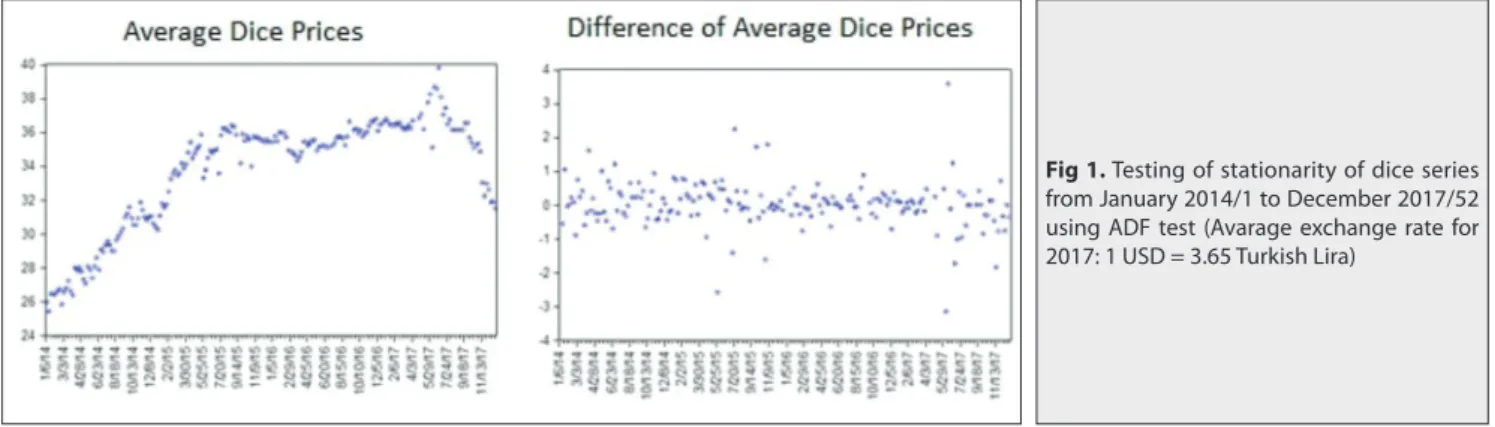
Fig. 1 and Fig. 2 present the change in the prices of veal cubes
and minced meats over time. It is clear that the variables do not follow a stationary course during the periods under consideration. The veal cubes and minced meats series were rendered stationary after the ADF and PP tests.
RESULTS
Decreases and increases in the retail prices of minced meats and veal cubes indicate a significant level of price fluctuation. Following the increases in October 2014 and May 2015, excessive increases are observed in June 2017
(Fig. 1, Fig. 2).
The series used in the model was compiled using the weekly data from January 2014/1 to December 2017/52 and the ARCH and GARCH methods. Firstly, the non-stationary series was made non-stationary by taking its logarithm and first difference (Fig. 1, Fig. 2). Secondly, it was found that inflation followed the AR(1) and MA(1) process by looking at the correlogram of ACF and PACF (Table 3). The modelling with AR(1) and MA(1) showed that both were significant. AIC and BIC values of the results obtained by running AR(1) and MA(1) individually were compared. As AIC and BIC values of AR(1) were lower than those of MA(1), AR(1) model was selected (Table 4, Table 5). Finally, the estimated ARCH/GARCH model was solved using the maximum likelihood (ML) technique, as shown in Tables 4 and 5, and it was found that the model had the effect of GARCH (1, 1) and no effect of a higher degree of GARCH. The presence of the GARCH(1, 1) effect in the index series indicates that the GARCH variance series obtained as a result of the solution can be used as a measure of uncertainty in the veal cubes and minced meats series from January 2014/1 to December 2017/52.
The first difference of the data was taken to make the veal cubes series in Fig. 1 stationary. The series became stationary after taking its first difference.
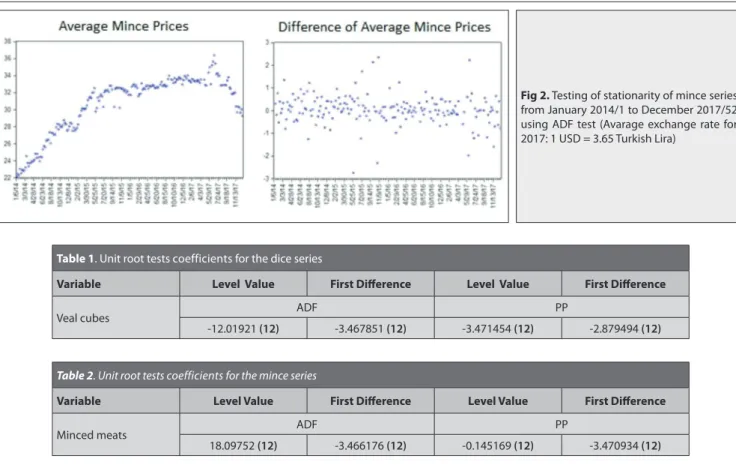
The first difference of the data was taken to make the minced meats series in Fig. 2 stationary. The series became stationary after taking its first difference.
ADF and PP unit root tests indicate that the veal cubes series from January 2014/1 to December 2017/52 became stationary after taking its first difference.
ADF and PP test values of the veal cubes series from January 2014/1 to December 2017/52 after taking its first difference are significant at a significance level of 1%, 5%
Fig 1. Testing of stationarity of dice series from January 2014/1 to December 2017/52 using ADF test (Avarage exchange rate for 2017: 1 USD = 3.65 Turkish Lira)
and 10%, respectively. The values in the parentheses are the optimal lag lengths.
ADF and PP unit root tests indicate that the mince series from January 2014/1 to December 2017/52 became stationary after taking its first difference.
ADF and PP test values of the mince series from January 2014/1 to December 2017/52 after taking its first difference are significant at a significance level of 1%, 5% and 10%, respectively. The values in the parentheses are the optimal lag lengths.
In this framework, the model developed below for the mince series from January 2014/1 to December 2017/52 is significant.
[3] The model indicates that the mince price is affected by the price in the previous week, with 1 unit of increase in the mince price being followed by a 0.15 unit of increase in the mince price in the next week.
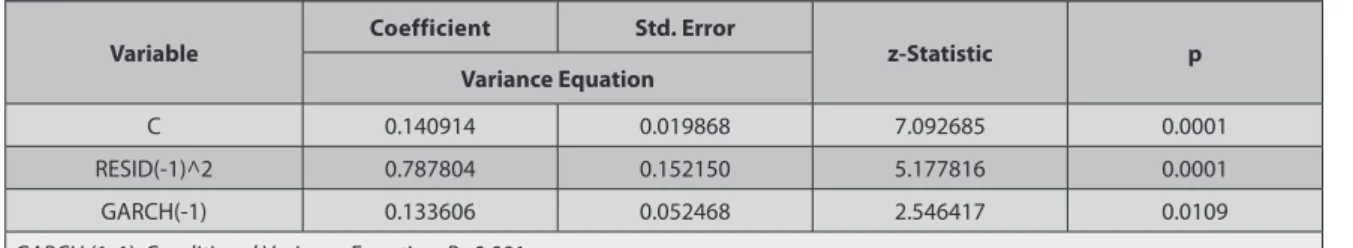
[4] The model indicates that the veal cubes price is affected by the price in the previous week, with 1 unit of increase in the veal cubes price being followed by a 0.78 unit of increase in the veal cubes price in the next week.
As an econometric result, it was found that the minced meats and veal cubes series from January 2014/1 to
December 2017/52 between 06.01.2014 and 25.12.2017 had a quite varying variance.
In the models set on the prices of minced meats and veal cubes, RESID (-1) parameter shows the effect of shocks on price changes and GARCH (-1) parameter shows the effect of the previous period volatility on the current period volatility. The fact that the sum of both parameters is close to one means that it will have a long time effect on price volatility if a possible equilibrium situation deteriorates. According to the results of the analysis, the veal cubes are more sensitive to the price changes compared to minced meats.
DISCUSSION
This study analysed the volatility of the retail prices of minced meats and veal cubes using volatility estimation modelling for the period between 2014 and 2017, and the results of the GARCH(1, 1) model show that it is the optimal model that best explains the change in the prices.
Analysis results indicate that the retail prices of minced meats and veal cubes saw excessive volatility in the period under consideration. Various policies and government interventions were implemented in the red meat sector in an effort to decrease the rising meat prices. In order to prevent price increases in October and November 2014, the General Directorate of Meat and Milk Board was authorised to import 15 thousand tons of beef with zero custom duty [24], and the custom duty for livestock imports
Fig 2. Testing of stationarity of mince series from January 2014/1 to December 2017/52 using ADF test (Avarage exchange rate for 2017: 1 USD = 3.65 Turkish Lira)
Table 1. Unit root tests coefficients for the dice series
Variable Level Value First Difference Level Value First Difference
Veal cubes ADF PP
-12.01921 (12) -3.467851 (12) -3.471454 (12) -2.879494 (12)
Table 2. Unit root tests coefficients for the mince series
Variable Level Value First Difference Level Value First Difference
Minced meats ADF PP
by the private sector was reduced to 15%, provided that imported livestock would be used for stockbreeding [25].
Although the decisions taken were effective in reducing the retail prices of minced meats and veal cubes until the end of 2014, the prices started to elevate again as from early 2015 until May. The rising prices adversely affected the prices of foods and food services in this period [26]. In
an attempt to prevent the price increases, first the custom duty for imports was reduced to 0%, and then the Meat and Milk Board was authorised to import 30,000 tons of fresh or frozen bovine meat [27,28].
To prevent the increase in red meat prices which were rising due to the lack of sufficient cattle for slaughter in Turkey, a market intervention was implemented through the Meat and Milk Board in March 2017, supplying butchers with fresh beef carcass and food and meat industrialists with frozen beef carcass through importation [29]. The upward
movement in red meat prices observed since February 2017 continued in June, and the increase in prices was reported to be basically arising from the shortage of domestic supply [30]. Pursuant to the decision taken in
response to the drastic price increase in June, the custom
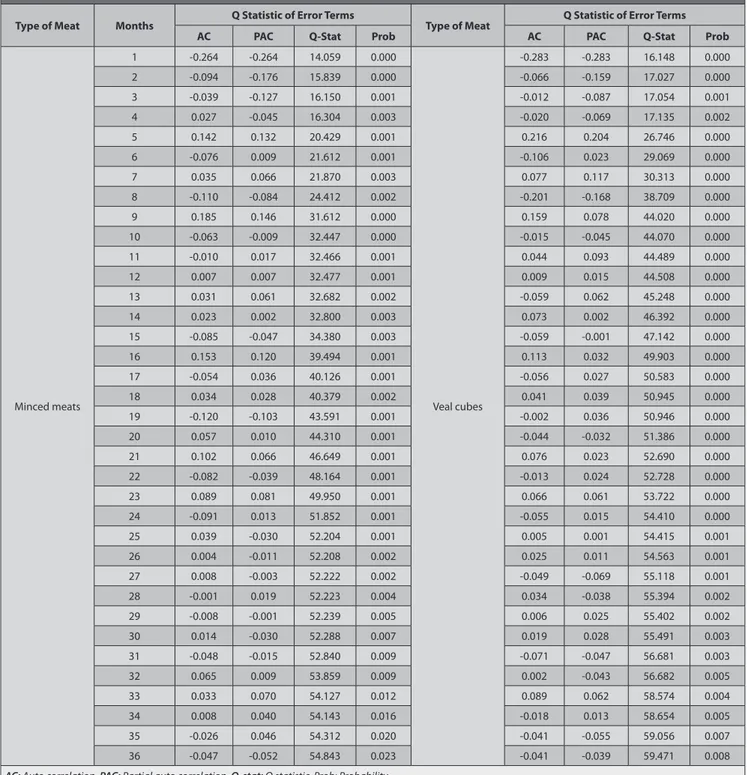
Table 3. Correlogram results of the mince and dice series from January 2014/1 to December 2017/52
Type of Meat Months Q Statistic of Error Terms Type of Meat Q Statistic of Error Terms
AC PAC Q-Stat Prob AC PAC Q-Stat Prob
Minced meats 1 -0.264 -0.264 14.059 0.000 Veal cubes -0.283 -0.283 16.148 0.000 2 -0.094 -0.176 15.839 0.000 -0.066 -0.159 17.027 0.000 3 -0.039 -0.127 16.150 0.001 -0.012 -0.087 17.054 0.001 4 0.027 -0.045 16.304 0.003 -0.020 -0.069 17.135 0.002 5 0.142 0.132 20.429 0.001 0.216 0.204 26.746 0.000 6 -0.076 0.009 21.612 0.001 -0.106 0.023 29.069 0.000 7 0.035 0.066 21.870 0.003 0.077 0.117 30.313 0.000 8 -0.110 -0.084 24.412 0.002 -0.201 -0.168 38.709 0.000 9 0.185 0.146 31.612 0.000 0.159 0.078 44.020 0.000 10 -0.063 -0.009 32.447 0.000 -0.015 -0.045 44.070 0.000 11 -0.010 0.017 32.466 0.001 0.044 0.093 44.489 0.000 12 0.007 0.007 32.477 0.001 0.009 0.015 44.508 0.000 13 0.031 0.061 32.682 0.002 -0.059 0.062 45.248 0.000 14 0.023 0.002 32.800 0.003 0.073 0.002 46.392 0.000 15 -0.085 -0.047 34.380 0.003 -0.059 -0.001 47.142 0.000 16 0.153 0.120 39.494 0.001 0.113 0.032 49.903 0.000 17 -0.054 0.036 40.126 0.001 -0.056 0.027 50.583 0.000 18 0.034 0.028 40.379 0.002 0.041 0.039 50.945 0.000 19 -0.120 -0.103 43.591 0.001 -0.002 0.036 50.946 0.000 20 0.057 0.010 44.310 0.001 -0.044 -0.032 51.386 0.000 21 0.102 0.066 46.649 0.001 0.076 0.023 52.690 0.000 22 -0.082 -0.039 48.164 0.001 -0.013 0.024 52.728 0.000 23 0.089 0.081 49.950 0.001 0.066 0.061 53.722 0.000 24 -0.091 0.013 51.852 0.001 -0.055 0.015 54.410 0.000 25 0.039 -0.030 52.204 0.001 0.005 0.001 54.415 0.001 26 0.004 -0.011 52.208 0.002 0.025 0.011 54.563 0.001 27 0.008 -0.003 52.222 0.002 -0.049 -0.069 55.118 0.001 28 -0.001 0.019 52.223 0.004 0.034 -0.038 55.394 0.002 29 -0.008 -0.001 52.239 0.005 0.006 0.025 55.402 0.002 30 0.014 -0.030 52.288 0.007 0.019 0.028 55.491 0.003 31 -0.048 -0.015 52.840 0.009 -0.071 -0.047 56.681 0.003 32 0.065 0.009 53.859 0.009 0.002 -0.043 56.682 0.005 33 0.033 0.070 54.127 0.012 0.089 0.062 58.574 0.004 34 0.008 0.040 54.143 0.016 -0.018 0.013 58.654 0.005 35 -0.026 0.046 54.312 0.020 -0.041 -0.055 59.056 0.007 36 -0.047 -0.052 54.843 0.023 -0.041 -0.039 59.471 0.008
duty for bovine animals was reduced from 135% to 26%, and the custom duty for bovine meat ranging between 100-225% was reduced to 40% [31]. This decision granted
the authorisation to import livestock and carcass, which had been exclusively held by the Meat and Milk Board, to the private sector as well. One month after the issuance of this decree, the Meat and Milk Board was granted authorisation to import 90 thousand tons of red meat and 975 thousand head of livestock, 500 thousand head being bovine and 475 thousand head being ovine [32].
Price uncertainty seems to be a very significant restrictive factor for meat production where risk protection mechanisms do not exist. As it affects the production decisions, it restricts the efforts of businesses to build new capacity, invest in advanced technologies and enter new markets [10].
The Turkish livestock sector is subject to excessive price fluctuations, low profitability and unforeseeable intervention policies [33].
Another factor leading to the price increases is the role of market concentration and market power, particularly at the level of retail prices [2]. While the four-firm concentration (CR
4)
in the red meat market of Turkey was 41% in 2007, it rose to 50% in 2012 [34,35]. The long marketing chain in the red meat
market diminishes the effectiveness of government subsidies granted to producers and causes the producer share in consumer prices of many products to gradually decrease. This indicates that the subsidies granted are actually not transferred to producers, but rather to the processes after the production [36]. Due to the asymmetrical price transfer
in the red meat market, there are no large-scale enterprises producer cooperatives that have the potential to become suppliers [2]. As producers are small-scale enterprises, it is
highly essential that they organise against large retailers and wholesalers so that they can have sufficient bargaining power under the current market conditions [3].
The models developed for the time series data of the minced meats and veal cubes prices in the research show that increases in prices affect the next week’s prices. The studies conducted on the same subject found that volatility of beef prices reacted heavily to the market movements [10], that a negative shock in the prices caused a
higher volatility than a positive shock of the same degree [37],
and that the fluctuations in beef prices resulted in fluctuations in the price of mutton and chicken [18].
Veal meat prices in Turkey were determined to be strictly affected from the economic and political instability, food crisis, natural events etc., and the prices of veal meat could return to normal values after a long time compared to the average price [38]. On the other hand, the dependence
on beef and veal red meat has increased over the years and it reflected to the importation as well [39]. Red meat
consumption has been sensitive to the price changes and always responded negatively to the beef meat pricing crisis [40]. Red meat imports, unfortunately, couldn’t help
the price increases and the market price of red meat was increased later because of a lower local supply [41]. On the
other hand, due to the high level intermediary margins of beef meat marketing, red meat prices is increasing in Turkey [42].
In conclusion, the results of the estimation prove that the retail prices of veal cubes and minced meats fluctuated conspicuously in the period under consideration and that the implemented policies and the market interventions were not adequate to eliminate the instability and uncertainty of the prices. The presence of oligopsonistic market conditions, the long marketing chain in the sector and the import dependency to meet the demand for red meat attenuate the market power. Hence, it is essential that the price uncertainty is reduced from the perspective of producers and concrete steps other than importation
Table 5. The result of GARCH analysis of the dice series from January 2014/1 to December 2017/52
Variable Coefficient Std. Error z-Statistic p
Variance Equation
C 0.140914 0.019868 7.092685 0.0001
RESID(-1)^2 0.787804 0.152150 5.177816 0.0001
GARCH(-1) 0.133606 0.052468 2.546417 0.0109
GARCH (1, 1): Conditional Variance Equation; P=0.001
Table 4. The result of GARCH analysis of the mince series from January 2014/1 to December 2017/52
Variable Coefficient Std. Error z-Statistic P
Variance Equation
C 0.087583 0.027537 3.180620 0.0015
RESID(-1)^2 0.154908 0.058710 2.638520 0.0083
GARCH(-1) 0.647365 0.094256 6.868192 0.0001
be taken to prevent increases in retail prices from the perspective of consumers so that the sector can grow and reach a level where it can compete globally.
REFERENCES
1. MFALT: Ministry of Food, Agriculture and Livestock of Turkey. Livestock data. https://www.tarim.gov.tr/sgb/Belgeler/SagMenuVeriler/HAYGEM. pdf, Accessed: 15.03.2018.
2. Özertan G, Saghaian SH, Tekgüç H: Dynamics of price transmission and market power in the Turkish beef sector. İktisat İşletme ve Finans, 30 (349): 53-76, 2015.
3. Bölük G, Karaman S: Market power and price asymmetry in farm-retail transmission in the Turkish meat market. New Medit, 16 (4): 2–11, 2017. 4. GDMMB: General Directory of Meat and Milk Board. Weekly meat price bulletin. https://www.esk.gov.tr/; Accessed: 09.02.2018.
5. Rezitis AN, Stavropoulos KS: Greek meat supply response and price volatility in a rational expectations framework: A multivariate GARCH approach. Eur Rev Agric Econ, 39 (2): 309-333, 2011. DOI: 10.1093/erae/jbr038 6. Revell BJ: One man’s meat… 2050? ruminations on future meat demand in the context of global warming. J Agric Econ, 66 (3): 573-614, 2015. DOI: 10.1111/1477-9552.12121
7. Sarris A: Food commodity price volatility and food insecurity. Bio-Based Appl Econ, 2 (3): 213-236, 2013. DOI: 10.13128/BAE-13114 8. Bazga B, Ipate I, Ipate N: Price volatility in context of food security for sustainable development. In, 3th International Conference, Competitiveness of Agro-Food and Environmental Economy, Romania, November 6-7, 2014. 9. Weaver RD, Natcher WC: Competitiveness in vertical market chains: Evidence for beef markets. In, NEC-165 Conference, The American Consumer in the Changing Food System, Washington DC, May 3-5, 2000.
10. Rezitis AN, Stavropoulos KS: Price volatility and rational expectations in a sectoral framework commodity model: A multivariate GARCH approach. Agric Econ, 42 (3): 419-435, 2011. DOI: 10.1111/j.1574-0862.2010.00521.x 11. Sckokai P, Moro D: Modelling the impact of the CAP single farm payment on farm investment and output. Eur Rev Agric Econ, 36 (3): 395-423, 2009. DOI: 10.1093/erae/jbp026
12. Tangermann S: Risk management in agriculture and the future of the EU’s Common Agricultural Policy. ICTSD, 34, 2011.
13. Taya S: Stochastic model development and price volatility analysis. OECD Food Agriculture and Fisheries Papers, No. 57, OECD Publishing, Paris, 2012. DOI: 10.1787/5k95tmlz3522-en
14. Hernandez MA, Ibarra R, Trupkin DR: How far do shocks move across borders? Examining volatility transmission in major agricultural futures markets. Eur Rev Agric Econ, 41 (2): 301-325, 2014. DOI: 10.1093/ erae/jbt020
15. Luo W, Liu R: Analysis of meat price volatility in China. Chinese Agric Econ Rev, 3 (3): 402-411, 2011. DOI: 10.1108/17561371111165815 16. Kesavan T, Aradhyula SV, Johnson SR: Dynamics and price volatility in farm-retail livestock price relationships. J Agric Resour Econ, 17 (2): 348-361, 1992.
17. Rezitis A: Mean and volatility spillover effects in Greek producer-consumer meat prices. Appl Econ Lett, 10 (6): 381-384, 2003. DOI: 10.1080/ 1350485032000081299
18. Fakari B, Aliabadi MMF, Mahmoudi H, Kojori M: Volatility spillover and price shocks in Iran’s meat market. Custos e Agronegocio On Line, 12 (2): 84-98, 2016.
19. Engle RF: Autoregressive conditional heteroscedasticity with estimates of the variance of United Kingdom inflation. Econometrica, 50, 987-1007, 1982. DOI: 10.2307/1912773
20. Bollerslev T: Generalized autoregressive conditional heteroskedasticity. J Econom, 31, 307-327, 1986.
21. Gujarati DN: Basic Econometrics. 2nd ed., Literatür Press, İstanbul, 2001.
22. Laurent S, Peters, JP: GARCH 2.2: An Ox package for estimating and forecasting various ARCH models. J Econ Surv, 16 (3): 447-484, 2002. DOI: 10.1111/1467-6419.00174
23. Yurdakul F: Unit-Root tests developed in the presence of structural breaks. In, Ünsal A, Köse N (Eds): Econometric Selection Articles, Gazi Üniv İİBF GVİ, Ankara, 2003.
24. TOG: Turkish Official Gazette. Decision on the application of tariff quotas for import of beef for use by the general directorate of meat and milk. July 1, 2014, 29069, 2014.
25. MFALT: Ministry of Food, Agriculture and Livestock of Turkey. Import of beef cattle. https://www.tarim.gov.tr/Duyuru/174/Besilik-Sigir-Ithali; Accessed: 07.03.2018.
26. CBTR: Central Bank of the Turkish Republic. Development report of July. http://www.tcmb.gov.tr/wps/wcm/connect/aceb4269-28a8-475c-8319-a4383d61c32a/afiyattemmuz15.pdf?MOD=AJPERES&CACHEID= ROOTWORKSPACE-aceb4269-28a8-475c-8319-a4383d61c32a-m3fBcr7; Accessed: 23.05.2018.
27. TOG: Turkish Official Gazette. Decision to make a decision on the application of tariff quotas on imports of certain agricultural products originating from the European Union. No:29445, 14.08. 2015.
28. TOG: Turkish Official Gazette. Decision on the application of tariff quotas for import of beef for use by the general directorate of meat and milk. No:29459, (1st replicate). 28.08.2015.
29. Akın AC, Arıkan MS, Çevrimli MB: Effect of import decisions in Turkey between 2010-2017 on the red meat sector. In, 1st International Health Science and Life Congress in Burdur, May 2-5, Burdur-Turkey, 2018. 30. CBTR: Central Bank of the Turkish Republic. Recent developments in food prices. 3rd Inflation report. http://www.tcmb.gov.tr/wps/wcm/ connect/60abf85f-4165-44c8-ba5e-ccc31607200f/3b17-3.pdf?MOD =AJPERES&CACHEID=ROOTWORKSPACE-60abf85f-4165-44c8-ba5e-ccc31607200f-m3fBboK; Accessed: 28.05.2018.
31. TOG: Turkish Official Gazette. Additional decision on import regime decision, No: 30107, 27.06.2017.
32. TOG: Turkish Official Gazette. Decision on the application of tariff quotas on imports of live animals and meat. No: 30138, 29.06.2017. 33. Tutkun M, Tatar AM, Şireli HD: The livestock situation of Turkey. In, 5th International Scientific Agricultural Symposium, Oct 23-26, Bosnia and Herzegovina, 2014.
34. TSI: Turkish Statistical Institute. Concentration ratios by classes in sections. No:15846, 29.03.2013.
35. TSI: Turkish Statistical Institute. Concentration ratios by classes in sections. No: 15846, 21.08.2014.
36. RTMD: Republic of Turkey Ministry of Development, 10th Development Plan (2014-2018). Special report on livestock commission, Ankara, Turkey, 2013.
37. Uchezuba DI, Mbai S: Modelling price expectation and volatility effects on producer behaviour: A case of Namibian Beef market. Int J Appl Agric Res, 11 (1): 83-102, 2016.
38. Ayyıldız M, Çiçek A: Analysis of red meat prices with Garch method: The case of Turkey. Turk J Agric Food Sci Technol, 6 (12): 1775-1780, 2018. DOI: 10.24925/turjaf.v6i12.1775-1780.2095
39. Çiçek H, Doğan İ: Türkiye’de canlı sığır ve sığır eti ithalatındaki gelişmeler ve üretici fiyatlarının trend modelleri ile incelenmesi. Kocatepe Vet J, 11 (1): 1-10, 2018.
40. Erdoğdu H, Çiçek H: Modelling beef consumption in Turkey: the ARDL/bounds test approach. Turk J Vet Anim Sci, 41 (2): 255-264, 2017. DOI: 10.3906/vet-1606-43
41. Cevger Y, Sakarya E: Meat prices and factors affecting them in Turkey. Turk J Vet Anim Sci, 30 (1): 1-6, 2006.
42. Aral Y, Çevrimli MB, Akdoğan N, Aydin E, Arıkan MS, Akın AC, Özen D: Investigation of intermediary margins in the marketing of beef and lamb meat in Ankara province, Turkey. Kafkas Univ Vet Fak Derg, 22 (5): 685-691, 2016. DOI: 10.9775/kvfd.2016.15139