© XIV. International Logistics and Supply Chain Congress December 01-02, 2016, Izmir, TURKIYE
LM-SCM 2016
XIV. INTERNATIONAL LOGISTICS
AND SUPPLY CHAIN CONGRESS
PROCEEDINGS
1-2 December 2016
Izmir, TURKEY
Editors:
Ural Gökay ÇİÇEKLİ
Yunus KAYMAZ
Ege University
Faculty of Economics and Administrative Sciences
SCIENTIFIC ADVISORY BOARD
Aleksandra Laskowska-Rutkowska, Lazarski University, Poland
Ali Ihsan Ozdemir, Epoka University, Albania
Alok Choudhary, University of Sheffield, UK
Alp Üstündag, Istanbul Technical University, Turkey
Alptekin Erkollar, University of Klagenfurt, Austria
Altan Ozkil, Atilim University, Turkey
Anna Saniuk, University of Zielona Góra, Poland
Artur Swierczek, University of Economics in Katowice, Poland
Avni Zafer Acar, Piri Reis University, Turkey
Aydın Kocak, Ege University, Turkey
Ayhan Ozgur Toy, Bilgi University, Turkey
Bart Jourquin, Catholic University of Louvain, Belgium
Bernd Noche, Duisburg-Essen University, Germany
Birdogan Baki, Karadeniz Technical University, Turkey
Bulent Catay, Sabanci University, Turkey
Burak Capraz, Ege University, Turkey
Burcu Aracıoğlu, Ege University, Turkey
Cengiz Kahraman, Istanbul Technical University, Turkey
Christoph Glock, University of Wuerzburg, Germany
Dagmar Caganova, Slovak University of Technology in Bratislava, Slovakia
Danuta Kirsperska-Moron, Karol Adamiecki University, Poland
Deniz Türsel Eliiyi, Yaşar University, Turkey
Dilay Celebi, Istanbul Technical University, Turkey
Dimitrios V. Lyridis , National Technical University of Athens, Greece
Dorota Burchart-Korol, Central Mining Institute, Poland
Enver Yucesan, Insead, France
Erdal Nebol, Yeditepe University, Turkey
Esther Alvarez, University Of Deusto, Spain
Fabrizio Dallari, Università C. Cattaneo, Italy
Farouk Yalaoui, University of Technology of Troyes, France
Fatih Tasgetiren, Yasar University, Turkey
Ferhan Cebi, Istanbul Technical University, Turkey
Frank Straube, Technical University of Berlin, Germany
Frank Witlox, Ghent University, Belgium
Gokalp Yıldız, Dokuz Eylul University, Turkey
Gulcin Buyukozkan, Galatasaray University, Turkey
Guler Bilen Alkan, Istanbul University, Turkey
Gulgun Kayakutlu, Istanbul Technical University, Turkey
Güner Gürsoy, Okan University, Turkey
Haluk Soyuer, Ege University, Turkey
Hans Otto Guenther, Seoul National University, Korea
Helena Vidova, Slovak University of Technology in Bratislava, Slovakia
Hür Bersam Bolat, İstanbul Technical University, Turkey
Huseyin Basligil, Yildiz Technical University, Turkey
Ilker Murat Ar, Karadeniz Technical University, Turkey
Ismail Capar, Texas A&M University, USA
Joanna Nowakowska-Grunt, Czestochowa University of Technology, Poland
Joanna Zarebska, University of Zielona Gora, Poland
Jorgen Kristiansen, Aalborg University, Denmark
Katarzyna Cheba, West Pomeranian University of Technology, Poland
Keti Ventura, Ege University, Turkey
Krzysztof Witkowski, University of Zielona Gora, Poland
Lenny Koh, University of Sheffield, UK
Levent Kandiller, Yaşar University
M. Cemali DİNÇER, Yaşar University
Maja Kiba-Janiak, Wroclaw University of Economics, Poland
Mariusz Szuster, Poznan University of Economics, Poland
Martin Straka, Technical University of Kosice, Slovakia
Mathieu Van Vyve, Catholic University of Louvain, Belgium
Mehmet Sakir Ersoy, Beykoz University, Turkey
Mehmet Tanyas, Maltepe University, Turkey
Mesut Yavuz, University of Alabama, USA
Michael Grabinski, Neu-Ulm University, Germany
Michal Balog, Technical University of Kosice, Slovakia
Milos Cambal, Slovak University of Technology in Bratislava, Slovakia
Mine Omurgonulsen, Hacettepe University, Turkey
Murat Baskak, Istanbul Technical University, Turkey
Murat Kocamaz, Ege University, Turkey
N. Elif Kongar, Bridgeport University, USA
Nelson Oly Ndubisi, Griffith University, Malaysia
Nezih Altay, DePaul University, USA
Okan Tuna, Dokuz Eylül University, Turkey
Omer Ozturkoglu, Yasar University, Turkey
Onur Ozveri, Dokuz Eylul University, Turkey
Ozalp Vayvay, Marmara University, Turkey
Ozgur Kabadurmus, Yasar University, Turkey
Ozgur Kabak, Istanbul Technical University, Turkey
Pawel Kuzdowicz, University of Zielona Gora, Poland
Per Agrell, Catholic University of Louvain, Belgium
Radim Lenort, Skoda Auto University, Czech Republic
Rainer Leisten, University of Duisburg-Essen, Germany
Rene De Koster, Erasmus University, Netherland
Sebastian Saniuk, University of Zielona Gora, Poland
Semra Birgün, Beykent University
Serpil Erol, Gazi University, Turkey
Seyda Serdar Asan, Istanbul Technical University, Turkey
Stefan Seuring, Kassel University, Germany
Soner Esmer, Dokuz Eylul University, Turkey
Tolga Bektas, Southampton University, UK
Turan Paksoy, Selcuk University, Turkey
Ugur Ozcan, Gazi University, Turkey
Umut R. Tuzkaya, Yildiz Technical University, Turkey
Ural Gökay Cicekli, Ege University, Turkey
Urszula Bąkowska-Morawska, Wroclaw University of Business, Poland
Vahap Tecim, Dokuz Eylul University, Turkey
Vedat Verter, Mcgill University, Canada
Y. Ilker Topcu, Istanbul Technical University, Turkey
Yiğit Kazançoğlu, Turkey
Yildirim Omurtag, Robert Morris University, USA
Yucel Ozturkoglu, Yasar University, Turkey
Zahir Irani, Brunel University, UK
HONORARY CHAIR OF THE CONGRESS
Prof. Dr. Cüneyt Hoşcoşkun
Rector of Ege University
CONGRESS CHAIR
Prof. Dr. Haluk SOYUER
Ege University
Faculty of Economics and Administrative Sciences
Departments of Business Administration
CONGRESS CO-CHAIR
Prof. Dr. Mehmet TANYAŞ
ORGANIZING COMMITTEE
Prof. Dr. Haluk Soyuer
Prof. Dr. Mehmet Tanyaş
Prof. Dr. Gülçin Büyüközkan
Assoc. Prof. Dr. Murat Kocamaz
Assist. Prof. Dr. Aydın Koçak
Assist. Prof. Dr. Ural Gökay Çiçekli
LOCAL ORGANIZING COMMITTEE
Assoc. Prof. Dr. Keti Ventura
Assist. Prof. Dr. Burcu Aracıoğlu
Res. Assist. Dr. Ali Erhan Zalluoğlu
Res. Assist. Fatma Demircan Keskin
Res. Assist. Yunus Kaymaz
Res. Assist. İnanç Kabasakal
CHAIR OF THE ORGANIZATION COMMITTEE
WHICH LOGISTICS PERFORMANCE INDICATOR INFLUENCE
EXPORT MOST? A SCENARIO ANALYSIS BASED APPROACH
Özgür Kabak
1, Şule Önsel Ekici
2, Füsun Ülengin
3Abstract ⎯ This study aims to investigate the relationship between logistics performance and exports and attempts to answer the question of which logistics indicators especially influence the country’s export level. For this purpose, a scenario analysis-based approach is proposed to analyze the relationships between exports and the six indicators of the logistics performance index reported by World Bank every two years: customs, infrastructure, international shipments, logistics quality and competence, tracking and tracing, and timeliness. A novel mathematical model is proposed in order to find an eligible number of scenarios, and the results of this proposed model are used to determine the most important logistics performance indicators that influence the export level of the country. Finally, Turkey is selected as a case study, and possible scenarios are investigated for Turkey to suggest policy proposals in order to improve its export.
Keywords ⎯ Export, Logistics Performance, Scenario Analysis
INTRODUCTION
As the backbone of international trade, logistics encompasses freight transportation, warehousing, border clearance, payment systems and many other functions that are mostly performed by private service providers for private traders and owners of goods. However, logistics is also important for the public policies of national governments and regional and international organizations [1]. If a country can obtain a competitive advantage in terms of logistics performance, then there will be an increase in its international trade, helping to open new markets and encouraging business. Country-based logistics performance evaluation will also help understand the relative position of the country and provide a guide on deciding which areas to focus on, such as infrastructure, services, procedures and regulations, to improve the logistics performance level. Companies with access to high-quality cost-efficient logistical capabilities can often outsource certain logistics tasks and devote fewer internal resources to these tasks. The development of the logistics sector is expected to have a positive impact on increasing production, consumption and trade and thus stimulating the economic growth. Better infrastructure will also contribute to attracting foreign direct investment [2]-[5].
A number of studies have been conducted to identify the impact of logistics on increasing international trade. Gupta el al. [6] use a series of semi-structured interviews with 35 logistics and related firms operating in Association of Southeast Asian Nations (ASEAN). Their analysis reveal that the custom authorities of some countries require a large number of documents which increases the inefficiency in the documentation process at the customs and, thus, result with custom-related barrier to international trade. Inconsistency of many customs officials in goods inspection, different classification of goods, lack of border crossing coordination, inefficient inbound clearance process, arbitrary independent rulings, volatility in border traffic, multiple uncoordinated offices and improper penalties are other similar barriers. They also reveal the importance of foreign investment-related barriers such as discriminatory licensing, as well as mode specific barriers.
Portugal-Perez and Wilson underline that trade facilitation does not only include border- related issues but also beyond the border issues such as business environment, the quality of infrastructure, transparency and domestic regulations [7]. They estimate the impact of aggregate indicators of soft and hard infrastructure on the export performance of developing countries. They use factor analysis to obtain
1 Özgür Kabak, ITU, Faculty of Management, Department of Industrial Engineering, Istanbul, Turkey, [email protected] 2 Şule Önsel Ekici, Doğuş University, Faculty of Engineering, Industrial Engineering, Istanbul, Turkey, [email protected] 3 Füsun Ülengin, Sabancı University, School of Management, Istanbul, Turkey, [email protected]
aggregate indicators and they adapt a gravity model to incorporate hard and soft infrastructure of an exporter as part of trade costs.
Saslavsky and Shepherd [8] found that logistics performance is particularly important for trade among the developing countries in the Asia-Pacific region. They use a gravity model to investigate the relationships between logistics performance and the growth international production networks. They found that trade in parts and components is more sensitive to improvements in logistics performance than the trade of final goods.
Lean et al. [9] use Granger causality analysis to show that economic growth Granger-causes logistics output. In other words, economic development result with more demand for logistics services and leads to logistics development. According to the results, the improvement of transport conditions will help to increase the development of the economy. Improved land transport conditions to lead to economic development through reducing travel time and cost, increasing access of the producers to distant markets, reducing inventory and attracting investment. There is also a feedback effect. The improvement of transport network will increase the economic growth and the economic growth, in its turn, will cause the development of transport infrastructure.
The Logistics Performance Index (LPI) is a very commonly used index for evaluating the logistics performance of the countries. The index evaluates the performance of 160 countries based on six areas, namely; customs, infrastructure, international shipments, logistics quality and competence, tracking and tracing and timeliness [1, 10]. LPI is a comprehensive index created to help countries identify the challenges and opportunities they face in trade logistics performance [11]. The World Bank and the Turku School of Economics have administered the index every two years since 2007, rating countries based on a scale of 1 (worst) to 5 (best) [1]. LPI is a good indicator of trade facilitation for a broad group of countries. Marti et al. [12] analyze the impact that the LPI and each of its components have on trade in emerging countries with a maritime boundary using a gravity model. By incorporating the LPI into a gravity model, they were able to quantify how important this indicator is for the export flow of the emerging countries.
Jhawar et al. [11] classify the factors that influence the logistics performance index as enablers and results and use a causal loop diagram and system dynamics model to show that in the Indian logistics sector, investment done in human resources, which is one of the enablers, will improve the logistics performance.
Puertas et al. [13] estimate several gravity equations using LPI and its components as proxy variables of trade facilitation. Their estimation using the two-stage Heckman model for all the 26 EU countries for 2005 and 2010 show that logistics is more important for exporting nations than importing nations and especially the Competence and Tracking has greater importance in recent years due to weak domestic demand in European countries after the crisis and the search for new international markets. Banomyong et al. [14] propose policies and integration roadmap for the ASEAN logistics sector based on survey results from seven logics sectors, namely; ports, rail, road, inland waterway, air and logistics service providers.
Most of the studies that have been conducted so far, either focus on a limited number of countries or use deterministic forecasting models to observe the impact of logistics on the improvement of trade or economic development. The basic drawbacks of such models are that they typically provide a single prediction and that they do not include qualitative systemic change [15]. Indeed, particularly for long-term planning, backcasting, scenario analysis and foresight techniques are accepted as suitable for providing information to logistics and transportation decision makers in highly uncertain future conditions [16].
That is why, in this study, to analyze the interaction between logistics and exports, a scenario analysis approach is proposed. It is necessary to understand logistics performance at the country level to better evaluate and target trade and transport facilitation policy efforts over time and across countries. The main contribution of this study is the use of objective information rather than subjective expert judgments to evaluate the consistency of the scenarios which is the most important property of an
different, consistent and efficient scenarios. Based on the selected scenarios, a new approach is suggested to specify the most important logistics indicators that have the greatest impact on exports. The next section presents the methodology and its application to analyze the interaction between logistics and export. results of the application of the proposed methodology and provides an example for Turkey through an interpretation of the results to highlight which key areas of logistics should be improved in the first run to obtain the highest increased in Turkey’s export level. Finally, conclusions are given.
INTERACTION BETWEEN LOGISTICS AND INTERNATIONAL TRADE
In this research, in order to analyze the interaction between logistics performance indicators and export level, a scenario-based methodology proposed in Kabak et. al. [18] is applied.
As is underlined in the introduction section, most of the studies in the literature focus on transport infrastructure, only analyzing the impact of logistics on international trade. However, logistics should be investigated from a wider perspective. For this reason, in this study, the LPI is used to represent countries’ logistics performance.
Scenario analysis provides an important tool in the strategic planning process. Scenarios are not forecasts, but they give an internally consistent view of what the future may be. Scenario analysis has emerged as a useful tool for long-term planning when the future is perceived as being subject to a high degree of uncertainty and complexity [19]. The internal consistency of the scenarios is of primary importance. Indeed, long-term planning necessitates an understanding of multidisciplinary connections among several factors, such as demographic, technological, economic and political developments. However, the human mind is limited in mentally processing these interdependencies [20]. Therefore, different scenario analysis techniques are developed. Scenario analysis consists of phases of problem analysis, system analysis and synthesis. Problem analysis helps the related experts and shareholders have a common understanding of the problem at hand. System analysis defines the problem as a set of interrelated subsystems, identifying the relevant external influences on the investigated problem. Brainstorming, brain-writing, the Delphi technique etc. can be used for these two stages. Finally, the process of synthesis is used to examine the interdependencies among the influencing factors and to develop scenarios. For this last stage, two different groups of methods are generally proposed; Non-Bayesian methods (e.g., Morphological Analysis, Battelle Approach, Field Anomaly Relaxation) and Bayesian Methods (e.g., Cross-Impact Analysis and Goal Programming) (for a detailed overview of these techniques, see [19], [21] and [22]).
Developing a small number of scenarios that represent possible states of a system is another appealing alternative. Scenario analysis provides an important tool in the strategic planning process. A scenario is a plausible description of some future state with no statement of probability. Scenarios are alternative pictures of how the future may develop. They are used to highlight the consequences and thus provide a basis for policies that may influence future developments or help governments to address future issues. Projections are sets of future conditions based on different scenarios.
A scenario selection method that yields consistent scenarios and that supports the quality of scenario analysis is desirable. Indeed, inconsistent scenarios draw no realistic image of the future. Therefore, scenario selection should take into consideration the following rules [15]:
Significantly different scenarios: The decision maker is interested in a set of principally
possible cases, and small differences between scenarios are not very relevant.
A small number of scenarios: The main reason for having a small number of scenarios
is that decision makers can hardly compare numerous qualitatively different scenarios
and a large number of scenarios may indicate a large redundancy.
A reliable set of scenarios: Different scenario analysts should arrive at the same results
when they use different scenarios based on the same scenario selection procedure.
Efficient scenarios: These are the most consistent scenarios within a group of similar scenarios. In this research, taking into consideration the above-given rules, an approach proposed in Kabak et al. [18] is used for scenario selection.
Data used for the analysis
Scenario analysis procedure proposed in Kabak et al. [18] enables the use of objective data instead of expert opinions. For the application of the procedure to the interaction between logistics and export, the logistics performance indicators and export levels of 154 countries in 2007, 2010, 2012, 2014 and 2016 are used. 717 cases are taken into consideration (notice that only the available data series of the countries are used). The related LPI indicator data are provided from World Bank’s webpage (http://lpi.worldbank.org/).
To specify the level of the variables, a 5-term linguistic set, defined as Very High (VH), High (H), Medium (M), Low (L), and Very Low (VL), is used.
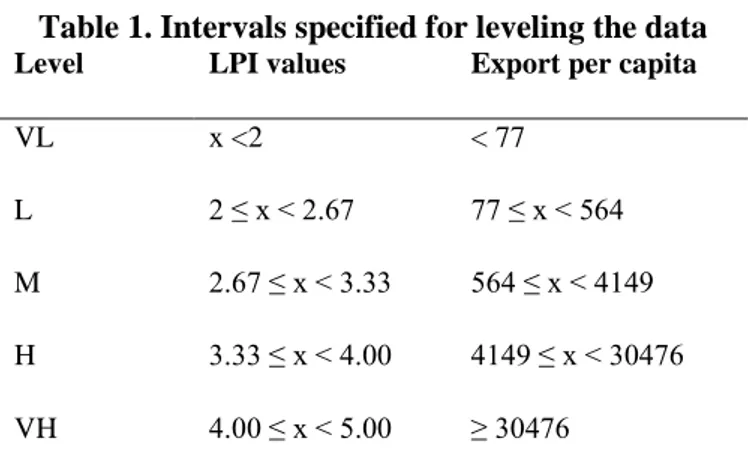
The LPI indicators are measured on a scale of 1 (worst) to 5 (best) where values lower than 2 and higher than 4 are considered very low and very high, respectively. Therefore, the values corresponding to the LPI indicators are divided into five categories, as shown in Table 1, where values lower than 2 are classified as VL, higher than or equal to 4 as VH, and the values in between are dived into three equal intervals.
The export variable is measured by exports per capita to avoid any bias that may occur due to the population size of the country. The data (exports of goods and services (BoP, current US$) and Population, total) provided by the World Bank database (http://data.worldbank.org/) are used to construct the export data. When the data are analyzed, it is observed that the data are highly skewed (skewness = 5.74). For this reason, a logarithmic transformation is applied to the data to obtain a more symmetric distribution (skewness drops to -0.04). Finally, the categorization is made based on the final transformed data by dividing entire range into five equal intervals (see Table 1.).
Table 1. Intervals specified for leveling the data
Level LPI values Export per capita
VL x <2 < 77
L 2 ≤ x < 2.67 77 ≤ x < 564 M 2.67 ≤ x < 3.33 564 ≤ x < 4149 H 3.33 ≤ x < 4.00 4149 ≤ x < 30476 VH 4.00 ≤ x < 5.00 ≥ 30476
By transforming the data to linguistic levels, we had 717 different scenarios to be analyzed, examples of the data are given in Table 2.
Table 2. Examples of scenarios
Country Series
Customs Infrastructure International Shipment Logistics quality and Competence Tracking and Tracing Timeliness Export Germany 2016 VH VH H VH VH VH H Luxembourg 2016 H VH VH VH VH VH VH Sweden 2016 H VH VH VH VH VH H Netherlands 2016 VH VH H VH VH VH VH … Sierra Leone 2007 VL VL VL VL L L VL Djibouti 2007 VL VL L L VL L L Tajikistan 2007 VL L L VL VL L L Rwanda 2007 VL VL VL VL VL L VL Consistency
The key issue in projecting the future by scenario analysis is the consistency of the scenarios produced [17]. The consistency of a scenario is estimated by assessing the consistency of the levels of all pairs of impact factors [15]. The consistency analysis is the core part of a formative scenario analysis because inconsistent scenarios do not draw any realistic image of the future. In consistency analysis, a scenario is taken as a set of system variables, each of which being allowed to take only a small number of different levels. However, the resulting combinatorial set of scenarios may be very large. Therefore, a scenario selection method that yields a consistent, reliable, different and small number of scenarios is generally desirable [15].
In the literature, consistency is based on a specific scale, the consistency indicator. However, the consistency rating of all pairs of impact variables is performed by the experts. Subsequently, these ratings, which are summarized in the consistency matrix, are formed, and different indicators, such as overall consistency, multiplicative consistency, the number of inconsistencies and the minimum consistency level of a scenario, can be calculated (for the calculation details and characteristics of these indicators, see [15].
In this research, instead of relying on experts, the consistency of a scenario as a whole is estimated by assessing the consistency of the levels of all pairs of variables. The frequency of the levels of variables generated from past data is used to determine the consistency. The consistency of the levels of a pair of variables is calculated by the following formula:
𝑐 (𝑦𝑖𝑚𝑖, 𝑦 𝑗 𝑚𝑗 ) = max (𝑓 (𝑦𝑖 𝑚𝑖 , 𝑦𝑗𝑚𝑗) 𝑓(𝑦𝑖𝑚𝑖) ; 𝑓 (𝑦𝑖𝑚𝑖, 𝑦 𝑗 𝑚𝑗 ) 𝑓 (𝑦𝑗𝑚𝑗) )
where i , j = 1,...,7 are the impact variables (1: Customs, 2: Infrastructure, 3: International Shipment, 4: Logistics quality and Competence, 5: Tracking and Tracing, 6: Timeliness, 7: Export) , and m is an index for linguistic terms to state the levels of the variables (mi {VL, L, M, H, VH }) ;
𝑓 (𝑦𝑖𝑚𝑖, 𝑦
𝑗 𝑚𝑗
) is the number of scenarios where the level of variable i is 𝑚𝑖 and the level of variable j is 𝑚𝑗; and
𝑓(𝑦𝑖𝑚𝑖) is the number of scenarios where the level of variable i is 𝑚𝑖.
For instance; in our evaluation;
𝑓(𝑦1M, 𝑦2L) = 26 (the number of scenarios where Customs is “Medium” and Infrastructure is “Low”) 𝑓(𝑦1M) = 167 (the number of scenarios where Customs is “Medium”)
𝑓(𝑦2L) = 334 (the number of scenarios where Infrastructure is “Low”)
Therefore; 𝑐(𝑦1M, 𝑦2L), the consistency of “Customs is Medium and Infrastructure is Low” is calculated as follows: 𝑐(𝑦1M, 𝑦2L) = max ( 𝑓(𝑦1M, 𝑦2L) 𝑓(𝑦1M) ;𝑓(𝑦1 M, 𝑦 2L) 𝑓(𝑦2L) ) = max (26 167; 26 334) = 0.156 .
The consistencies are calculated similarly for all pairs of variables for all levels.
The consistency of a scenario 𝑆𝑘 = (𝑦1 𝑚1, 𝑦
2
𝑚2, … , 𝑦
7
𝑚7) is calculated based on the consistency of the
levels of a pair of variables as follows:
𝐶(𝑆𝑘) = min𝑗=1,…7, 𝑖=2,…7, 𝑖>𝑗 𝑐 (𝑦𝑖𝑚𝑖, 𝑦 𝑗 𝑚𝑗 ) For instance;
𝑆268= (𝑦1M, 𝑦2L, 𝑦3M, 𝑦4M, 𝑦5M, 𝑦6H, 𝑦7L) = 𝑀𝑖𝑛 ( 𝑐(𝑦1M, 𝑦2L), 𝑐(𝑦1M, 𝑦3M), 𝑐(𝑦1M, 𝑦4M), 𝑐(𝑦1M, 𝑦5M), 𝑐(𝑦1M, 𝑦6H), 𝑐(𝑦1M, 𝑦7L), 𝑐(𝑦2L, 𝑦3M), 𝑐(𝑦2L, 𝑦4M), 𝑐(𝑦2L, 𝑦5M), 𝑐(𝑦2L, 𝑦6H), 𝑐(𝑦2L, 𝑦7L), 𝑐(𝑦3M, 𝑦4M), 𝑐(𝑦3M, 𝑦5M), 𝑐(𝑦3M, 𝑦6H), 𝑐(𝑦3M, 𝑦7L), 𝑐(𝑦4M, 𝑦5M), 𝑐(𝑦4M, 𝑦6H), 𝑐(𝑦4M, 𝑦7L) 𝑐(𝑦5M, 𝑦6H), 𝑐(𝑦5M, 𝑦7L) , 𝑐(𝑦6H, 𝑦7L) ) = 𝑚𝑖𝑛 ( 0.156, 0.749, 0.719, 0.605, 0.695, 0.108 0.437, 0.35, 0.47, 0.234, 0.701, 0.796 0.731, 0.682, 0.335, 0.721, 0.652, 0.192 0.592, 0.24, 0.126 ) = 0.108
With a similar approach, we have calculated consistency of the all possible scenarios considering the combinations of levels of variables. As a result, 57 = 78,125 (i.e., 7 variables and 5 linguistic terms)
scenarios are identified, and their consistencies are calculated. Calculated consistency of the most scenarios are zero, therefore we’ve kept scenarios with non-zero consistency (a total of 1421 scenarios) for further evaluations.
Neighborhood
To have significantly different and efficient scenarios, the closeness of the scenarios must be considered. We used the neighborhood definition between scenarios based on their closeness to each other to ensure that neighbor scenarios are not selected in the final set of scenarios.
To define the neighborhood relation, the following generic rules are proposed: Neighborhood rules:
1) Two scenarios
differ
at most in the 2 variables;
2) The total linguistic variable difference is at most 3;
3) The linguistic variable difference in the variable “export” is at most 1;
The first rule defines the neighborhood based on the number of different variable levels. The second and the third rules are based on the distance between the variable levels. The second rule considers the total difference, whereas the third rule is for the difference between “export” variable. We have added the third rule since the export is the variable of interest in our application.
According to these rules, the distance between the scenarios is calculated as follows:
𝑑(𝑆𝑘, 𝑆𝑙) = 𝑀𝑎𝑥 ( ∑ {1 𝑖𝑓 𝑦𝑖(𝑆𝑘) ≠ 𝑦𝑖(𝑆𝑙) 0 𝑜𝑡ℎ𝑒𝑟𝑤𝑖𝑠𝑒 7 𝑖=1 2 , ∑7𝑖=1|𝑦𝑖(𝑆𝑘) − 𝑦𝑖(𝑆𝑙)| 3 , |𝑦𝑖(𝑆𝑘) − 𝑦𝑖(𝑆𝑙)|)
A scenario 𝑆𝑘 is a neighbour of scenario 𝑆𝑙 if 𝑑(𝑆𝑘, 𝑆𝑙) ≤ 1.
We have calculated the neighborhood relation of the 1421 scenarios in pairwise manner and identified the 68,934 neighbor scenario pairs.
As the final stage of scenario selection we used a mathematical programming model as suggested in Kabak et al. [18]. The objective of using a mathematical model in the scenario selection is to eliminate the heuristic perspective that is used in [7] and thus provide an optimum scenario set.
In this study, we use the following mathematical program to select a small set of efficient and consistent scenarios: 𝑀𝑎𝑥 ∑ 𝐶(𝑆𝑘) 𝑘 𝑥𝑘 subject to 𝑥𝑘+ ∑ 𝑁𝑙 𝑘𝑙𝑥𝑙≤ 1 𝑘 = 1, … ,1421 𝑥𝑘 ∈ {0, 1} 𝑘 = 1, … ,1421
where 𝐶(𝑆𝑘) is the consistency of scenario Sk;
Nkl is a binary parameter to indicate whether scenario k and l are neighbors; and xk is a binary variable to identify whether scenario k is selected or not.
This model is designed to have the basic properties of a well-organized scenario, i.e., being consistent, being significantly different, being efficient, having a small number and having a reliable set of scenarios. The objective function maximizes the total consistency of the selected scenarios. Significantly different and efficient scenarios are gathered by the first constraint. The reliability of the scenarios is ensured by checking the alternative solutions.
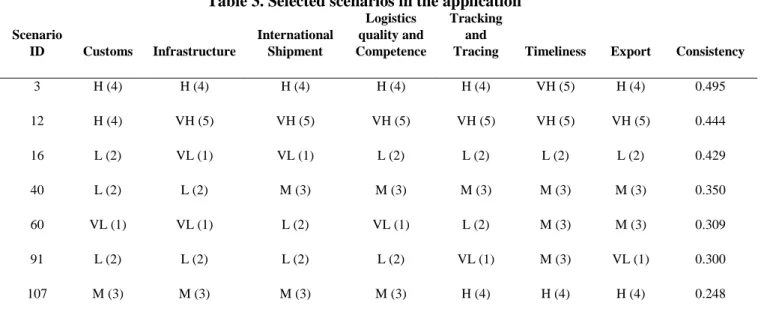
When the proposed mathematical program is applied using the consistencies and neighborhood relations in order to select the scenarios, 16 scenarios are selected, as shown in the following Table 3.
Scenario Evaluation
After finding the consistent and efficient scenarios, these 16 scenarios are evaluated to show the interaction between logistics performance and export. For this, the average level of the logistics variables for each particular export level is calculated, and the weighted sum of the logistics variables is specified. The consistency of each scenario is considered to be its importance weight of the selected scenarios for each export level. The results are presented in the Table 4, which shows that, for instance, because scenarios 91, 137 and 963 have a VL export level, the weighted sum of these three scenarios are calculated etc.
Table 3. Selected scenarios in the application Scenario ID Customs Infrastructure International Shipment Logistics quality and Competence Tracking and
Tracing Timeliness Export Consistency
3 H (4) H (4) H (4) H (4) H (4) VH (5) H (4) 0.495 12 H (4) VH (5) VH (5) VH (5) VH (5) VH (5) VH (5) 0.444 16 L (2) VL (1) VL (1) L (2) L (2) L (2) L (2) 0.429 40 L (2) L (2) M (3) M (3) M (3) M (3) M (3) 0.350 60 VL (1) VL (1) L (2) VL (1) L (2) M (3) M (3) 0.309 91 L (2) L (2) L (2) L (2) VL (1) M (3) VL (1) 0.300 107 M (3) M (3) M (3) M (3) H (4) H (4) H (4) 0.248
137 VL (1) VL (1) VL (1) VL (1) VL (1) VL (1) VL (1) 0.217 379 L (2) L (2) L (2) L (2) L (2) H (4) H (4) 0.084 667 M (3) M (3) L (2) M (3) L (2) M (3) L (2) 0.048 915 M (3) H (4) H (4) M (3) M (3) M (3) VH (5) 0.021 963 VL (1) VL (1) M (3) L (2) M (3) H (4) VL (1) 0.017 1106 M (3) H (4) M (3) H (4) M (3) H (4) L (2) 0.008 1128 H (4) M (3) M (3) L (2) L (2) M (3) VH (5) 0.008 1182 H (4) M (3) L (2) L (2) M (3) VH (5) M (3) 0.008 1239 L (2) M (3) H (4) L (2) H (4) H (4) L (2) 0.008
Table 4 shows that there is a direct relationship between the logistics indicators and exports, which supports the basis on which our research is built. For example, when the export level is VH, then infrastructure, International shipments, logistics quality and competence, tracking and tracing, and timeliness are VH (i.e., >4.5) and level of the customs is H (i.e., >3.5) and when export level is VL then level of all variables except timeliness are very low or low (i.e., <2). Figure 1 shows the logistic indicator values for export levels
Table 4. Weighted average level of variables for the levels of export
Export Level
Related
Scenarios Customs Infrastructure
International Shipment Logistics quality and Competence Tracking
and Tracing Timeliness
VL – Very Low 91, 137, 963 1.56 1.56 1.62 1.59 1.06 2.22 L – Low 16, 667, 1106, 1239 2.11 1.28 1.18 2.13 2.05 2.16 M – Medium 40, 60, 1182 1.56 1.55 2.52 2.06 2.54 3.02 H – High 3, 107, 379 3.50 3.50 3.50 3.50 3.80 4.60 VH – Very High 12, 915, 1128 3.96 4.92 4.92 4.86 4.86 4.88 TURKEY Export level – M M (3) H (4) H (4) M(3) H(4) H(4) Difference to Export H level 0.50* -0.50 -0.50 0.50* -0.20 0.60* Difference to Export VH level 0.96* 0.92* 0.92* 1.86* 0.86* 0.88*
Figure 1. Logistic indicator values for export levels.
POLICY SUGGESTIONS FOR TURKEY
After evaluating the scenarios for specific export levels, Turkey is selected as an example to show how these values are used for policy development. As an important logistics center in Europe, Turkey exhibits high trade values with its regional partners and has a large population, diversified economy and strategic geographical location. It is considered a critical actor in the trade between Europe, the Commonwealth of Independent States (CIS) and the Middle East [23]. Turkey is ranked 30th out of 160 countries in the LPI 2014, and 34th out of 160 countries in LPI 2016. Given its current status, it is above the average of the upper middle income economies to which it belongs. Although Turkey’s LPI score showed a significant increase of approximately 9% from 2010 to 2012, it remains stable since 2012, whereas it decreased slightly from 2014 to 2016 [1, 10] (see Figure 2).
Figure 2. Turkey’s logistics indicator values through the years.
The indicators that Turkey must focus on are investigated by comparing Turkey’s current level of exports (M) with the H and VH levels of exports. The results show that Turkey should improve all
0,00 1,00 2,00 3,00 4,00 5,00 6,00
Customs Infrastructure International Shipment Logistics quality and Competence Tracking and Tracing Timeliness
Very Low Low Medium High Very High
0 0,5 1 1,5 2 2,5 3 3,5 4 4,5
LPI Customs Infrastructure International shipments Logistics quality and competence Tracking and tracing Timeliness
TURKEY
2007 2010 2012 2014 2016logistics indicators to achieve a VH level of exports but should particularly focus on customs, logistics
quality and competence, and timeliness for a H level of exports (see the last two rows of Table 4).
This result is slightly different when compared to the results of the period 2014 and before [18]. The basic difference is that logistics quality and competence is suggested to focus on instead of international shipment. In fact, this change is understandable since during the transition from 2014 to 2016 Turkey made a sufficient level of improvement in International Shipment (from 3.18 to 3.41 respectively) whereas there has been a significant decline in logistics and quality (from 3.64 to 3.31).
Export supply chains typically face fewer procedural burdens than imports, as evienced by the shorter lead time for exports than for imports. Customs is not the only agency involved in border management; collaboration among all border management agencies and the introduction of modern approaches to regulatory compliance are especially important. Indicators of red tape also illustrate a lack of coordination at the border and the burden it imposes on private logistics operators. Turkey must reduce the number of government agencies and the documentary requirements. Turkey must also improve its connectivity to the market through the hierarchical hub-and-spoke network of international trade. Another problem related to the international transportation of Turkey is the quotas and transit procedures that make the movement of goods possible with the payment of duties and excessive control.
Timeliness measures the punctuality of shipment delivery times. Due to the existing high level of competition, timeliness is an important factor for consideration, and failure to comply with delivery schedules is unacceptable [12]. Logistics service providers are generally required to submit import/export documentation at the custom border of the respective country. When there is a lack of full automation electronic data interchange (EDI), the documentation lacks efficiency and a large number of documents are required to be completed. Additionally, there is a lack of documentation format as well as the lack of transparent regulations. All these issues result with a consumption of a large dwell time [6]. Number of documents to export/import as well as the number of days to export/import will directly influence the timeliness. The logistics system should have efficiently coordinated custom offices and border coordination and clear rules for customs. Similarly the latest ICT technology should be provided [7].
Logistics quality and competence is also of crucial importance for trade facilitation. The parties within logistics organizational structure should be efficiently coordinated to increase the quality of service to the customer. It is also necessary to optimize the relationship between organizations and consumers. In fact, the logistics quality and competence that reflect the performance of private sector in particular acquired greater importance for export flows following the financial crisis from 2007 onwards. This is not only valid for Turkey but also for many European countries facing weak domestic demand and searching for export markets [13]
CONCLUSIONS AND FURTHER SUGGESTIONS
Globalization and increased competitiveness resulted made logistics one of the key elements in international trade. Efficient logistics services guarantee safe and high speed movement of products, facilitate the mobility of products and reduce the trade cost among the countries. Therefore it is of crucial importance to provide policymakers information about which factors to focus on and help them to prepare a tentative prioritization of their efforts in order to increase the logistics performance of their country. This study makes two contributions. First, a novel scenario-based methodology is proposed based on the LPI levels of the countries for 154 countries in 2007, 2010, 2012, 2014 and 2016 are used. Indeed, the most important part of scenario analysis is generating a consistent, reliable, different and small set of scenarios. For this purpose, in this paper a mathematical model is proposed for scenario generation.
Because a scenario is a combination of n impact variables that have m possible levels, different combinations of these variables do not generate consistent scenarios each time. For this reason, a consistency check is initially required in the scenario generation procedure. However, in the literature, these consistency checks have been performed using expert judgments, which are subjective in nature.
Another factor that is very important in the scenario generation procedure is obtaining a small number of consistent scenarios. The literature suggests using a neighborhood distance to achieve this goal. However, calculating the size of differences between two levels is impossible with a number of variables that is on a nominal scale (which is the general case in the literature). To obtain a final set of scenarios,
three different procedures are used: the local efficiency, distance-to-selected and max-min selection procedures [15]. Nevertheless, all of these procedures depend on consistency scores, which, as stated above, are subjective in nature.
In this study, we propose using a mathematical model to select a small set of efficient and consistent scenarios. Initially, different from the studies found in the literature, we propose calculating consistency with a completely objective method based on observed frequencies of levels of variables. In addition, because we use an ordinal scale to generate scenarios, simply taking the difference between two levels of a variable is an easy and efficient method that we use in the neighborhood calculation step. Subsequently, the research proposes a method to determine the most important variables to focus on to improve the variable of interest in relation to its target value. This task is performed by finding the scenarios that provide the target level for this variable and obtaining the weighted average of the levels of the other variables. In this manner, it becomes possible to find the variables that are important for improving a specific variable.
The second contribution of this research is the use of the proposed methodology to analyze the interaction between a country’s logistics performance and its export performance. For this purpose, six LPI indicators and the export level of countries are used to find the interactions between them.
Subsequently, 16 different and efficient scenarios are generated based on the proposed methodology. After the identification of the scenario set, Turkey has been selected as a case study. The detailed analysis of the scenarios shows that Turkey should improve all logistics indicators to achieve a very high (VH) level of exports but should particularly focus on customs, logistics quality and competence, and timeliness to reach a high (H) level.
The scenario results are interpreted for Turkey selected as case. Study. The relationship between Turkey and its export level is worth examining not only because its own future policies depend on specifying the basic logistics performance indicators to focus on but also, it will be a good example for other developing countries. The results obtained in this paper show that the indicators to focus on changed slightly from international shipments and infrastructure to timeliness and logistics quality and competence. This is especially due to the high level of investment on infrastructure as well as international shipment activities that have been realized until 2016. As a further suggestion, there is a need for future research to conduct similar analysis for different countries and in temporal contexts. It is also necessary to show the mechanism through which improvement in specific logistics indicators will induce trade growth in the related country. The methodology could also be replicated in different regions of the world in need of regional logistics development policy.
REFERENCES
[1] Arvis, J.-F., Mustra, M.A., Ojala, L., Stepherd, B. and Saslavsky, D. (2012) Connecting to Compete 2012: Trade Logistics in the Global Economy, World Bank.
[2] Lean, H.H., Huang, W., Hong, J. (2014), Logistics and economic development: Experience from China”, Transport Policy, 32, 96-104
[3] Barnister, D. and Berechman, Y. (2001), Transport investment and the promotion of economic growth, Journal of Transport Geography, 9(3), 209-218.
[4] Berechman, J., Ozmen, D., Ozbay, K. (2006), Empirical Analysis of Transportation, Investment and Economic Development at State, Country and Municipality Levels, Transportation, 33(6), 537-551 [5] Gunasekera, K., Anderson, W., Lakshmanan, T.R. (2008), Highway-Induced Development: Evidence
[7] Portugal-Perez, A. and Wilson, J.S. (2012), “Export Performance and Trade Facilitation Reform: Hard and Soft Infrastructure”, World Development Vol.40, No.7, pp.1295-1307
[8] Saslavsky , D., Shepherd, B. (2014), “Facilitating International Production Networks: The Role of Trade Logistics”, The Journal of International Trade& Economic Development, Vol. 23, No. 7, pp.979-999 [9] Lean, H.H., Huang, W., Hong, J. (2014), “Logistics and economic development Experience from China”,
Transport Policy, Vol. 32, pp.96-104
[10] Arvis, J.F., Saslavsky, D., Ojala L., Shepherd, B., Busch, C., Raj, A., Naula, T. (2016) Connecting to Compete 2016: Trade Logistics in the Global Economy, World Bank.
[11] Jhawar, A., Garg, S.K., Khera, S. (2014), “Analysis of the skilled work force effect on the logistics performance index-case study from India”, Logist. Res., vol. 7, No. 117, pp.1-10
[12] Marti, L., Puertas, R., Garcia, L. (2014), “The Importance of the logistics Performance Index in International Trade”, Applied Economics, Vol. 46, No. 24, pp.2982-2992
[13] Puertas, R., Marti, L., Garcia, L. (2014), “Logistics Performance and export competitiveness: European Experience”, Empirica, Vol. 41, pp.467-480
[14] Banomyong, R., Cook, P., Kent, P. (2008), “Formulating regional logistics development policy: the case of ASEAN”, International Journal of Logistics: Research and applications, Vol. 11, No.5, pp.359-379 [15] Tietje, O. (2005) Identification of a small reliable and efficient set of consistent scenarios, European
Journal of Operational Research, 162, pp.418-432.
[16] Schuckmann, S.W., Gnatzay, T., Darkow, I-L., Von der Gracht (2012), Analysis of factors influencing the development of transport infrastructure until the year 2030-A Delphi based scenario analysis, Technological Forecasting and Social Change, 79, 1373-1387.
[17] Pittock, A.B. (2009), Climate Change: The Science, Impacts and Solution, 2nd Edition, CSIRO Publishing, Australia
[18] Kabak, Ö., Ölsel Ekici, Ş., Ülengin, F. (2016), An analysis of logistics performance and export interaction: A novel scenario analysis-based approach, Transport Policy, under review.
[19] Nguyen, M.T., Dunn, M. (2009), Some methods for scenario Analysis in defence strategic planning, Australian Government Joint Operations Division Defense Science and Technology Organisation, DSTO-TR-2242
[20] Weimer-Jehle, W. (2006), Cross-impact balances: A system –theoretical approach to cross-impact analysis, Technological Forecasting and Social Change, 73, 334-361.
[21] Bishop, P., Hines, A., Collins, T. (2007), The Current State of Scenario Development: An overview of Techniques, Foresight, 9(1), 5-25
[22] Amer, M., Daim, T.U., Jetter, A. (2013), A Review of scenario planning, Futures, 46, 23-40.
[23] ITF (International Transport Forum) (2015) Drivers of Logistics Performance: Case Study of Turkey,
Corporate Partnership Board Report,