ORIGINAL PAPER
RISK FACTORS FOR URINARY INCONTINENCE AMONG ISTANBUL WOMEN: A
HOSPITAL BASED CASE-CONTROL STUDY
Nezihe Kizilkaya Beji
1, İlkay Güngör
2, Güliz Onat
3, Habibe Ayyildiz Erkan
4, Şule Gökyildiz
5, Önay
Yalçin
61Department of Nursing, Health Sciences Faculty, Biruni University, Istanbul, Turkey
2Department of Womenʼs Health and Gynecologic Nursing, Florence Nightingale Nursing Faculty, Istanbul University,
Istanbul, Turkey
3Department of Midwifery, Health Sciences School, KTO Karatay University Konya, Turkey
4Department of Urogynecology Clinic, Istanbul Medicine Faculty, Istanbul University, Istanbul, Turkey 5Department of Midwifery, Health Sciences School, Çukurova University, Adana, Turkey
6Department of Urogynecology Clinic, Istanbul Medicine Faculty, Istanbul University, Istanbul, Turkey
Received August 20, 2017; Accepted February 25, 2018. Copyright: This is an open access article distributed under the terms of the Creative Commons Attribution International License (CC BY). http://creativecommons.org/licenses/by/4.0/
Abstract
Aim: The study aimed to identify risk factors for urinary incontinence in women over 20 years of age in Istanbul. Design: The study was designed as a descriptive, retrospective, case control study. Methods: The study was conducted in a urogynecological unit at a university hospital in Istanbul. In total, 367 incontinent women who visited the urogynecological unit, and 401 continent women who visited outpatient clinics with other gynecological symptoms were included. Data were gathered via face-to-face interviews, using a questionnaire on risk factors for urinary incontinence. Adjusted odds ratios were given using logistic regression. Results: Variables which were found to be significantly different in chi-square analysis for urinary incontinence were age, education, marital status, number of pregnancies, birth and curettage, characteristics of first vaginal delivery (delivery mode, place, interventions), menopause, hormone therapy, history of gynecological operation, pulmonary disease, diabetes mellitus, hypertension, medicine use, constipation, flatus, hemorrhoids, herniated disc/varicose veins, stria during pregnancy, caffeine > 2 cups/day, body mass index (BMI ≥ 25 kg/m2),
weight gain ≥ 10 kg, fecal incontinence, and history of urinary incontinence in childhood, in patients’ mothers and relatives. When these variables were assessed in multivariate logistic regression analysis, number of births (“1-birth” OR = 38.8; CI = 2.2–669.5; “2-births” OR = 20.1; CI = 1.2–327.4; “≥ 3-births” OR = 35.0; CI = 1.9–621.8), BMI ≥ 25 kg/m2 (OR = 7.2;
CI = 2.1–24.1),and history of incontinence in mothers (OR = 7.2; CI = 1.3–37.2) were identified as significant risk factors. Conclusion: The main risk factors for urinary incontinence in the population under study were identified to be the number of births as an obstetric risk factor, obesity as a lifestyle factor, and ‘incontinence in mothers’ as a familial factor.
Keywords: pelvic floor, pelvic floor dysfunction, risk factors, urinary incontinence, urogynecology.
Introduction
Urinary incontinence (UI) is a significant health problem with psychological, social and hygienic effects on the lives of both women and their families (Hunskaar et al., 2004). As defined by the International Continence Society (ICS), UI is a complaint involving the involuntary leakage of urine. Urinary incontinence remains a worldwide problem affecting adult women across different cultures and races (Abrams et al., 2003). Prevalence rates vary: between 15–55% complain of lower
Corresponding author: Güliz Onat, Department of Midwifery, Health Sciences School, KTO Karatay University, Fetih Mah. Alaaddin Kap Cad. No: 130 42020 Konya, Turkey; e-mail: [email protected]
urinary symptoms (Mota, 2017). There are various factors which can cause incontinence, such as pregnancy, childbirth, obesity, menopause, or just inherent connective-tissue weakness. All of these factors can cause pathophysiological changes in the muscular and fascial structures of the pelvic floor, and lead to pelvic support defects and possibly pelvic floor dysfunction (Menezes, Pereira, Hextall, 2010). From a public health viewpoint, it is important to identify the risk factors for UI that might impair the quality of life of sufferers; identification of the risk factors will help women at risk to modify their lifestyle, which is important in the prevention and treatment of this disorder (Hsieh et al., 2008).
Urinary incontinence is a common and distressing condition which,whilst not life-threatening, is known to cause considerable morbidity. Causation is
multifactorial, although many risk factorshave been identified. According to Kılıç (2016), urinary incontinence has a significant correlation with number of children, genital prolapse, duration of delivery longer than 24 hours, diabetes, and urogenital infection, but not with age at the first and last childbirth, presence of episiotomy, birth weight over four kg, and smoking (Kılıç, 2016). This study attempted to determine the importance of aging, previous gynecological operations, diabetes mellitus (DM), hypertension (HT), body mass index (BMI), and other possible risk factors for urinary incontinence in the population under study, in order to help clinicians make decisions, and to implement preventive strategies to decrease the incontinence rate in the general population.
Aim
The aim of the study was to identify risk factors for urinary incontinence in women over 20 years of age who applied to the outpatient gynecology clinic and urogynecological unit of a university hospital in Istanbul.
Methods
Design
The study was designed as a descriptive, retrospective, case control study.
Sample
The study was conducted at Istanbul University, Faculty of Medicine between 2007 and 2009. 367 incontinent women and 401 continent women were invited to participate in the study. The sample of the study included 367 incontinent women who visited the urogynecological unit, and 401 continent women (control group) who visited outpatient gynecology clinics with other gynecological symptoms during the research period. Since the patients of the urogynecological unit were women
who had been referred from gynecological clinics with urinary incontinence symptoms, all women had the clinical diagnosis of urinary incontinence, defined as any leakage or involuntary loss of urine.
Data collection
Data were gathered via face-to-face interviews, using a questionnaire prepared by the researchers according to the literature on risk factors related to urinary incontinence. The questionnaire addressed sociodemographic and obstetrical characteristics of women, gynecological and medical problems, lifestyle factors, and personal/family history of incontinence, as shown in Tables 4 and 5. It was administered to 30 women in the pilot study. After revision, the questionnaires were finalized. Trained interviewers administered the questionnaires to women during visits to the clinic, in a private location.
Data analysis
Data were analyzed in SPSS for Windows using frequency, mean and standard deviation. Chi-square test and adjusted odds ratios (OR) of incontinence were derived using forward stepwise logistic regression analysis.
Results
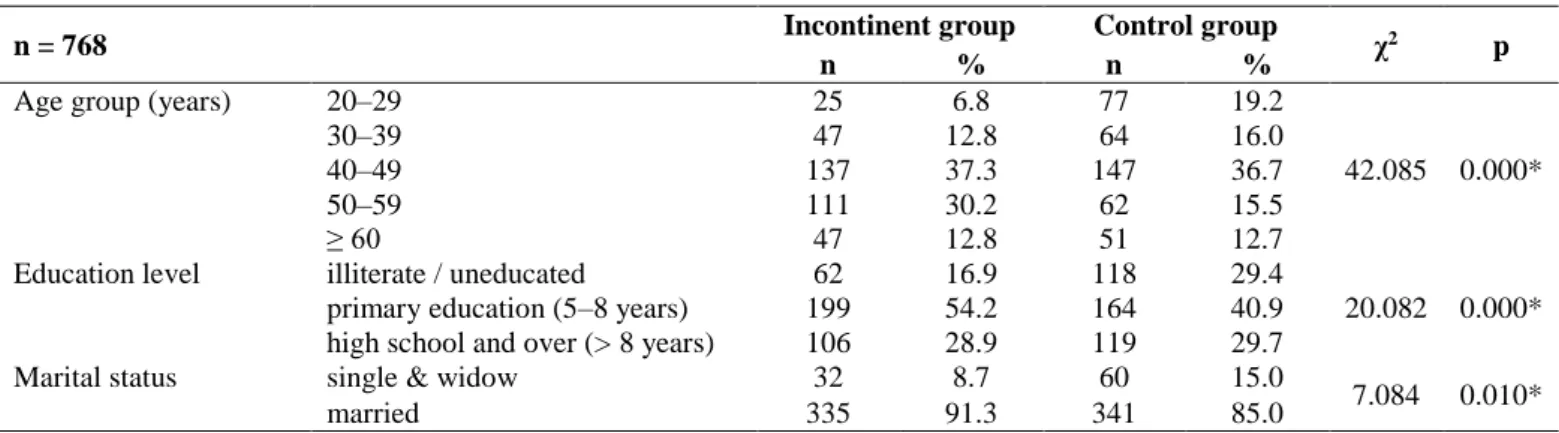
The mean ages of women in the incontinent and control groups were 47.3 (SD = 10.7) and 42.6 (SD = 13.9) years, respectively, and ranged between 20 and 80 years. Most of the women in both groups were married, housewives, with primary school education or above. Statistically significant differences were found between groups in relation to several demographic characteristics, including age groups (p = 0.000), education (p = 0.000), and marital status (p = 0.010). Comparison of sociodemographic characteristics between groups are presented in Table 1.
Table 1 Comparison of socio demographical characteristics between groups
n = 768 Incontinent group Control group χ2 p
n % n %
Age group (years) 20–29 25 6.8 77 19.2
42.085 0.000*
30–39 47 12.8 64 16.0
40–49 137 37.3 147 36.7
50–59 111 30.2 62 15.5
≥ 60 47 12.8 51 12.7
Education level illiterate / uneducated 62 16.9 118 29.4
20.082 0.000*
primary education (5–8 years) 199 54.2 164 40.9
high school and over (> 8 years) 106 28.9 119 29.7
Marital status single & widow 32 8.7 60 15.0
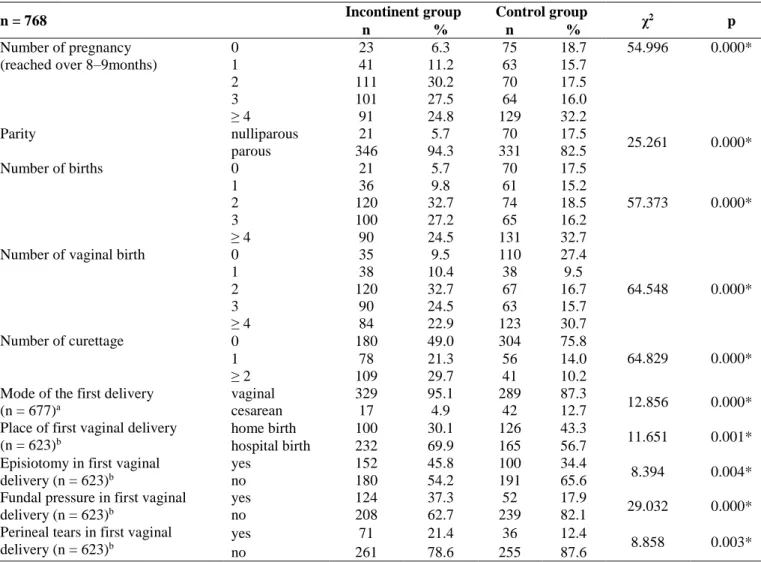
The presence of several obstetrical risk factors for UI was compared between the groups (Table 2). Bivariate analysis of the data demonstrated statistically significant differences between incontinent and control groups in relation to number of pregnancies (p = 0.000), parity (p = 0.000), number of births (p = 0.000), number of vaginal births (p = 0.000), number of curettages (p = 0.000), mode of first delivery (p = 0.000), place of first vaginal delivery (p = 0.001), episiotomy in first vaginal delivery (p = 0.004), fundal pressure in first vaginal delivery (p = 0.000), and perineal tears in first vaginal delivery (p = 0.003). However, there was no significant difference between groups regarding vaginal birth with ≥ 4 kg fetus (p = 0.194), pregnancy with ≥ 4 kg fetus (p = 0.250), and number of abortions (p = 0.308).
Assessment of gynecological/medical characteristics between groups demonstrated statistically significant differences in relation to menopause (p = 0.005),
hormone replacement therapy (p = 0.021), having gynecological operations (p = 0.001), pulmonary disease (p = 0.004), diabetes mellitus (p = 0.001), hypertension (p = 0.018), medicine use (p = 0.000), constipation (p = 0.017), flatus (p = 0.000), hemorrhoids (p = 0.000), herniated disc / varicose veins (p = 0.000) and stria during pregnancy (p = 0.008) (Table 3). No significant differences were found regarding recurrent vaginal infections (p = 0.800), and recurrent urinary infections (p = 0.630).
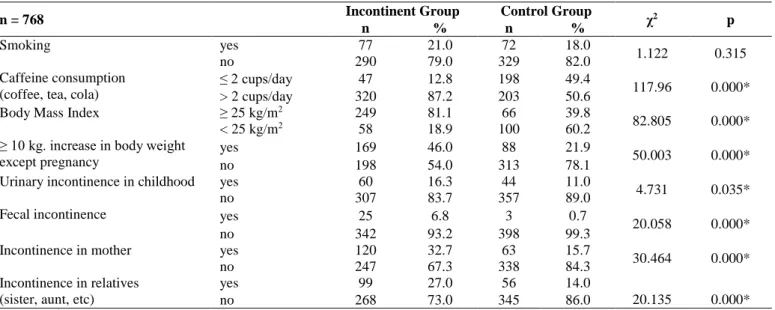
Smoking, caffeine consumption > 2 cups/day, body mass index (BMI ≥ 25 kg/m2)and ≥ 10 kg increase
in body weight not due to pregnancy were evaluated as lifestyle factors for UI. The presence of these lifestyle factors differed significantly (p = 0.000) between incontinent and control groups, except for smoking (p = 0.315) (Table 4).
Table 2 Comparison of obstetric characteristics between groups
n = 768 Incontinent group Control group χ2 p
n % n %
Number of pregnancy (reached over 8–9months)
0 23 6.3 75 18.7 54.996 0.000* 1 41 11.2 63 15.7 2 111 30.2 70 17.5 3 101 27.5 64 16.0 ≥ 4 91 24.8 129 32.2 Parity nulliparous 21 5.7 70 17.5 25.261 0.000* parous 346 94.3 331 82.5 Number of births 0 21 5.7 70 17.5 57.373 0.000* 1 36 9.8 61 15.2 2 120 32.7 74 18.5 3 100 27.2 65 16.2 ≥ 4 90 24.5 131 32.7
Number of vaginal birth 0 35 9.5 110 27.4
64.548 0.000* 1 38 10.4 38 9.5 2 120 32.7 67 16.7 3 90 24.5 63 15.7 ≥ 4 84 22.9 123 30.7 Number of curettage 0 180 49.0 304 75.8 64.829 0.000* 1 78 21.3 56 14.0 ≥ 2 109 29.7 41 10.2
Mode of the first delivery (n = 677)a
vaginal 329 95.1 289 87.3
12.856 0.000*
cesarean 17 4.9 42 12.7
Place of first vaginal delivery (n = 623)b
home birth 100 30.1 126 43.3
11.651 0.001*
hospital birth 232 69.9 165 56.7
Episiotomy in first vaginal delivery (n = 623)b
yes 152 45.8 100 34.4
8.394 0.004*
no 180 54.2 191 65.6
Fundal pressure in first vaginal delivery (n = 623)b
yes 124 37.3 52 17.9
29.032 0.000*
no 208 62.7 239 82.1
Perineal tears in first vaginal delivery (n = 623)b
yes 71 21.4 36 12.4
8.858 0.003*
no 261 78.6 255 87.6
Comparison of personal and family history of incontinence between incontinent and control groups revealed statistically significant differences in relation to urinary incontinence in childhood
(p = 0.035), presence of fecal incontinence (p = 0.000), history of incontinence in mothers (p = 0.000), and history of incontinence in relatives (sister, aunt, etc) (p = 0.000) (Table 4).
Table 3 Comparison of gynecological/medical characteristics between groups
n = 768 Incontinent group Control group χ2 p
n % n %
Menopause yes 157 42.8 131 32.7
8.358 0.005*
no 210 57.2 270 67.3
Hormone replacement therapy (n = 288)
yes 6 3.8 15 11.5
6.148 0.021*
no 151 96.2 116 88.5
Gynecological operation yes 85 23.2 56 14.0
10.811 0.001*
no 282 76.8 345 86.0
Pulmonary disease yes 38 10.4 19 4.7
8.796 0.004*
no 329 89.6 382 95.3
Diabetes mellitus yes 49 13.4 25 6.2
11.148 0.001*
no 318 86.6 376 93.8
Hypertension yes 113 30.8 93 23.2
5.636 0.018*
no 254 69.2 308 76.8
Medicine use yes 183 49.9 136 33.9
20.071 0.000* no 184 50.1 265 66.1 Constipation yes 122 33.2 101 25.2 6.035 0.017* no 245 66.8 300 74.8 Flatus yes 159 43.3 109 27.2 21.978 0.000* no 208 56.7 292 72.8 Hemorrhoids yes 131 35.7 93 23.2 14.499 0.000* no 236 64.3 308 76.8
Herniated disc / varicose veins yes 102 27.8 49 12.2
29.423 0.000*
no 265 72.2 352 87.8
Stria during pregnancy yes 252 72.8 209 63.1
7.312 0.008*
no 94 27.2 122 36.9
*p ≤ 0.05;χ2 – Chi square
Table 4 Comparison of lifestyle factors and personal/family history of UI between groups
n = 768 Incontinent Group Control Group χ2 p
n % n %
Smoking yes 77 21.0 72 18.0
1.122 0.315
no 290 79.0 329 82.0
Caffeine consumption (coffee, tea, cola)
≤ 2 cups/day 47 12.8 198 49.4
117.96 0.000*
> 2 cups/day 320 87.2 203 50.6
Body Mass Index ≥ 25 kg/m2 249 81.1 66 39.8
82.805 0.000*
< 25 kg/m2 58 18.9 100 60.2
≥ 10 kg. increase in body weight except pregnancy
yes 169 46.0 88 21.9
50.003 0.000*
no 198 54.0 313 78.1
Urinary incontinence in childhood yes 60 16.3 44 11.0
4.731 0.035*
no 307 83.7 357 89.0
Fecal incontinence yes 25 6.8 3 0.7
20.058 0.000*
no 342 93.2 398 99.3
Incontinence in mother yes 120 32.7 63 15.7
30.464 0.000*
no 247 67.3 338 84.3
Incontinence in relatives (sister, aunt, etc)
yes 99 27.0 56 14.0
20.135 0.000*
no 268 73.0 345 86.0
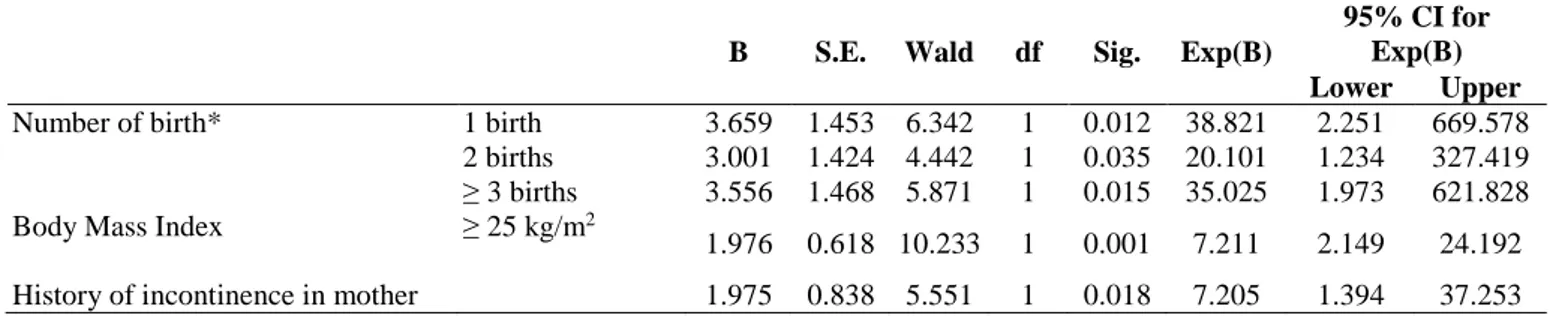
Among the variables (about socio demographic, obstetrical, gynecological/medical, lifestyle and incontinence history) assessed using bivariate analysis, only the variables that showed significant differences in significance tests (chi square) were included in the model for multivariate logistic regression as potential risk factors for UI. According to the results of forward stepwise logistic regression
analysis, number of births (“1-birth” OR = 38.8;
CI = 2.2–669.5; “2-births” OR = 20.1;
CI = 1.2–327.4; “≥ 3 births” OR = 35.0; CI = 1.9–621.8), body mass index (BMI ≥ 25 kg/m2;
OR = 7.2; CI = 2.1–24.1),and history of incontinence in mothers (OR = 7.2; CI = 1.3–37.2) were identified as the most important risk factors for urinary incontinence in our study group (Table 5).
Table 5 Multivariate logistic regression analysis of risk factors for urinary incontinence
B S.E. Wald df Sig. Exp(B)
95% CI for Exp(B) Lower Upper
Number of birth* 1 birth 3.659 1.453 6.342 1 0.012 38.821 2.251 669.578
2 births 3.001 1.424 4.442 1 0.035 20.101 1.234 327.419 ≥ 3 births 3.556 1.468 5.871 1 0.015 35.025 1.973 621.828
Body Mass Index ≥ 25 kg/m2
1.976 0.618 10.233 1 0.001 7.211 2.149 24.192
History of incontinence in mother 1.975 0.838 5.551 1 0.018 7.205 1.394 37.253
*Reference group for comparing number of birth was having no birth; **p ≤ 0.05; B – Unstandardized Beta; S.E. – Standart Error; df – degrees of freedom; Sig. – significance; Exp. (B) – odds ratio
Discussion
Urinary incontinence (UI) is highly prevalent in women and stress UI symptoms can impose a significant burden on the women who have them. Multiple predictors such as pregnancy-related factors, menopause, high body mass index, hysterectomy, and age have been found to be associated with UI (Menezes, Pereira, Hextall, 2010). In this case-control study, we examined the risk factors associated with UI in 768 Turkish women between the ages of 20–80 years. Obesity (BMI ≥ 25 kg/m2)
(OR = 7.2; CI = 2.1–24.1), number of births (“1-birth” OR = 38.8; CI = 2.2–669.5; “2-births” OR = 20.1; CI = 1.2–327.4; “≥ 3 births” OR = 35.0; CI = 1.9–621.8), and history of incontinence in mother (OR = 7.2; CI = 1.3–37.2) increased the likelihood of having UI.
Age
Aging has been reported as an important risk factor for developing UI (Norton, 2010). Prevalence of incontinence increases with age, and etiology is multifactorial. Aging causes a number of changes in urinary tract physiology, particularly due to diseases outside the urinary tract, and age-related structural changes in the urinary tract (Menezes, Pereira, Hextall, 2010). In this study, 80.3% of incontinent women were over 40 years of age. The incontinent group were statistically older than the continent group.
Pregnancy and childbirth
For years, pregnancy and childbirth have been considered to be major contributors to UI in female (Menezes, Pereira, Hextall, 2010). Many peripartum factors have also been found to increase the risk of post partum urinary and anal incontinence. These include factors related to obstetric trauma (vaginal delivery, forceps delivery, and episiotomy) (Danforth, 2006; Yu et al., 2009; Menezes, Pereira, Hextall, 2010). In a recent study, Dolan and Hilton (2010) evaluated the relationship between obstetric factors and pelvic floor dysfunction, reporting that UI and fecal incontinence risk were lower after first delivery by cesarean section. The EPINCONT study enrolled 15,307 women, and demonstrated that stress UI symptoms are more frequent after vaginal delivery than after cesarean section (Rortveit et al., 2003). Ham et al. (2009) demonstrated that the association of vaginal delivery with UI risk increased with the number of deliveries: 2.75 and 2.42 of adjusted OR increased risk in women with two, and more than two vaginal deliveries, respectively, compared with women with no or one vaginal delivery (Ham et al., 2009). When the continent and incontinent groups were compared for obstetrical factors in the current study, incontinent women were found to be parous, and had a vaginal delivery in a hospital setting for their first child. In addition, the rates of episiotomy, fundal pressure, and perineal tears in first vaginal delivery were found to be significantly higher in incontinent women. Also, the number
of pregnancies, number of births, number of vaginal births, and number of curettages were statistically higher in incontinent women. According to results of forward stepwise logistic regression analysis, number of births is identified as the most important risk factor for UI in our study group. These findings regarding obstetrical risk factors are compatible with the literature.
Menopause and hormone replacement therapy The pathophysiology behind menopause and development of urinary incontinence is not well understood. Menezes et al.’s review (2010) article reported that several studies have tried to prove the benefits of hormone replacement therapy for incontinence, yet have concluded that it does not protect against UI. The recent Cochrane Review of thirty-nine trials concluded that local estrogen treatment may improve or cure incontinence. The presence of estrogen receptors has been demonstrated in the lower urinary tract. Lack of estrogen during menopause causes atrophic changes to the mucosa of the urethra, which is likely to weaken the bladder muscles, and is thus thought to be cause of urinary incontinence (Menezes, Pereira, Hextall, 2010). Barlow et al. (1997) found that 48.5% of postmenopausal women had been affected by urogenital symptoms. Similarly, in the current study, the number of menopausal women was higher in the incontinent group, while the number of women receiving hormone replacement therapy was lower. Gynecological operations and medical conditions Menezes et al. (2010) reported that altered bladder function is one of the common sequelea following pelvic surgery (Menezes, Pereira, Hextall, 2010). Kocak et al. (2005) found that hypertension is a risk factor for UI among Turkish women. In the current study, the evaluation of continent and incontinent groups in relation to gynecological/medical characteristics demonstrated that the number of women who had a history of gynecological operations, pulmonary disease, diabetes mellitus, hypertension, medicine use, constipation, fecal incontinence, flatus, hemorrhoids, herniated discs/varicose veins, and stria during pregnancy were higher in the incontinent group.
Caffeine consumption and smoking
Smoking and caffeine consumption have been reported to increase urinary symptoms due to the association between smoking and increased abdominal pressure, and the diuretic effects of caffeine consumption, respectively. However,
found between groups regarding smoking in the current study. On the other hand, caffeine consumption > 2 cups/day was significantly higher in incontinent women.
Obesity
Obesity is a risk factor for UI. Several cross-sectional studies have demonstrated an association between obesity and UI (Dwyer, Lee, Hay, 1988; Hannestad et al., 2003; Ozerdoğan, Beji, Yalçin, 2004; Danforth et al., 2006; Hsieh et al., 2008; Ham et al., 2009; Yu et al., 2009; Dolan, Hilton, 2010; Thom et al., 2010). Dolan and Hilton (2010) found that obese women were at highest risk and had the most severe symptoms. Similarly, the ratio of BMI ≥ 25 was significantly higher in incontinent women in this study. In addition, according to the results of forward stepwise logistic regression analysis, BMI ≥ 25 was identified as one of the most important risk factors for UI in our study group.
Personal and family history
The history of UI in first-degree relatives has been reported to increase the risk of UI four-six times (Norton, 2010). The current study supports this finding, as the number of women with a history of incontinence in their mothers and relatives (sister, aunt, etc) was found to be significantly higher in the incontinent group. Kocak et al. (2005) found that a history of childhood nocturnal enuresis is a risk factor for UI among Turkish women. Similarly, the number of women with a history of UI in childhood was found to be higher in incontinent Turkish women in this study. In addition, results of forward stepwise logistic regression analysis identified a history of incontinence in patients’ mothers as a significant risk factor for UI in our study group.
Conclusion
The most significant risk factors of urinary incontinence in the sample group were identified to be: the number of births as a potential obstetric risk factor, obesity as a lifestyle factor, and “history of incontinence in the motherˮ as a familial factor. Identification of the risk factors is essential for clinical decisions and the development of a preventive strategy to decrease the incontinence rate in Turkish women. For example, increased awareness among women at risk may help lifestyle behavior modification and improve womenʼs awareness of the possibility of prevention and treatment.
tests comparing case and control groups, is an important strength of this study. However, he results of this hospital-based study provide limited
evidence compared to population-based
epidemiological studies. Although the sample was recruited from a large tertiary teaching hospital in Istanbul, results are not representative of all women in Turkey, due to the regional differences.
Ethical aspects and conflict of interest
Written ethical approval was obtained from the ethical review board of the hospital. Participants were informed about the aims of the study and their
verbal consent was obtained prior to
the administration of the questionnaire. No funding was received for this study, and there is no conflict of interest.
Acknowledgements
No funding was received for this study.
Author contribution
Conception and design (NKB, ÖY), data analysis and interpretation (İG, ŞG, HEA), writing the manuscript (GO), critical revision of the manuscript (NKB, İG, GO), final manuscript (GO).
R
eferences
Abrams P, Cardozo L, Fall M, Griffiths D, Rosier P, Ulmsten U, Van Kerrebroeck P, Victor A, Wein A; Standardisation Sub-Committee of the International Continence Society. The standardization of terminology in lower urinary tract function: report from the standardization sub-committee of the International Continence Society. Urology. 2003;61(1):37–49. Abrams P, Andersson KE, Birder L et al. Evaluation and treatment of urinary incontinence, pelvic organ prolapse and faecal incontinence. 2009 [cited 2018 Jan 10]. Avaliable from: https://www.ics.org/Publications/ICI_4/files-book/recommendation.pdf
Barlow DH, Cardozo LD, Francis RM, Griffin M, Hart DM, Stephens E, Sturdee DW. Urogenital ageing and its effect on sexual health in older British women. British Journal of Obstetrics and Gynaecology. 1997;104(1):87–91.
Danforth KN, Townsend MK, Lifford K, Curhan GC, Resnick NM, Grodstein F. Risk factors for urinary incontinence among middle-aged women. American Journal of Obstetrics and Gynecology. 2006;194(2):339–345. Dolan LM, Hilton P. Obstetric risk factors and pelvic floor dysfunction 20 years after first delivery. International Urogynecology Journal. 2010;21(5):535–544.
Dwyer PL, Lee ET, Hay DM. Obesity and urinary incontinence in women. British Journal of Obstetrics and Gynaecology. 1988;95(1):91–96.
Ham E, Choi H, Seo JT, Kim HG, Palmer MH, Kim I. Risk factors for female urinary incontinence among middle-aged Korean women. Journal of Women’s Health (Larchmt). 2009;18(11):1801–1806.
Hannestad YS, Rortveit G, Daltveit AK, Hunskaar S. Are smoking and other lifestyle factors associated with female urinary incontinence? The Norwegian EPINCONT Study. British Journal of Obstetrics and Gynaecology. 2003;110(3):247–254.
Hsieh CH, Lee MS, Lee MC, Kuo TC, Hsu CS, Chang ST. Risk factors for urinary incontinence in Taiwanese women aged 20-59 years. Taiwan Journal of Obstetrics and Gynecology. 2008;47(2):197–202.
Hunskaar S, Lose G, Sykes D, Voss S. The prevalence of urinary incontinence in women in four European countries. British Journal of Urology International. 2004;93(3):324– 330.
Kılıç M. Incedence and risk factors of urinary incontinence in women visiting Family Health Centers. Springerplus. 2016;5(1):1331.
Kocak I, Okyay P, Dundar M, Erol H, Beser E. Female urinary incontinence in the west of Turkey: prevalence, risk factors and impact on quality of life. European Urology. 2005;48(4):634–641.
Menezes M, Pereira M, Hextall A. Predictors of female urinary incontinence at midlife and beyond. Maturitas. 2010;65(2):167–171.
Mota RL. Female urinary incontinence and sexuality. International Brazilian Journal of Urology. 2017;43(1):20– 28.
Norton P. Kadın üriner inkontinans: Epidemiyoloji ve değerlendirme. In: Ayhan A, editor. Danforth’s obstetrics and gynecology. Istanbul: Güneş Tıp Kitapevi; 2010. p. 453–456. (in Turkish)
Ozerdoğan N, Beji NK, Yalçin O. Urinary incontinence: its prevalence, risk factors and effects on the quality of life of women living in a region of Turkey. Gynecologic and Obstetric Investigation. 2004;58(3):145–150.
Rortveit G, Daltveit AK, Hannestad YS, Hunskaar S; Norwegian EPINCONT Study. Urinary incontinence after vaginal delivery or caesarean section. New England Journal of Medicine. 2003;348(10):900–907.
Thom DH, Brown JS, Schembri M, Ragins AI, Subak LL, Van Den Eeden SK. Incidence of and risk factors for change in urinary incontinence status in a prospective cohort of middle-aged and older women: The Reproductive Risk of Incontinence Study in Kaiser (RRISK). Journal of Urology. 2010;184(4):1394–1401.
Yu PL, Shi J, Liu XR, Xia CW, Liu DF, Wu ZL, Sun ZQ. Study on the prevalence of urinary incontinence and its related factors among elderly in rural areas, Jixian country, Tianjin. Zhonghua Liu Xing Bing Xue Za Zhi. 2009;30(8):766–771.