Linking to compete: Logistics and global competitiveness interaction
Şule Önsel Ekici
a, Özgür Kabak
b,n, Füsun Ülengin
c,naDoğus University, Department of Industrial Engineering, Istanbul, Turkey b
Istanbul Technical University, Department of Industrial Engineering, Istanbul, Turkey cSabanci University, Sabanci School of Management, Istanbul, Turkey
a r t i c l e i n f o
Article history:
Received 28 January 2015 Received in revised form 20 October 2015 Accepted 30 January 2016 Available online 7 March 2016 Keywords:
Logistics performance Competitiveness Artificial neural network Cumulative belief degrees
a b s t r a c t
A country’s ability to trade globally depends to a great extent on the traders’ access to efficient logistics networks. The efficiency of logistics networks, in its turn, depends on government services, investments, and policies. Building infrastructure, developing a regulatory regime for transport services, and designing and implementing efficient customs clearance procedures are the areas where governments play an important role. One of the measures for logistics performance at national level is the Logistics Perfor-mance Index (LPI) published by the World Bank Group. LPI is composed of six indicators namely customs, infrastructure, service quality, timeliness, international shipments, and tracking and tracing. This study argues that there is a close relationship between global competitiveness and the logistics efficiency of a country and it analyzes the validity of these relations using an artificial neural network (ANN) and cu-mulative belief degrees (CBD) approach. For this purpose; initially, a screening process is carried out to find the World Economic Forum’s competitiveness indicators that may have an impact on each of the LPI indicators. Subsequently, the relationship between the competitiveness indicators and LPI indicators is analyzed using ANN where the LPI indicators are represented by CBDs. As a case study, this methodology is used to analyze Turkey’s logistics performance and to develop the basic strategies to be adopted by the government to achieve a targeted LPI level for the country. Among the many factors relating to logistics performance, it was found thatfixed broadband Internet availability is the most important target area for improvement related to sustainable logistics policy.
& 2016 Elsevier Ltd. All rights reserved.
1. Introduction
As the backbone of international trade, logistics encompasses freight transportation, warehousing, border clearance, payment systems and many other functions which are mostly performed by private service providers for private traders and owners of goods; however, it is also important for public policies of national gov-ernments and regional and international organizations (Arvis et al., 2012). It is necessary to understand logistics performance at the country level in order to better evaluate and target trade and transport facilitation policy efforts over time and across countries. If a country can obtain a competitive advantage in terms of lo-gistics performance, this will increase its international trade, help to open new markets and encourage business. Country-based lo-gistics performance evaluation will also help in understanding the relative position of the country and providing guidance on which areas require special attention, such as infrastructure, services,
procedures and regulations, in order to improve the logistics performance level. Companies with access to high quality cost-efficient logistical capabilities can often outsource certain logistics tasks and devote fewer internal resources to these tasks. For in-stance, in countries with good roads and predictable customs clearance, delivery times will be both shorter and more reliable. As is also stated by Lean et al. (2014) economic development of a country will increase the demand for logistics services and this in turn will increase the need for logistics development.
However, there is scarce research focusing on logistics perfor-mance evaluation from the perspective of nations as a whole. Some research has aimed to find the link between the supply chain process performance of companies and theirfinancial per-formance (Elgazzar et al., 2012). But, the existing literature on supply chain and logistics performance is generally static and provides cross-sectional analysis of performance rather than a dynamic picture of performance evolution (Töyli et al., 2008). In fact the Logistics Performance Index (LPI) (Arvis et al. 2007,2010,
2012,2014) shows comparative performance of logistics in more than 150 countries and assesses performance flow of goods through each country. The World Bank and the Turku School of Economics have been making evaluations for the index every two Contents lists available atScienceDirect
journal homepage:www.elsevier.com/locate/tranpol
Transport Policy
http://dx.doi.org/10.1016/j.tranpol.2016.01.015 0967-070X/& 2016 Elsevier Ltd. All rights reserved.
nCorresponding authors.
E-mail addresses:[email protected](Ş. Önsel Ekici), [email protected](Ö. Kabak),[email protected](F. Ülengin).
years since 2007. The LPI takes into account customs, infra-structure, service quality, timeliness, international shipments, and tracking and tracing as the key elements of logistics and compares these logistics profiles between 166 countries, rating them on a scale of 1 (worst) to 5 (best) (Arvis et al., 2014). As can be seen, these indicators are directly influenced by the level of some of the indicators that shape the relative economic performance of a na-tion as a whole. Due to the complexity of global supply chains, the efficiency of logistics depends on the efficiency of government services, investment and policies as well as other factors which influence the competitiveness of the nation as a whole.
The success in improving the logistics performance of a country is therefore highly dependent on the national competitiveness of that country. Logistics is a complex sequence of coordinated ac-tivities and the performance of the whole is highly dependent on the government interventions such as building infrastructure, developing regulatory regime for transport services, and designing and implementing efficient customs clearance procedures. In fact, these areas are directly related with the improvement of the re-lated indicators in the global competitiveness of the country. As traditional competition becomes global, businesses often fail to take the required measures on their own in order to become more competitive, so improvement at the national level is crucial, especially for businesses directly involved in logistics.
Competitiveness of a nation is generally defined as the set of institutions, policies and relevant factors that determine the level of productivity of a country (Artto, 1987). Each year, selected or-ganizations, such as the World Economic Forum (WEF) and the Institute for Management Development (IMD), apply several hundred objective and subjective indicators to assess the wealth created by the world’s nations, and subsequently publish rankings of national competitiveness. These rankings serve as a benchmark for policy-makers and other interested parties for judging the re-lative competitive performance of their country within a global context. In fact, several of these indicators also have an important impact on the performance of the logistics of the related country. Building infrastructure, developing regulatory regime for transport services, and designing and implementing efficient customs clearance procedures are just a few areas where government play an important role. Global Competitiveness Index (GCI) developed by WEF assess the competitiveness of an economy based on 12 pillars, namely; institutions, infrastructure, macroeconomic en-vironment, health and primary education, higher education and training, goods market efficiency, labor market efficiency, financial market development, technological readiness, market size, busi-ness sophistication and innovation (Sala-i Martin et al., 2012,
2015). In fact, the majority of these pillars are very important for the success of logistics activities. For example; the logistics per-formance of the country depends heavily on measures taken by the individual countries in infrastructure provision, regulation and development services or facilitation of trade through more friendly and technologically improved procedures. It is obvious that infrastructure provision is directly related to well-developed transportation and communication infrastructure that will reduce the effect of distance between regions. Effective modes of trans-port will enable the entrepreneurs to send their goods and ser-vices to the market in a secure and timely manner (the infra-structure pillar of GCI). The regulation and development services, on the other hand, can only be realized in an economy having a sound and fair institutional environment (The institution pillar of GCI) and facilitation and trade can only be realized when thefirms operate in a country that have to advanced information and communication technologies, with broadband internet (the tech-nological readiness pillar of GCI ), with a good quality of business network and supporting industries measured by the quantity and quality of local supplier as well advanced operations strategies
(the business sophistication pillar of GCI) with well educated workers who are able to perform complex logistics activities (the higher education and training pillar of GCI) etc. Therefore; in order to reduce the logistics gap between best performing countries and the ones that are still lagging behind, priorities should be given to the national policies that will have the highest impact on the improvement of logistics performance of the country. Govern-ments will need to make long-term policy changes in a way to make substantial improvement in the competitiveness of logistics services. The specification of the priorities will be essential in the specification of long term commitments and reforms from policy makers and private shareholders. As a result, if it is possible to highlight which of the WEF indicators have an important priority on improving the LPI of a country, this will provide an invaluable guide for government policy makers. With such a guide, the policy makers will be able to see the global competitiveness indicators that will make the highest impact on the improvement of logistics competitiveness. They will prioritize their investment decisions accordingly. Such analysis will also be imperative to facilitating and improving the activities of the traders and of the logistics providers that have to operate under very different environments globally.
In parallel with these assertions, this study analyzes the re-lationship between logistics performance and competitiveness at national level. In order to develop a decision making tool to sup-port policy makers in their decisions to improve the logistics performance of a country, the interrelation between the criteria related to competitiveness of a nation as a whole and the logistics performance indicators is analyzed using a methodology which integrates an Artificial Neural Network (ANN) and cumulative belief degree (CBD) approach. With this method the logistics performance of any country can be analyzed based on the primary national competitiveness factors.
Turkey, an important logistics center in Europe exhibiting high trade values with its regional partners, has a large population, diversified economy and strategic geographic location. It is con-sidered a critical actor in the trade between Europe, the Com-monwealth of Independent States (CIS) and the Middle East (ITF, 2014) and as such is an ideal subject for case study.
In the following section the proposed methodology is pre-sented in detail. Scenario analysis and policy suggestions are given in the third section. The fourth section deals with conclusions drawn from this study.
2. Methodology: Gauging the interaction between national competiveness and logistic performance
The aim of this study is to develop a decision making tool to support policy makers in improving the logistics performance of their country. To begin with, the relationship between competi-tiveness indicators and logistics performance is revealed in order to identify the most important factors that impact on logistics performance of a given country.
The interaction between the logistics performance of a country and some of the components of competitiveness such as its eco-nomic growth has been investigated by many researchers. In fact, the logistics industry plays an important role in the national de-velopment (Chen and Novy, 2011). Nguyen and Tongzon, (2010)
underline that international trade will affect the transport and logistics sector through higher demand for transport services and creating opportunities for business expansion. However, the de-velopment of logistics sector, in its turn, is also expected to have a positive impact on increasing production, consumption and trade and thus stimulating the economic growth. For example; the better infrastructure will also contribute to attract foreign direct
investment (Lean et al., 2014; Barnister and Berechman, 2001) Therefore, a bidirectional causal relationship may be expected between logistics and trade. However, the validity of this bidir-ectional in practice is not clear. Similarly, the relation between logistics and competitiveness is also bidirectional where there is a close relationship, but which one is the cause or effect is hard to say. That is why, in this study we have concentrated on the in-teraction between national competitiveness and logistics perfor-mance rather than the impact of one over the other. We used ANN and scenario analysis based approach for this purpose.
2.1. Indicators used in the proposed methodology
Since 2005, the WEF has published global competitiveness re-ports for more than 100 countries on the basis of over 100 criteria. The WEF (2013) investigates 144 economies based on 114 in-dicators and classifies the indicators into twelve basic pillars. In this study, these 114 indicators are used as a measure of compe-titiveness, the initial set of variables affecting LPI indicators.
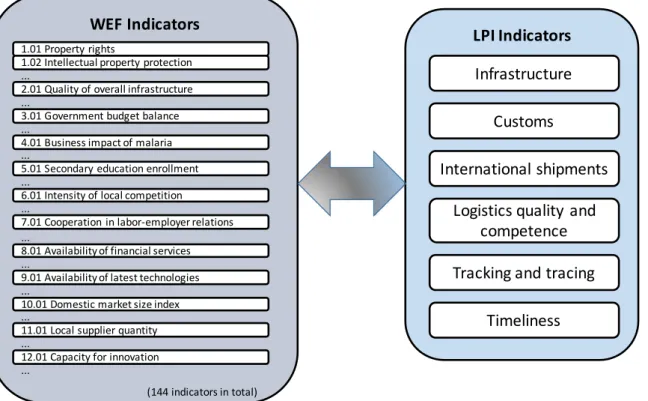
For the World Bank’s Logistical Performance Index, the ratings are based on 6000 individual country assessments by almost 1000 international forwarders who rated the eight foreign countries that their company serves most frequently. LPI takes into account customs, infrastructure, service quality, timeliness, international shipments, and tracking and tracing as the key elements of lo-gistics and compares these lolo-gistics profiles between 166 coun-tries, rating them on a scale of 1 (worst) to 5 (best) (Arvis et al., 2014). It is this index that is used by the current study to represent logistics performance (seeFig. 1).
2.2. Identifying correspondence between specific WEF and LPI indicators
Thefirst step in the proposed methodology is to identify re-lated WEF indicators for each LPI indicator through expert judg-ments. The aim is to eliminate unrelated indicators which may negatively affect the further analysis. In order to get information
about the WEF variables that are related to Logistics Performance index, a workshop was organized by UND [Uluslararası Nakliye-ciler Derneği – International Transporter’s Association] on May 5, 2014. The participants of the workshop were the members of the High Advisory Council of UND and, thus, have a good knowledge and expertize in transportation and logistics activities. The parti-cipants were asked to review the 114 WEF indicators and remove the unrelated indicators for each LPI indicator. They analyzed each LPI indicator one by one and all the suggestions of participants (i.e., the removal of a WEF indicator due to having no relation with logistics performance) were discussed until a group consensus is reached. As a result, the remaining indicators were used to identify the existence of a relation between the WEF indicators and each LPI indicator
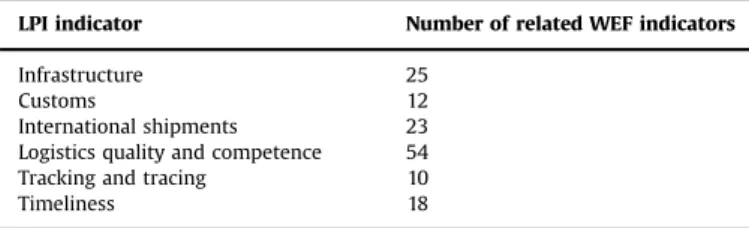
The resulting numbers of indicators are presented inTable 1. The full list of related WEF indicators for each LPI indicator is given inAppendix A.
2.3. Structuring and training of indicator relation networks After having obtained the expert judgments, the relations be-tween WEF indicators and their corresponding LPI indicator are structured using ANN. Different networks are designed for in-dividual LPI indicators, each of which is represented using CBDs. The networks are then trained using the past data.
2.3.1. Cumulative belief degrees
Developed for evaluation of nuclear safeguards (Kabak and Ruan, 2011a), CBD approach enables mathematical operations on the belief structures. It has an application in multiple criteria de-cision making problems (Kabak and Ruan, 2011b;Ruan et al., 2013) and quantification of causal relations in a system (Kabak et al., 2014). In this study CBDs are used to represent LPI indicators in order to reduce the quantitative uncertainty encountered in in-dicator values by allowing fuzzy representations with linguistic terms. The basic use of CBD approach, similar to Kabak et al. (2014), is for the quantification of causal relations. However
instead of the regression based model employed in Kabak et al. (2014), where the relations are assumed to be linear, ANN ap-proach is used in this study to estimate complex relations.
In this study fuzzy linguistic terms are used to represent the information by the belief structure. Each LPI indicator is evaluated with a five-term set, S¼{si}, i∈{0,…,4}, in which the following meanings to the terms are assigned; s0: very low, s1: low, s2: medium, s3: high, s4: very high.
The belief structure is used to represent the general belief of the level of an indicator as a result of past data or expert evalua-tions, such that if the past data of an indicator is available, the fuzzy linguistic sets are defined for the data and the membership degrees of evidence to the fuzzy sets, for example 30% to s1, and 70% to s2. In this statement s1, and s2 are linguistic evaluation grades and percentage values of 30%, and 70% are membership degrees, referred to as the degrees of belief, which indicate the extents that the corresponding grades are assessed to. The above assessment can be expressed as the following expectation:
( ) = {( ) ( )} ( )
B I1 0. 3,s , 0. 7,s1 2 1
where B(I1) stands for the state of the level of thefirst indicator. Notice that the belief degree for linguistic terms s0, s3, and s4 is zero therefore they are not shown inEq. (1). In general, the belief structure can be defined as follows:
∑
( ) = {(β ) = … )} ∀ β ≤ ∀ ( ) = i B I , s , 0, , m , k, 1, k 2 k ik i i 0 m ikwhere k and i are indices for indicators and linguistic terms, re-spectively, and
β
ikis the belief degree for the level of indicator k at silevel.The CBD at a certain linguistic term level can be defined as the aggregated belief degrees of greater or equal terms of the related linguistic term. The cumulative belief structure can be defined as follows:
∑
( ) = {(γ ) = … )} ∀ γ = β ( ) = i C I , s , 0, , m , k, 3 k ik i ik j i m jkwhere
γ
ik is CBD related to indicator k at threshold level i. For instance for B I( ) = {(1 0. 3,s , 0. 7,s1) ( 2)}the corresponding cumula-tive belief structure is C I( ) = {(1 1,s , 1,s 0. 7,s , 0,s , 0,s0) ( 1)( 2) ( 3) ( 4)}, whereγ21, CBD related to linguistic terms2is calculated as follows:γ21= β21+ β31+ β =41 0. 7+0+0=0. 7.
2.3.2. Representation of LPI indicators using CBDs
Each LPI indicator is transformed to belief structures according to the methodology defined inKabak and Ruan (2011a)andKabak et al. (2014). An indicator value of a country is a single value in 1–5 scale. Therefore, the fuzzy sets defined in Fig. 2 are used to calculate membership values of an indicator of a country to each linguistic term. These membership values constitute the belief degrees for each datum. For example, if the indicator value is 3.2, then the related belief structure is B(I)¼{(s2,.8), (s3,.2)} (seeFig. 2).
2.3.3. Artificial neural networks
ANN techniques have been applied to a variety of problem areas and have, in many instances, provided superior results to conventional methods (Yoon et al., 1993; Kalogirou et al., 2014;
Laguarda-Miro et al., 2012; Fan et al., 2013). The literature (Swanson and White, 1997;Boznar et al., 1993;Hwarng and Ang, 2001; Resop, 2006) suggests the potential advantages of ANN versus statistical methods. It is well known that ANN shows ex-cellent performance on pattern recognition tasks. One such ad-vantage is the better performance of ANN when extreme values exist. Another advantage of ANN is that the estimation of an ANN can be automated, while the regression and ARIMA models must be re-estimated periodically whenever new data arrive. Especially when it is necessary to work with nonlinear data, ANN gives better results than the traditional methods (Gately, 1996). In fact, one of the primary applications of ANN is in understanding complex nonlinear mapping (Hruschka, 1993). It has been proved that a network with only one hidden layer is enough to approximate any continuous function. Therefore, ANN might represent a viable al-ternative to econometric techniques. Besides, ANN performs better in terms of mean absolute error (MAE) and mean absolute percent error (MAPE) (Hwarng and Ang, 2001). Moreover, neural networks are also better at capturing turning points.
An ANN is an information processing system that has certain performance characteristics in common with biological neural networks (Bahmanyar and Karami, 2014). Multi-layered feed-for-ward neural network topology, which is also employed in this study, is the most popular neural network in use today. A multi-layered feed-forward neural network consists of one input layer, one output layer and one or more hidden layers. The number of neurons in the hidden layer is determined by a trial-error proce-dure. Each neuron is connected to other neurons through links, each with an associated weight. The unit receives a weighted sum of all its inputs and computes its own output value by a trans-formation or output function (Hwarng and Ang, 2001). The output value is then propagated to many other units via connections between units. In general, the output function is a linear threshold function in which a unit becomes active only when its net input exceeds the threshold of the unit, or a sigmoid function, which is a non-decreasing and differentiable function of the input. Compu-tational units in an ANN model are hierarchically structured in layers. Depending upon the layer in which a unit resides, the unit is called an input, a hidden or an output unit. An input (output) unit is similar to an independent (dependent) variable in a sta-tistical model. A hidden unit is used to augment the input data in order to support any required function from input or output. In the
Table 1
Number of WEF indicators related to LPI indicators.
LPI indicator Number of related WEF indicators
Infrastructure 25
Customs 12
International shipments 23 Logistics quality and competence 54
Tracking and tracing 10
Timeliness 18
ANN literature, the process of computing appropriate weights is called “learning” or “training” and the weights have to be de-termined by a learning training algorithm (Bahmanyar and Karami, 2014). The process of computing appropriate weights is similar to “parameter estimation” in regression or multivariate analysis. When the system reacts appropriately to an input, the related weights are strengthened (Hruschka, 1993). However, unlike re-gression in which assessing importance based on the rere-gression coefficients can be done easily, in ANNs the complication of non-linearity as well as the hidden layer addition between input and output layers make it harder to interpret the weights in order to find the importance of input variables. For this reason, in this study a scenario analysis approach is proposed in order to de-termine the importance of inputs on the given output. The main advantage of the proposed method is that it does not depend on the weights of the ANN tofind the importance of the inputs. 2.4. Assessing importance of related WEF and LPI indicators
The third and final step in the proposed methodology is to ascertain the importance of related WEF indicators for each LPI indicator using the trained networks as a basis for scenario ana-lysis. In order tofind the relations between an LPI indicator and its related WEF indicators, LPI reports of 2007, 2010, and 2014 (compiled with data collected from 124 countries) and the WEF editions of 2007, 2010 and 2013 are used.
MATLAB neural network toolbox is used to conduct ANN ana-lysis including neural network training, testing, performance evaluation and comparison. The networks defined are two-layer feed-forward networks with sigmoid hidden neurons and linear output neurons. The number of neurons in thefirst layer is equal to the number of related WEF indicators for each LPI indicator (see
Table 1). The number of output neurons isfive, each representing the CBDs for an LPI indicator.
Random data divisions have been used by Matlab in order to select the samples for the training. 70% of the samples have been used as training data, 15% as validation data and the remaining 15% have been used as test data.
The properties of the best networks that are found are shown inTable 2. The numbers of input variables are exactly the numbers of related WEF indicators that are determined by the experts throughout the survey conducted in thefirst phase of the study. The numbers of output neurons in every network are always 5 since the outputs of the network are represented using CBDs. The numbers of hidden neurons to be used in the hidden layers of each network are specified according to the suggestion of Masters (1993). Masters suggests beginning with a very small number, such as 2, and testing the resulting ANN model in order tofind the one that will provide the lowest level of error. The aim is to stop the learning process whenever memorizing begins. Additionally, as was suggested byTang and Fishwick (1993), the ANN is run 10 times for each different number of hidden neuron.
Levenberg-Marquardt back-propagation method, which is one of the fastest back-propagation algorithms, is used for training the ANN. It is robust and in many cases itfinds solutions even if it starts well off thefinal minimum. Transfer functions for input-hidden and hid-den-output layers are also found by a number of different trial-error efforts. These best performing networks are used to conduct detailed scenario analysis.
3. Scenario analysis and policy suggestions
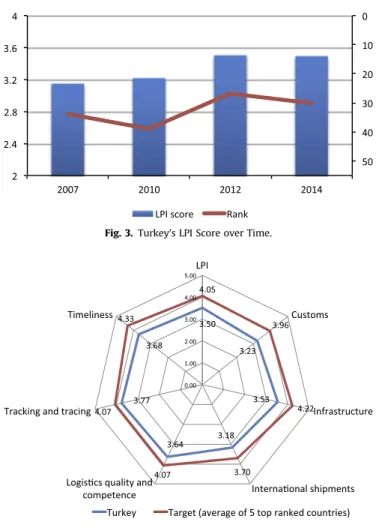
In this study Turkey is selected as a case study for scenario analysis and policy suggestions. Turkey is ranked 30th out of 160 countries in the LPI 2014. With this current status it is above the average of the upper middle income economies to which it be-longs. Although Turkey’s LPI score showed a significant increase of approximately 9% from 2010 to 2012, it showed almost no change between 2012 and 2014 resulting in a slight decrease in its ranking during this period (Arvis et al., 2014).Fig. 3shows Turkey’s pro-gress on the Logistics Performance Index over the last 8 years, which can then be compared with the average of the top five ranked countries inFig. 4.
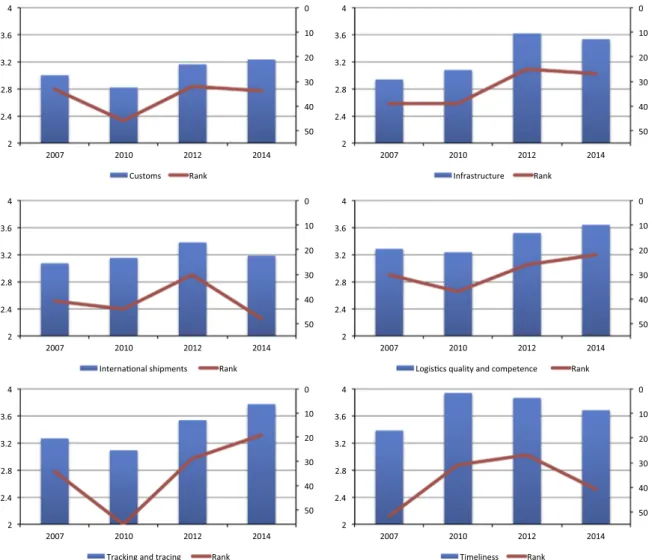
Figs. 4 and 5 also give a more detailed breakdown of the Turkish LPI performance, categorizing data in terms of the 6 indicators.
In customs, border management clearance has been improved due to the decrease in the variability of clearance times. Pro-ductivity has also increased since the implementation of systems to simplify and automate customs procedures.
Turkey’s LPI score in quality of trade and transport infra-structure has also improved. The percentage of GDP in road in-vestment has almost doubled in the last 5 years. But since freight handling capacity of the Turkish ports is still restricted by hin-terland transport facilities, increased throughput causes delays to the movement of goods and increased variability in handling times.
Likewise, Turkey has improved its performance in tracking and tracing of shipments, now ranking 19th. The main reason for this is the widespread use of information and communication technolo-gies (ICT) in public and private institutions.
Turkey has a relatively poor performance on timeliness of shipments in reaching destination because of the need to reroute due to political instability and war in neighboring countries. Be-sides, in the current situation differentiated access rules for in-frastructure and markets lead to the use of sub-optimal routes, some of which are limited by capacity restrictions resulting in increased delivery times and shipment costs.
Although general facility utilization rates and operational charges related to logistics services are relatively low in Turkey (due to delays in port and long, complicated import procedures), Turkey’s shipping charges are relatively high giving it a dis-advantage compared to its regional competitors. Besides,
high-Table 2
Properties of the networks.
LPI indicator Number of input variables
Number of hidden neuron numbers
Number of output neuron numbers
MSE Training function Transfer function for input-hidden Transfer function for hidden-output Infrastructure 25 28 5 0.0048 Levenberg–Marquardt backpropagation Tansig Tansig
Customs 12 46 0.0099 Tansig Tansig
International shipments
23 23 0.0058 Tansig Tansig
Logistics quality and competence
54 52 0.0023 Tansig Tansig
Tracking and tracing 10 43 0.0094 Logsig Tansig
energy cost is one of the greatest obstacles for road transport and the trade network generally.
According to this analysis of Turkey’s logistics performance it is clear that there has been an overall improvement in performance compared to 2007 and 2010; however, scores have not increased in the last two years. In order to suggest a sustainable improve-ment strategy for Turkey’s logistics sector, the following scenario analysis is conducted.
3.1. Scenario analysis
Although one of the appropriate methods to analyze the re-lationship between the WEF and the LPI indicators is ANN due to its predictive quality, the contribution of each input variable to output variable cannot be easily interpreted in ANNs. That is why the literature generally considers ANNs as black boxes. A number of studies in the literature have tried to overcome this “lack of explanatory power” disadvantage of ANNs by examining the weight vectors in ANNs in order to determine the importance of inputs used (Ibrahim, 2013). However, these estimates of weights may vary, resulting in a different weight contribution each time according to the initial weights assigned to the network and those used in the training process (Paliwal and Kumar, 2011). For this reason, a scenario analysis approach is proposed in order to de-termine the importance of inputs on the given output by using the predictive capability of the resulting ANN.
To this end, a scenario analysis procedure which specifies the WEF indicators that have to be increased to their target levels in order to make the highest increase in LPI indicator score is pro-posed. In the proposed scenario analysis, different scenarios with different input values are compared based on their output values
that are predicted using a trained ANN. Since it is nearly im-possible to try all different combinations of input values, we have developed a greedy algorithm that aims to add one indicator to the set of important indicator set in each iteration. Please seeFig. 6for the proposed scenario analysis procedure.
The procedure is run for each LPI indicator individually. For each LPI indicator, initially the related WEF indicators’ current values are obtained from the data sources and the target values are determined based on the scores of benchmark countries or are provided by policy makers.
Then WEF indicators are increased to their target levels one by one in each scenario and the related LPI indicator scores are cal-culated based on the network found in the previous stage. The scenario that gives the highest LPI indicator score is selected and the WEF indicator that is at its target value in this scenario is added to the set of important WEF indicators (Mi). In the further iterations the indicators in this set arefixed to target levels in all scenarios. By this way one indicator is added to the set Miin each iteration. The procedure is ended when the required number of important indicators is reached in Mi.
This scenario analysis procedure is applied to determine three important indicators for Turkey’s performance in each LPI in-dicator. The resulting ANN models (see Section 2.4) are used to conduct scenario analysis. In order to apply the procedure to the particular case,firstly, Turkey’s current WEF indicator values need to be obtained from the WEF report (WEF, 2014). Next, the target values are determined as the average WEF indicator values of the five highest ranked countries in the latest LPI report (Arvis et al., 2014), namely Germany, Netherlands, Belgium, United Kingdom, and Singapore. Then scenarios are built and important WEF in-dicators are found according to the procedure.
For instance, for the LPI indicator “Tracking and tracing” 11 scenarios are built (seeTable 3). Then output values are calculated using the trained network for“Tracking and tracing” (see last six rows inTable 3). Scenario 1 has the highest total output, therefore thefirst indicator, which is “1.02 Intellectual property protection” is specified as the most important indicator. Furthermore, step 1 and step 2 of the procedure are applied once more tofind the second most important criterion. In the second iteration the value of“1.02 Intellectual property protection” is fixed to its target value in all scenarios. In this case scenario 10, which is associated to indicator“9.05 Fixed broadband Internet subscriptions”, is found to have the highest output. Andfinally the third iteration is ap-plied where the values of 1.02 and 9.05 arefixed to their target values in all scenarios.“1.18 Strength of auditing and reporting standards” is found as the third important indicator. As the aim is tofind the three most important indicators, the procedure stops at the end of their iteration.
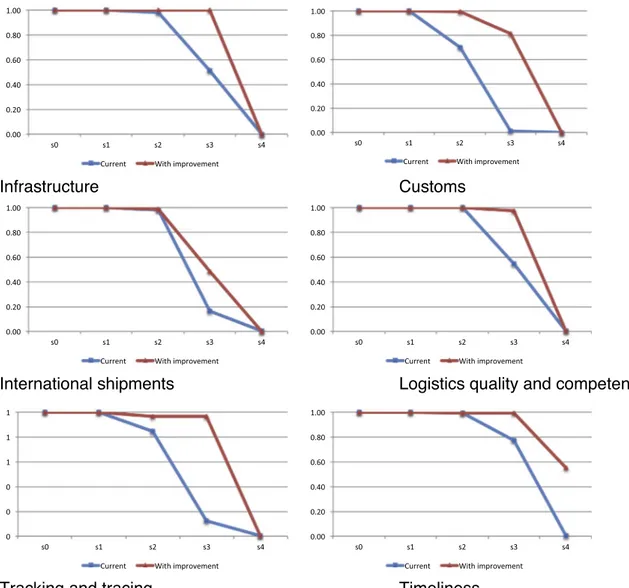
The same procedure is applied for all LPI indicators and the results are presented inTable 4. The resulting improvements if three of the most important WEF indicators are increased to their target level are shown inFig. 7.
3.2. Policy suggestions and implications
As is mentioned inSection 2, the proposed methodology based on ANN and scenario analysis provides the interaction between competitiveness and logistics rather than a cause and effect rela-tion. Therefore; the results of the scenario analysis given inTable 4
highlight the competitiveness variables (i.e., WEF indicators) having the highest positive interaction between the logistics per-formance variables (i.e., LPI indicators).
The results of the scenario analysis given inTable 4show that “Fixed broadband Internet subscriptions”, “Availability of latest technologies” and “Effectiveness of anti-monopoly policy” are the most important variables that policy makers should focus on in
Fig. 3. Turkey’s LPI Score over Time.
order to increase the“Infrastructure” performance of a country. The extent and quality of the transport and communications in-frastructures, along with associated services necessary to facilitate
the movement of goods within the country and across the border are critical elements in improving the logistics competitiveness level of a country. This result is clearly in keeping with the fact that
Fig. 5. Turkey’s performance in LPI indicators.
in the LPI survey the countries having high level infrastructure scores are the ones where the respondents are most satisfied with the country’s information and communication technology (ICT) infrastructure (Arvis et al., 2014). Similarly, the LPI survey results indicate that rail infrastructure inspires general dissatisfaction, most probably due to the fact that rail infrastructure tends to be largely dependent on the exigencies of government policy and investments that may vary over time. On the other hand, in order to understand what anti-monopoly policy can do to logistics in-frastructure it may be worthwhile to have a look at the dereg-ulation of US Railways. According toSlack (2013), prior to dereg-ulation, the Interstate Commerce Commission had tightly con-trolled all aspects of rail competition. After deregulation, railway employed innovative technology. The antimonopoly policy im-proved the efficiency of labor and capital, tariff innovations were possible, private railway companies were allowed and allowed an increase in competition. In fact, in Turkey the government has decided to restructure the Turkish railways (TCDD). The approach consists of restructuring the railways and separation of the ports. The reform program which is mainly based on the EU model is expected to increase the competitiveness of logistics through an increase in the efficiency of infrastructure.
The scenario analysis also shows that the“Reliability of police services”, “Favoritism in decisions of government officials” and “Trade tariffs” are the variables that should be focused on in order to enhance “customs” performance of a country. “Reliability of police services” shows the extent to which the police services can be relied on to enforce law and order in a country. Both in 2012 and 2014 LPI surveys, it was found that from a policy viewpoint, low-performing countries need to pay more attention to“informal (corrupt) payments” if they are to start catching up with the
leading countries. By the same token, government officials have to protect consumer interests and facilitate legitimate trade and in-dustry to uphold a country’s trading integrity as well as to fulfill international obligations. Any favoritism in decisions of govern-ment officials will have a direct negative impact on collecting revenues on dutiable goods. These findings are in clear accord with the results of the 2014 LPI surveys which also found thefirst two variables (“Reliability of police services” and “Favoritism in decisions of government officials”) of high level importance for the “customs”. On the other hand, a customs duty is the indirect tax levied on the import or export of goods in international trade. A tariff, which is actually a list of commodities along with the amount of customs duty, is popularly referred to as a customs duty. In WEF (2014) the trade tariffs are calculated as a weighted average of all the applied tariff rates, including preferential rates that a country applies to the rest of the world. Therefore, there is a close relation between the customs performance of a country and its trade tariffs which are composed of the taxes on imports or exports; i.e. an international trade tariff, or a list of prices for such things as rail service, bus routes, and electricity usage.
Another important finding of the scenario analysis is that in order to have a good performance as regards the“International shipments” indicator, a country should give primary importance to “Legal rights index”, “Trade tariffs, % duty” and “Production pro-cess sophistication”. In fact the legal right index ofWEF (2014)
shows the degree of legal protection of borrowers’ and lenders’ rights. It measures the degree to which collateral and bankruptcy laws protect borrowers’ and lenders’ rights and thus facilitate lending. On the other hand, a company making an international shipment to a country will also need a guarantee and legal rights modification to the product which covers environments exceeding
Table 3
Examples of thefirst iteration scenarios for “Tracking and Tracing”.
WEF Indicators SCENARIOS
Current Target 0 1 2 3 4 5 6 7 8 9 10
1.02 Intellectual property protection 3.61 5.70 3.61 5.70 3.61 3.61 3.61 3.61 3.61 3.61 3.61 3.61 3.61 1.18 Strength of auditing and reporting standards 4.97 5.76 4.97 4.97 5.76 4.97 4.97 4.97 4.97 4.97 4.97 4.97 4.97 11.05 Value chain breadth 4.13 5.32 4.13 4.13 4.13 5.32 4.13 4.13 4.13 4.13 4.13 4.13 4.13 11.06 Control of international distribution 4.61 4.68 4.61 4.61 4.61 4.61 4.68 4.61 4.61 4.61 4.61 4.61 4.61 6.09 Prevalence of trade barriers 4.07 5.01 4.07 4.07 4.07 4.07 4.07 5.01 4.07 4.07 4.07 4.07 4.07 9.01 Availability of latest technologies 5.42 6.33 5.42 5.42 5.42 5.42 5.42 5.42 6.33 5.42 5.42 5.42 5.42 9.02 Firm-level technology absorption 5.34 5.71 5.34 5.34 5.34 5.34 5.34 5.34 5.34 5.71 5.34 5.34 5.34 9.03 FDI and technology transfer 4.87 5.17 4.87 4.87 4.87 4.87 4.87 4.87 4.87 4.87 5.17 4.87 4.87 9.04 Individuals using Internet 45.13 84.04 45.13 45.13 45.13 45.13 45.13 45.13 45.13 45.13 45.13 84.04 45.13 9.05 Fixed broadband Internet subscriptions 10.55 33.54 10.55 10.55 10.55 10.55 10.55 10.55 10.55 10.55 10.55 10.55 33.54 s0 1.000 1.000 1.000 1.000 1.000 1.000 1.000 1.000 1.000 1.000 1.000 s1 1.000 1.000 1.000 1.000 1.000 1.000 1.000 1.000 1.000 1.000 1.000 s2 0.845 0.944 0.923 0.755 0.834 0.946 0.797 0.970 0.830 0.990 0.913 s3 0.126 0.561 0.054 0.714 0.107 0.290 0.070 0.124 0.067 0.058 0.263 s4 0.001 0.001 0.000 0.003 0.001 0.001 0.001 0.001 0.001 0.002 0.001 Total 2.971 3.506 2.978 3.472 2.942 3.238 2.868 3.095 2.897 3.050 3.177 Table 4
Results of the scenario analysis.
LPI indicator Most important WEF indicator Infrastructure 9.05 Fixed broadband Internet
subscriptions
9.01 Availability of latest technologies 6.03 Effectiveness of anti-monopoly policy Customs 1.16 Reliability of police services 1.07 Favoritism in decisions of government
officials
6.10 Trade tariffs
International shipments 8.08 Legal rights index 6.10 Trade tariffs, % duty 11.07 Production process sophistication Logistics quality and competence 5.08 Extent of staff training 5.01 Secondary education enrollment 5.06 Internet access in schools Tracking and tracing 1.02 Intellectual property protection 9.05 Fixed broadband Internet
subscriptions
1.18 Strength of auditing and reporting standards
Timeliness 9.05 Fixed broadband Internet subscriptions
1.14 Business costs of crime and violence 1.18 Strength of auditing and reporting standards
the products stated tolerance for temperature, humidity, moisture, radiation, any abuse, negligent handling or misapplication, or any physical damage of the product. Therefore, there is a very strong relationship between international shipments and the legal rights index; hence, if a country’s legal rights index is low according to WEF, the primary governmental responsibility should be to focus on its improvement in order to increase international shipments. In the same way, successful importing and exporting requires a thorough understanding of the various customs regulations that apply to international shipments. Some countries may have re-strictions which prohibit items from being imported entirely, while others may impose taxes or require special licenses in order to trade products. Whether it is trade tariffs, duties, quotas or non-tariff barriers, almost every nation imposes some form of restric-tion in order to control and regulate foreign imports. It is im-portant to take time to identify these restrictions before at-tempting to import foreign products or export to foreign markets. Within this context it is worth noting the effects that globalized trade is already having on the nature of economic growth and international trade relationships. Globalization can be interpreted as the growing economic interdependence of countries world-wide through an increasing volume and variety of cross-border transactions in goods and services and of international capital flows, as well as through more rapid and widespread diffusion of technology. This affects trade patterns, capitalflows and location
choices offirms at a regional and global level. Therefore, product processing sophistication of a country will be an important in-centive to substantially raise economic growth of developing re-gions, and lead to a considerable shift of production activities to these countries, increasing their international shipment level.
Turning now to the “Logistics quality and competence” per-formance of a country, the scenario analysis results show that the “Extent of staff training”, “Secondary education enrollment “and “Internet access in schools” are to be given top priority. This means that there is a close relationship between a skilled workforce and logistics competitive performance. To begin with, secondary edu-cation enrollment aims to lay the foundations for lifelong learning and human development by offering more subject-skills or-iented instruction using more specialized teachers. Internet access in schools can only enhance this mission (WEF, 2014). Additionally, the employers will need to contribute more to training and gain competitive advantage in the Logistics Sector by developing workforce skills. This will result in a productive and efficient lo-gistics sector, adding value to the industries and customers it serves and enhancing the logistics competitive advantage of the country. For example, Skills for Logistics (SfL) is the Sector Skills Council (SSC) for the freight logistics and wholesaling sector (the Logistics Sector) and SfL works alongside companies in the UK that are involved in the moving, handling, storing and wholesale of goods. Its mission is to enable employers in the Logistics Sector to
gain competitive advantage by developing workforce skills. In countries with low logistics performance index, the establishment of those types of councils may provide successful results in im-proving workforce skills(www.skillsforlogistics.org).
The scenario analysis results also highlight that the perfor-mance of the“Tracking and tracing” capability of a country can be increased by giving special emphasis to “Intellectual property protection”, “Fixed broadband Internet subscriptions” and “Strength of auditing and reporting standards”. In fact, supply chain and channel integrity focuses on who manufactures or moves the product, including proprietary and contact plants, warehouses, shippers, distributors and retailers (Sprink, 2012). The Global Enabling Trade Report (Hanouz et al., 2014) provides a tool for the international trade community to monitor progress on implementing these measures. According to this report, digital connectivity, which is directly related to“Fixed broadband Inter-net subscription”, can go a long way in filling critical information gaps. The use of ICTs by border and customs agencies benefits both government and businesses, resulting in enormous productivity gains. They also help connect producers and customers along supply chains and, thus, improve “Timeliness” performance and provide an important support for the“Tracing and tracking cap-ability” of a country. Good accounting and audit regulations fa-cilitate transparency through better disclosure of information and easier cross-firm comparisons. If regulations are weak, firms may choose not to disclose information and may manipulate the re-quired information. This will naturally result in a negative impact on a country’s “Tracking and tracing” capability as well as “Time-liness” performance.
According to the results of scenario analysis one important indicator affecting“Timeliness” different from “Tracking and tra-cing” is “business cost of crime and violence”. Secure and reliable supply chains and networks enable companies to utilize global markets and resources. However, supply chain crimes are inter-twined in supply chain operations and affect the timeliness of good, service and informationflows. Relying only on inspections or border controls has proven to be always costly and do not generally provide the adequate inspection rate. Enterprises should have self-acquire information related to the backgrounds of their business partners and prospect employees. Additionally, private and political interest should emphasize crime preventive approach instead of post-crime measures. Therefore; different kind of cus-toms government-trade partnerships should be endorsed in order to reduce the business crimes and thus increase the speed of lo-gistics activities in a way to satisfy the customer demand in a timely manner. Good international policy and practices can be conducted to aim better secure supply chains against intended business crime acts such as theft, pilferage documents etc. (Ahokas and Hintsa, 2015).
In fact, all of thesefindings reflect the factors highlighted by the Global Enabling Trade Report (Hanouz et al., 2014) which under-lines that the measures to increase competitiveness of a country include not only those related to market access, such as tariffs and nontariff barriers, but also those that facilitate trade at the more practical level, with more efficient border administration, better infrastructure and telecommunications and improved regulatory and security regimes that secure property rights and reduce transaction costs. To put it more simply, tariffs should not be the only consideration; the quality of logistics, connectivity and border administration plays an equal, if not more important, role in de-termining bilateral trade costs.
4. Conclusions
Thus far, no analytical tools have been devised to examine the relationship between national competitiveness and logistics
performance of a country in any detail. In this study, a new hybrid methodology is proposed as just such a tool. This involves the logistics performances of the countries being converted to CBD scores and then an ANN model is used to quantify the relations for each of the LPI’s six indicators. Finally, a number of scenario ana-lyses are conducted to see the most important competitiveness factor affecting the logistics performance of the countries.
According to the results of scenario analysis for Turkey, an overview of all the important indicators shows that“fixed broad-band Internet subscriptions” is the most frequently encountered indicator. This is because the development diffusion and increas-ing impact of logistics to a large extent hincreas-inge uponfixed broad-band Internet. Countries trying to improve their logistics compe-titiveness level should especially give priority to extending and improving their broad band Internet access.
It is important to underline that the scenario analysis con-ducted in this paper is for Turkey. In this study, the target values are determined as the average WEF indicator values of thefive highest ranked countries. However, the proposed method can also be used to highlight the differentiated needs of different countries. For this, the same network can be used with specifically designed scenarios for the specific country. The target values can be de-termined as the average of benchmark countries or can be set by policy makers, depending on the country being studied. Ad-ditionally, the sustainability indicators recently analyzed byArvis et al. (2014)can also be incorporated into the analysis.
There is debate in the literature as to whether logistics and economic growth have two-way interaction (Nguyen and Tongzon, 2010). This study shows that improvement in some of the com-petitiveness indicators has an important positive impact on the logistics performance of a country. In fact, logistics improvement in its turn is expected to enhance economic growth because in-vestments and infrastructure will increase demands for goods and services. Similarly, an improvement in logistics performance is expected to decrease the travel time which sets in train another series of economic consequences, such as enabling producers to gain access to more distant markets. Additionally, such an im-provement will stimulate local production and attract foreign di-rect investment, which is itself an important engine for economic growth (Lean et al., 2014). It would therefore be a worthwhile goal of further study to analyze and ascertain to what extent this re-verse relation is also true. Such an approach, as well as looking at effects on economic growth, would also highlight how improve-ment of a country’s logistics performance can affect its trade level.
APPENDIX A. Related WEF indicators for LPI Indicators Infrastructure
Property rights
Diversion of public funds
1.08 Wastefulness of government spending 1.13 Business costs of terrorism
12.05 Gov’t procurement of advanced tech products, 2.01 Quality of overall infrastructure
2.02 Quality of roads
2.04 Quality of port infrastructure 2.05 Quality of air transport infrastructure 2.06 Available airline seat km/week, millions 2.07 Quality of electricity supply
2.08 Mobile telephone subscriptions 2.09 Fixed telephone lines
3.01 Government budget balance 3.02 Gross national savings 3.04 General government debt 5.06 Internet access in schools
6.03 Effectiveness of anti-monopoly policy 8.03 Financing through local equity market 8.04 Ease of access to loans
9.01 Availability of latest technologies 9.02 Firm-level technology absorption 9.03 FDI and technology transfer 9.04 Individuals using Internet
9.05 Fixed broadband Internet subscriptions Customs
1.04 Public trust in politicians
1.07 Favoritism in decisions of government officials 1.16 Reliability of police services
4.03 Business impact of tuberculosis 4.04 Tuberculosis cases/100,000 pop. 4.05 Business impact of HIV/AIDS 6.05 Total tax rate, % profits 6.08 Agricultural policy costs 6.09 Prevalence of trade barriers 6.10 Trade tariffs, % duty
6.11 Prevalence of foreign ownership 6.14 Imports as a percentage of GDP
International shipments
1.09 Burden of government regulation 1.13 Business costs of terrorism
1.14 Business costs of crime and violence 1.15 Organized crime
1.21 Strength of investor protection 10.01 Domestic market size index 10.02 Foreign market size index 11.04 Nature of competitive advantage 11.05 Value chain breadth
11.06 Control of international distribution 11.07 Production process sophistication 11.08 Extent of marketing
11.09 Willingness to delegate authority 3.03 Inflation, annual % change 6.05 Total tax rate, % profits 6.09 Prevalence of trade barriers 6.10 Trade tariffs, % duty
6.11 Prevalence of foreign ownership 6.12 Business impact of rules on FDI 6.16 Buyer sophistication
8.05 Venture capital availability 8.06 Soundness of banks 8.08 Legal rights index
Logistics quality and competence 1.02 Intellectual property protection 1.04 Public trust in politicians
1.12 Transparency of government policymaking 1.17 Ethical behavior offirms
1.19 Efficacy of corporate boards
1.20 Protection of minority shareholders’ interests 1.21 Strength of investor protection
10.01 Domestic market size index 10.02 Foreign market size index 11.01 Local supplier quantity 11.02 Local supplier quality 11.03 State of cluster development 11.04 Nature of competitive advantage 11.05 Value chain breadth
11.06 Control of international distribution 11.07 Production process sophistication 11.08 Extent of marketing
11.09 Willingness to delegate authority 12.01 Capacity for innovation
12.02 Quality of scientific research institutions 12.03 Company spending on R&D
12.04 University-industry collaboration in R&D 12.06 Availability of scientists and engineers 3.03 Inflation, annual % change
5.01 Secondary education enrollment, gross 5.02 Tertiary education enrollment, gross % 5.03 Quality of the educational system 5.04 Quality of math and science education 5.05 Quality of management schools 5.06 Internet access in schools
5.07 Availability of research and training services 5.08 Extent of staff training
6.01 Intensity of local competition 6.02 Extent of market dominance
6.03 Effectiveness of anti-monopoly policy 6.05 Total tax rate, % profits
6.06 No. procedures to start a business 6.07 No. days to start a business 6.10 Trade tariffs, % duty
6.11 Prevalence of foreign ownership 6.12 Business impact of rules on FDI 6.15 Degree of customer orientation 6.16 Buyer sophistication
7.01 Cooperation in labor-employer relations 7.02 Flexibility of wage determination 7.03 Hiring andfiring practices 7.04 Redundancy costs, weeks of salary 7.06 Pay and productivity
7.07 Reliance on professional management 7.10 Women in labor force, ratio to men 8.04 Ease of access to loans
Tracking and tracing
1.02 Intellectual property protection
1.18 Strength of auditing and reporting standards 11.05 Value chain breadth
11.06 Control of international distribution 6.09 Prevalence of trade barriers
9.01 Availability of latest technologies 9.02 Firm-level technology absorption 9.03 FDI and technology transfer 9.04 Individuals using Internet
9.05 Fixed broadband Internet subscriptions Timeliness
1.09 Burden of government regulation 1.13 Business costs of terrorism
1.14 Business costs of crime and violence 1.15 Organized crime
1.18 Strength of auditing and reporting standards 11.04 Nature of competitive advantage
4.03 Business impact of tuberculosis 4.04 Tuberculosis cases
4.05 Business impact of HIV/AIDS 6.09 Prevalence of trade barriers 6.10 Trade tariffs, % duty 7.06 Pay and productivity 8.06 Soundness of banks
9.01 Availability of latest technologies 9.02 Firm-level technology absorption 9.03 FDI and technology transfer 9.04 Individuals using Internet,
References
〈www.skillsforlogistics.org〉 (accessed on 15.12.14).
Ahokas, J., Hintsa, J., 2015. Assuring Supply Chain Continuity in Industrial Supply Chains and Complying with Authorised Economical Operator AEO Europe. BIT Research Centre, Aalto University School of Science and Technology, Finland, Final report from the Toteemi project (accessed on 15.10.01)http://legacy-tuta. hut.fi/logistics/publications/Assuring_SC_Continuity.pdf.
Artto, E.W., 1987. Relative total costs– an approach to competitiveness measure-ment of industries. Manag. Int. Rev. 27, 47–58.
Arvis, J.-F., Mustra, M.A., Panzer, J., Ojala, L., Naula, T., 2007. Connecting to Compete 2007: Trade Logistics in the Global Economy. World Bank, United States. Arvis, J.-F., Mustra, M.A., Ojala, L., Stepherd, B., Saslavsky, D., 2010. Connecting to
Compete 2010: Trade Logistics in the Global Economy. World Bank, United States.
Arvis, J.-F., Mustra, M.A., Ojala, L., Stepherd, B., Saslavsky, D., 2012. Connecting to Compete 2012: Trade Logistics in the Global Economy. World Bank, United States.
Arvis, J.-F., Saslavsky, D., Ojala, L., Stepherd, B., Busch, C., Raj, A., 2014. Connecting to Compete 2014: Trade Logistics in the Global Economy. World Bank, United States.
Bahmanyar, A.R., Karami, A., 2014. Power system voltage stability monitoring using artificial neural networks with a reduced set of inputs. Electr. Power Energy Syst. 58, 246–256.
Barnister, D., Berechman, Y., 2001. Transport investment and the promotion of economic growth. J. Transp. Geogr. 9 (3), 209–218.
Boznar, M., Lesjak, M., Mlakar, P., 1993. A neural network-based method for short-term predictions of ambient SO2 concentrations in highly polluted industrial areas of complex terrain. Atmos. Environ. B Urban Atmos. 27B, 221–230. Chen, N., Novy, D., 2011. Gravity, trade integration, and heterogeneity across
in-dustries. J. Int. Econ. 85, 206–221.
Elgazzar, S.H., Tipi, N.S., Hubbard, N.J., Leach, D.Z., 2012. Linking supply chain processes’ performance to a company’s financial strategic objectives. Eur. J. Oper. Res. 223, 276–289.
Fan, F.H., Ma, Q., Ge, J., Peng, Q.Y., Riley, W.W., Tang, S.Z., 2013. Prediction of texture characteristics from extrusion food surface images using a computer vision system and artificial neural networks. J. Food Eng. 118, 426–433.
Gately, E., 1996. Neural Networks for Financial Forecasting. John Wiley & Sons, Inc, USA.
Hanouz, M.D., Geiger, T., Doherty, S., (Eds.), 2014. The Global Enabling Trade Report 2014. World Economic Forum Insight Report, Geneva.
Hruschka, H., 1993. Determining market response functions by neural network modeling: a comparison to econometric techniques. Eur. J. Oper. Res. 66, 27–35. Hwarng, H.B., Ang, H.T., 2001. A simple neural network for ARMA (p,q) time series.
Omega 29, 319–333.
Ibrahim, O.M., 2013. A comparison of methods for assessing the relative importance of input variables in artificial neural networks. J. Appl. Sci. Res. 9 (11), 5692–5700.
ITF (International Transport Forum), 2014. Drivers of Logistics Performance: Case Studyhttp://internationaltransportforum.org/cpb/pdf/logistics-performance. pdf.
Kabak, Ö., Ülengin, F., Önsel,Ş., Özaydin, Ö., Aktaş, E., 2014. Cumulative belief de-grees approach for analyzing the competitiveness of the automotive industry.
Knowl.-Based Syst. 70, 15–25.
Kabak, O., Ruan, D., 2011a. A cumulative belief degree-based approach for missing values in nuclear safeguards evaluation. IEEE Trans. Knowl. Data Eng. 23 (10), 1441–1454.
Kabak, O., Ruan, D., 2011b. A comparison study of fuzzy MADM methods in nuclear safeguards evaluation. J. Glob. Optim. 51 (2), 209–226.
Kalogirou, S.A., Mathioulakis, E., Belessiotis, V., 2014. Artificial neural networks for the performance prediction of large solar systems. Renew. Energy 63, 90–97. Laguarda-Miro, N., Ferreira, F.W., García-Breijo, E., Ibánez-Civera, J., Gil-Sánchez, L.,
Garrigues-Baixauli, J., 2012. Glyphosate detection by voltammetric techniques. A comparison between statistical methods and an artificial neural network. Sens. Actuators B, 528–536.
Lean, H.H., Huang, W., Hong, J., 2014. Logistics and economic development: ex-perience from China. Transp. Policy 32, 96–104.
Masters, T., 1993. Practical Neural Network Recipes in Cþ þ. Academic Press, United States.
Nguyen, H.-O., Tongzon, J., 2010. Causal nexus between the transport and logistics sector and trade: the case of Australia. Transp. Policy 17 (3), 135–146. Paliwal, M., Kumar, U.A., 2011. Assessing the contribution of variables in feed
for-ward neural network. Appl. Soft Comput. 11 (4), 3690–3696.
Resop, J.P., 2006. A Comparison of Artificial Neural Networks and Statistical Re-gression with Biological Resources Applications (M. Sc. thesis). Faculty of the Graduate School of the University of Maryland, College Park.
Ruan, D., Kabak, O., Quinones, R., 2013. An ordered weighted averaging operator-based cumulative belief degree approach for energy policy evaluation. Int. J. Adv. Oper. Manag. 5 (1), 58–73.
Sala-i-Martín, X., Crotti, R., Di Battista, A., Hanouz, M.D., Galvan, C., Geiger, T., Marti, G., 2015. Reaching Beyond the New Normal: Findings from the Global Com-petitiveness Index 2015–2016, World Economic Forum. Oxford University Press, New York.
Sala-i-Martin, X., Bilbao-Osorio, B., Blanke, J., Crotti, R., Hanouz, M.D., Geiger, T., Ko, C., 2012. The Global Competitiveness Index 2012–2013: Strengthening Recovery by Raising Productivity, World Economic Forum. Oxford University Press, New York.
Slack, B., 2013. Rail Deregulation in the United States. In: Rodrigue, J.-P. (Ed.), The Geography of Transportation Systems. Routledge, New York, onlinehttps:// people.hofstra.edu/geotrans/eng/ch9en/appl9en/ch9a1en.html.
Sprink, J., 2012. Overview of the selection of strategic authentication and tracing programmes. In: Wetheimer, A., Wang, P.G. (Eds.), Counterfeit Medicines Vo-lume I: Policy, Economics, and CountermeasuresILM Publication, UK, pp. 111–128.
Swanson, N.R., White, H., 1997. Forecasting economic time series usingflexible versusfixed specification and linear versus nonlinear econometric models. Int. J. Forecast. 13 (4), 439–461.
Töyli, J., Hakkinen, L., Ojala, L., Naula, T., 2008. Logistics andfinancial performance: an analysis of 424 Finnish small and medium-sized enterprises. Int. J. Phys. Distrib. Logist. Manag. 38 (1), 57–80.
Tang, Z., Fishwick, P.A., 1993. Feed forward neural nets as models for time series forecasting. ORSA J. Comput. 5 (4), 374–385.
World Economic Forum (WEF), 2013. Global Competitiveness, Report 2013–2014. World Economic Forum (WEF), 2014. Global Competitiveness, Report 2014–2015. Yoon, Y., Swales, G., Margavio, T.M., 1993. A comparison of discriminant analysis