arXiv:1412.5258v1 [hep-ex] 17 Dec 2014
Study of
J/ψ → ηφπ
+π
−at BESIII
M. Ablikim1 , M. N. Achasov8,a, X. C. Ai1 , O. Albayrak4 , M. Albrecht3 , D. J. Ambrose43 , A. Amoroso47A,47C, F. F. An1 , Q. An44 , J. Z. Bai1, R. Baldini Ferroli19A, Y. Ban30
, D. W. Bennett18
, J. V. Bennett4
, M. Bertani19A, D. Bettoni20A, J. M. Bian42, F. Bianchi47A,47C, E. Boger22,h, O. Bondarenko24, I. Boyko22, R. A. Briere4, H. Cai49, X. Cai1, O. Cakir39A,b,
A. Calcaterra19A, G. F. Cao1
, S. A. Cetin39B, J. F. Chang1 , G. Chelkov22,c, G. Chen1 , H. S. Chen1 , H. Y. Chen2 , J. C. Chen1 , M. L. Chen1 , S. J. Chen28 , X. Chen1 , X. R. Chen25 , Y. B. Chen1 , H. P. Cheng16 , X. K. Chu30 , G. Cibinetto20A, D. Cronin-Hennessy42, H. L. Dai1, J. P. Dai33, A. Dbeyssi13, D. Dedovich22, Z. Y. Deng1, A. Denig21, I. Denysenko22,
M. Destefanis47A,47C, F. De Mori47A,47C, Y. Ding26
, C. Dong29 , J. Dong1 , L. Y. Dong1 , M. Y. Dong1 , S. X. Du51 , P. F. Duan1 , J. Z. Fan38 , J. Fang1 , S. S. Fang1 , X. Fang44 , Y. Fang1 , L. Fava47B,47C, F. Feldbauer21 , G. Felici19A, C. Q. Feng44
, E. Fioravanti20A, M. Fritsch13,21, C. D. Fu1
, Q. Gao1
, Y. Gao38
, I. Garzia20A, K. Goetzen9
, W. X. Gong1 , W. Gradl21 , M. Greco47A,47C, M. H. Gu1 , Y. T. Gu11 , Y. H. Guan1 , A. Q. Guo1 , L. B. Guo27 , T. Guo27 , Y. Guo1 , Y. P. Guo21 , Z. Haddadi24 , A. Hafner21 , S. Han49 , Y. L. Han1 , F. A. Harris41 , K. L. He1 , Z. Y. He29 , T. Held3 , Y. K. Heng1 , Z. L. Hou1 , C. Hu27 , H. M. Hu1 , J. F. Hu47A, T. Hu1 , Y. Hu1 , G. M. Huang5 , G. S. Huang44 , H. P. Huang49 , J. S. Huang14 , X. T. Huang32, Y. Huang28, T. Hussain46, Q. Ji1, Q. P. Ji29, X. B. Ji1, X. L. Ji1, L. L. Jiang1, L. W. Jiang49, X. S. Jiang1, J. B. Jiao32 , Z. Jiao16 , D. P. Jin1 , S. Jin1 , T. Johansson48 , A. Julin42 , N. Kalantar-Nayestanaki24 , X. L. Kang1 , X. S. Kang29 , M. Kavatsyuk24 , B. C. Ke4 , R. Kliemt13 , B. Kloss21 , O. B. Kolcu39B,d, B. Kopf3 , M. Kornicer41 , W. Kuehn23 , A. Kupsc48 , W. Lai1, J. S. Lange23, M. Lara18, P. Larin13, C. H. Li1, Cheng Li44, D. M. Li51, F. Li1, G. Li1, H. B. Li1, J. C. Li1,
Jin Li31 , K. Li12 , K. Li32 , P. R. Li40 , T. Li32 , W. D. Li1 , W. G. Li1 , X. L. Li32 , X. M. Li11 , X. N. Li1 , X. Q. Li29 , Z. B. Li37 , H. Liang44 , Y. F. Liang35 , Y. T. Liang23 , G. R. Liao10 , D. X. Lin13 , B. J. Liu1 , C. L. Liu4 , C. X. Liu1 , F. H. Liu34, Fang Liu1, Feng Liu5, H. B. Liu11, H. H. Liu1, H. H. Liu15, H. M. Liu1, J. Liu1, J. P. Liu49, J. Y. Liu1,
K. Liu38 , K. Y. Liu26 , L. D. Liu30 , P. L. Liu1 , Q. Liu40 , S. B. Liu44 , X. Liu25 , X. X. Liu40 , Y. B. Liu29 , Z. A. Liu1 , Zhiqiang Liu1 , Zhiqing Liu21 , H. Loehner24 , X. C. Lou1,e, H. J. Lu16 , J. G. Lu1 , R. Q. Lu17 , Y. Lu1 , Y. P. Lu1 , C. L. Luo27 , M. X. Luo50, T. Luo41, X. L. Luo1, M. Lv1, X. R. Lyu40, F. C. Ma26, H. L. Ma1, L. L. Ma32, Q. M. Ma1, S. Ma1, T. Ma1,
X. N. Ma29, X. Y. Ma1, F. E. Maas13, M. Maggiora47A,47C, Q. A. Malik46, Y. J. Mao30, Z. P. Mao1, S. Marcello47A,47C, J. G. Messchendorp24 , J. Min1 , T. J. Min1 , R. E. Mitchell18 , X. H. Mo1 , Y. J. Mo5 , C. Morales Morales13 , K. Moriya18 , N. Yu. Muchnoi8,a, H. Muramatsu42
, Y. Nefedov22
, F. Nerling13
, I. B. Nikolaev8,a, Z. Ning1
, S. Nisar7
, S. L. Niu1 , X. Y. Niu1, S. L. Olsen31, Q. Ouyang1, S. Pacetti19B, P. Patteri19A, M. Pelizaeus3, H. P. Peng44, K. Peters9, J. L. Ping27,
R. G. Ping1 , R. Poling42 , Y. N. Pu17 , M. Qi28 , S. Qian1 , C. F. Qiao40 , L. Q. Qin32 , N. Qin49 , X. S. Qin1 , Y. Qin30 , Z. H. Qin1 , J. F. Qiu1 , K. H. Rashid46 , C. F. Redmer21 , H. L. Ren17 , M. Ripka21 , G. Rong1 , X. D. Ruan11 , V. Santoro20A, A. Sarantsev22,f, M. Savri´e20B, K. Schoenning48, S. Schumann21, W. Shan30, M. Shao44, C. P. Shen2, P. X. Shen29, X. Y. Shen1
, H. Y. Sheng1
, M. R. Shepherd18
, W. M. Song1
, X. Y. Song1
, S. Sosio47A,47C, S. Spataro47A,47C, B. Spruck23 , G. X. Sun1 , J. F. Sun14 , S. S. Sun1 , Y. J. Sun44 , Y. Z. Sun1 , Z. J. Sun1 , Z. T. Sun18 , C. J. Tang35 , X. Tang1 , I. Tapan39C, E. H. Thorndike43, M. Tiemens24, D. Toth42, M. Ullrich23, I. Uman39B, G. S. Varner41, B. Wang29, B. L. Wang40, D. Wang30 , D. Y. Wang30 , K. Wang1 , L. L. Wang1 , L. S. Wang1 , M. Wang32 , P. Wang1 , P. L. Wang1 , Q. J. Wang1 , S. G. Wang30 , W. Wang1 , X. F. Wang38
, Y. D. Wang19A, Y. F. Wang1
, Y. Q. Wang21
, Z. Wang1
, Z. G. Wang1 , Z. H. Wang44, Z. Y. Wang1, T. Weber21, D. H. Wei10, J. B. Wei30, P. Weidenkaff21, S. P. Wen1, U. Wiedner3, M. Wolke48,
L. H. Wu1, Z. Wu1, L. G. Xia38, Y. Xia17, D. Xiao1, Z. J. Xiao27, Y. G. Xie1, G. F. Xu1, L. Xu1, Q. J. Xu12, Q. N. Xu40, X. P. Xu36 , L. Yan44 , W. B. Yan44 , W. C. Yan44 , Y. H. Yan17 , H. X. Yang1 , L. Yang49 , Y. Yang5 , Y. X. Yang10 , H. Ye1 , M. Ye1 , M. H. Ye6 , J. H. Yin1 , B. X. Yu1 , C. X. Yu29 , H. W. Yu30 , J. S. Yu25 , C. Z. Yuan1 , W. L. Yuan28 , Y. Yuan1 , A. Yuncu39B,g, A. A. Zafar46
, A. Zallo19A, Y. Zeng17
, B. X. Zhang1 , B. Y. Zhang1 , C. Zhang28 , C. C. Zhang1 , D. H. Zhang1 , H. H. Zhang37 , H. Y. Zhang1 , J. J. Zhang1 , J. L. Zhang1 , J. Q. Zhang1 , J. W. Zhang1 , J. Y. Zhang1 , J. Z. Zhang1 , K. Zhang1 , L. Zhang1 , S. H. Zhang1 , X. J. Zhang1 , X. Y. Zhang32 , Y. Zhang1 , Y. H. Zhang1 , Z. H. Zhang5 , Z. P. Zhang44 , Z. Y. Zhang49, G. Zhao1, J. W. Zhao1, J. Y. Zhao1, J. Z. Zhao1, Lei Zhao44, Ling Zhao1, M. G. Zhao29, Q. Zhao1, Q. W. Zhao1 , S. J. Zhao51 , T. C. Zhao1 , Y. B. Zhao1 , Z. G. Zhao44 , A. Zhemchugov22,h, B. Zheng45 , J. P. Zheng1 , W. J. Zheng32 , Y. H. Zheng40 , B. Zhong27 , L. Zhou1 , Li Zhou29 , X. Zhou49 , X. K. Zhou44 , X. R. Zhou44 , X. Y. Zhou1 , K. Zhu1, K. J. Zhu1, S. Zhu1, X. L. Zhu38, Y. C. Zhu44, Y. S. Zhu1, Z. A. Zhu1, J. Zhuang1, B. S. Zou1, J. H. Zou1
(BESIII Collaboration) 1
Institute of High Energy Physics, Beijing 100049, People’s Republic of China 2 Beihang University, Beijing 100191, People’s Republic of China
3
Bochum Ruhr-University, D-44780 Bochum, Germany 4
Carnegie Mellon University, Pittsburgh, Pennsylvania 15213, USA 5
Central China Normal University, Wuhan 430079, People’s Republic of China 6 China Center of Advanced Science and Technology, Beijing 100190, People’s Republic of China 7
COMSATS Institute of Information Technology, Lahore, Defence Road, Off Raiwind Road, 54000 Lahore, Pakistan 8
G.I. Budker Institute of Nuclear Physics SB RAS (BINP), Novosibirsk 630090, Russia 9 GSI Helmholtzcentre for Heavy Ion Research GmbH, D-64291 Darmstadt, Germany
10
Guangxi Normal University, Guilin 541004, People’s Republic of China 11
GuangXi University, Nanning 530004, People’s Republic of China 12 Hangzhou Normal University, Hangzhou 310036, People’s Republic of China 13
Helmholtz Institute Mainz, Johann-Joachim-Becher-Weg 45, D-55099 Mainz, Germany 14
15
Henan University of Science and Technology, Luoyang 471003, People’s Republic of China 16
Huangshan College, Huangshan 245000, People’s Republic of China 17 Hunan University, Changsha 410082, People’s Republic of China
18
Indiana University, Bloomington, Indiana 47405, USA 19
(A)INFN Laboratori Nazionali di Frascati, I-00044, Frascati, Italy; (B)INFN and University of Perugia, I-06100, Perugia, Italy 20
(A)INFN Sezione di Ferrara, I-44122, Ferrara, Italy; (B)University of Ferrara, I-44122, Ferrara, Italy 21
Johannes Gutenberg University of Mainz, Johann-Joachim-Becher-Weg 45, D-55099 Mainz, Germany 22 Joint Institute for Nuclear Research, 141980 Dubna, Moscow region, Russia
23 Justus Liebig University Giessen, II. Physikalisches Institut, Heinrich-Buff-Ring 16, D-35392 Giessen, Germany 24
KVI-CART, University of Groningen, NL-9747 AA Groningen, The Netherlands 25
Lanzhou University, Lanzhou 730000, People’s Republic of China 26 Liaoning University, Shenyang 110036, People’s Republic of China 27
Nanjing Normal University, Nanjing 210023, People’s Republic of China 28
Nanjing University, Nanjing 210093, People’s Republic of China 29 Nankai University, Tianjin 300071, People’s Republic of China
30
Peking University, Beijing 100871, People’s Republic of China 31
Seoul National University, Seoul, 151-747 Korea 32 Shandong University, Jinan 250100, People’s Republic of China 33
Shanghai Jiao Tong University, Shanghai 200240, People’s Republic of China 34
Shanxi University, Taiyuan 030006, People’s Republic of China 35
Sichuan University, Chengdu 610064, People’s Republic of China 36
Soochow University, Suzhou 215006, People’s Republic of China 37
Sun Yat-Sen University, Guangzhou 510275, People’s Republic of China 38
Tsinghua University, Beijing 100084, People’s Republic of China 39 (A)Istanbul Aydin University, 34295 Sefakoy, Istanbul, Turkey; (B)Dogus University, 34722 Istanbul, Turkey; (C)Uludag University, 16059 Bursa, Turkey 40
University of Chinese Academy of Sciences, Beijing 100049, People’s Republic of China 41 University of Hawaii, Honolulu, Hawaii 96822, USA
42
University of Minnesota, Minneapolis, Minnesota 55455, USA 43
University of Rochester, Rochester, New York 14627, USA
44 University of Science and Technology of China, Hefei 230026, People’s Republic of China 45
University of South China, Hengyang 421001, People’s Republic of China 46
University of the Punjab, Lahore-54590, Pakistan
47 (A)University of Turin, I-10125, Turin, Italy; (B)University of Eastern Piedmont, I-15121, Alessandria, Italy; (C)INFN, I-10125, Turin, Italy
48
Uppsala University, Box 516, SE-75120 Uppsala, Sweden 49 Wuhan University, Wuhan 430072, People’s Republic of China 50 Zhejiang University, Hangzhou 310027, People’s Republic of China 51
Zhengzhou University, Zhengzhou 450001, People’s Republic of China a Also at the Novosibirsk State University, Novosibirsk, 630090, Russia
b Also at Ankara University, 06100 Tandogan, Ankara, Turkey
c Also at the Moscow Institute of Physics and Technology, Moscow 141700, Russia and at the Functional Electronics Laboratory, Tomsk State University, Tomsk, 634050, Russia
d Currently at Istanbul Arel University, Kucukcekmece, Istanbul, Turkey e
Also at University of Texas at Dallas, Richardson, Texas 75083, USA f Also at the PNPI, Gatchina 188300, Russia
g Also at Bogazici University, 34342 Istanbul, Turkey
h Also at the Moscow Institute of Physics and Technology, Moscow 141700, Russia
Based on a sample of 2.25×10⁸
J/ψ events taken with the BESIII detector at the BEPCII collider, we present the results of a study of the decay J/ψ → ηφπ+
π−. The Y (2175) resonance is observed in the invariant mass spectrum of φf0(980) with a statistical significance of greater than 10σ. The corresponding mass and width are determined to be M = 2200 ± 6(stat.) ± 5(syst.) MeV/c2
and Γ = 104 ± 15(stat.) ± 15(syst.) MeV, respectively, and the product branching fraction is measured to be B(J/ψ → ηY (2175), Y (2175) → φf0(980), f0(980) → π+π−) = (1.20±0.14(stat.) ±0.37(syst.))× 10−4. The results are consistent within errors with those of previous experiments. We also measure the branching fraction of J/ψ → φf1(1285) with f1(1285) → ηπ+
π− and set upper limits on the branching fractions for J/ψ → φη(1405)/φX(1835)/φX(1870) with η(1405)/X(1835)/X(1870) → ηπ+
π−at the 90% confidence level.
I. INTRODUCTION
The Y (2175), also referred to as the φ(2170) by the Particle Data Group (PDG 2014) [1], was first ob-served by the BABAR experiment [2] in the e+e− →
γISRφf0(980) initial-state-radiation (ISR) process. It
was later confirmed by the BESII experiment in J/ψ → ηφf0(980) decays [3] and via the same ISR process by
the BELLE [4] and BABAR experiments [5] with in-creased statistics. Since the Y (2175) resonance is pro-duced via ISR in e+e− collisions, it is known to have
JP C = 1−−. This observation stimulated the
specula-tion that the Y (2175) may be an s-quark counterpart to the Y (4260) [6, 7], since both are produced in e+e−
an-nihilation and exhibit similar decay patterns. Like for the Y (4260), a number of different interpretations have been proposed for the Y (2175) with predicted masses that are consistent, within errors, with the experimental measurements. These include: an ss-gluon hybrid [8]; an excited φ state [9]; a tetraquark state [10]; a ΛΛ bound state [11,12]; or an ordinary φf0(980) resonance
produced by interactions between the final state parti-cles [13].
A recent review [14] discusses the basic problem of the large expected decay widths into two mesons, which con-tradicts experimental observations. Around the mass of the Y (2175), there are two conventional 1−−s¯s states in
the quark model, 23D
1and 33S1. According to Ref. [15],
the width of the 33S
1s¯s state is expected to be about 380
MeV. The total width of the 23D
1 state from both 3P0
and flux tube model is expected to be around (150 ∼ 250) MeV [9]. However, the predictions from these strong de-cay models sometimes deviate from the experimentally found width by a factor of two or three. For compari-son, the widths of the 33S
1 and 23D1 charmonium are
less than 110 MeV [16]. Fortunately, the characteristic decay modes of Y(2175) as either a hybrid or s¯s state are quite different, which may be used to distinguish the hybrid and s¯s schemes. The possibility of Y (2175) aris-ing from S-wave threshold effects is not excluded. As of now, none of these interpretations have been either es-tablished or ruled out by experiment. The confirmation and study of the Y (2175) in J/ψ → ηφπ+π−with a large
data sample is necessary for clarifying its nature. The J/ψ → ηφπ+π− decay also offers a unique
op-portunity to investigate the properties of the f1(1285),
the η(1295), and the η(1405)/η(1475) resonances. The f1(1285) is usually considered to be a member of the
axial vector meson nonet, but the interpretation of the η(1295) is less clear. Both the f1(1285) and the η(1295)
were seen in fixed target experiments, but the η(1295) was not evident in central production, in γγ collisions, or in J/ψ decays. Therefore it has been speculated that either the f1(1285), at least in some cases, contains an
η(1295) component [17], or that the η(1295) does not ex-ist. The η(1405)/η(1475) pseudoscalar was once regarded as a glueball candidate since it is copiously produced in J/ψ radiative decays [18] and there was only an upper
limit from γγ collisions [19]. But this viewpoint changed when the η(1405)/η(1475) was also observed in untagged γγ collisions [20] and in J/ψ hadronic decays.
In addition, two interesting resonances, the X(1835) and the X(1870), were observed in J/ψ → γπ+π−η′ [21,
22] and J/ψ → ωπ+π−η [23], respectively. The X(1835),
in particular, inspired many possible theoretical inter-pretations, including a pp bound state [24, 25], a glue-ball [26–28], and final state interactions (FSI) between a proton and antiproton [29–31]. To better understand the properties of these two resonances, one needs to fur-ther study their production in different J/ψ decay modes. For example, the search for them in the ηπ+π− mass
spectrum recoiling against the φ in J/ψ decays would be rather interesting for clarifying their nature.
In this paper, we present a study of the decay J/ψ → ηφπ+π− with η → γγ and φ → K+K− decay modes
using a sample of 2.25 × 10⁸ J/ψ events collected with
the Beijing Spectrometer (BESIII) located at the Bei-jing Electron-Positron Collider (BEPCII) [32]. The mass and width of the Y (2175), as well as its production rate, are measured. In addition, the production rates of the f1(1285), the η(1405)/η(1475), the X(1835), and the
X(1870) in J/ψ hadronic decays associated with a φ me-son are investigated.
II. DETECTOR AND MONTE CARLO
SIMULATION
The BESIII detector is a magnetic spectrometer [32] located at BEPCII, which is a double-ring e+e− collider
with a design peak luminosity of 1033 cm−2 s−1 at a
center-of-mass energy of 3.773 GeV. The cylindrical core of the BESIII detector consists of a helium-based main drift chamber (MDC), a plastic scintillator time-of-flight system (TOF), and a CsI (Tl) electromagnetic calorime-ter (EMC), which are all enclosed in a superconducting solenoidal magnet providing a 1.0 T magnetic field. The solenoid is supported by an octagonal flux-return yoke with modules of resistive plate muon counters interleaved with steel. The acceptance for charged particles and pho-tons is 93% of the full 4π solid angle. The momentum resolution for a charged particle at 1 GeV/c is 0.5%, and the ionization energy loss per unit path-length (dE/dx) resolution is 6%. The EMC measures photon energies with a resolution of 2.5% (5%) at 1 GeV in the barrel (end-caps). The time resolution for the TOF is 80 ps in the barrel and 110 ps in the end-caps.
The GEANT-based simulation software BOOST [33] is used to simulate the desired Monte Carlo (MC) sam-ples. An inclusive J/ψ MC sample is used to estimate the backgrounds. The production of the J/ψ resonance is simulated by the MC event generator KKMC [34,35], while the decays are generated by BesEvtGen [36–38] for known decay modes with branching fractions set at the PDG [1] world average values, and by the Lund-Charm model [39] for the remaining unknown decays.
In this analysis, a signal MC sample for the process J/ψ → ηY (2175), Y (2175) → φf0(980) and f0(980) →
π+π−, is generated to optimize the selection criteria and
determine the detection efficiency. Since the JP C of the
Y (2175) is 1−−, a P -wave orbital angular momentum is
used for the η − Y (2175) system, while S-wave is used for the φ − f0(980) and π+− π− systems. The shape of the
f0(980) is parameterized with the Flatt´e formula [40],
and the corresponding parameters are taken from the measurement of BESII [41]. For the signal MC sample of J/ψ → φη(1405)/f1(1285), the angular distributions are
also considered in the simulation.
III. EVENT SELECTION
To select candidate events of the process J/ψ → ηφπ+π− with φ → K+K− and η → γγ, the following
criteria are imposed on the data and MC samples. We select charged tracks in the MDC within the polar angle range | cos θ| < 0.93 and require that the points of closest approach to the beam line be within ±20 cm of the interaction point in the beam direction and within 2 cm in the plane perpendicular to the beam. The TOF and dE/dx information are combined to form particle identification (PID) confidence levels for the π, K, p hy-potheses, and each track is assigned to the particle type corresponding to the hypothesis with the highest confi-dence level. Two kaon and two pion particles with oppo-site charges are required.
Photon candidates are reconstructed by clustering sig-nals in EMC crystals. The energy deposited in nearby TOF counters is included to improve the photon recon-struction efficiency and the photon energy resolution. At least two photon candidates are selected, the minimum energy of which are required to be 25 MeV for barrel showers (| cos θ| < 0.80) and 50 MeV for endcap show-ers (0.86 < | cos θ| < 0.92). To exclude showshow-ers due to the bremsstrahlung of charged particles, the angle be-tween the nearest charged track and the shower must be greater than 10◦. EMC cluster timing requirements are
applied to suppress electronic noise and energy deposits unrelated to the event.
A four-constraint kinematic fit using energy-momentum conservation is performed to the J/ψ → K+K−π+π−γγ hypothesis. All
combina-tions of two photons are tried and the one with the smallest χ2
4C value is retained. To further suppress
background, χ2
4C< 200 is required.
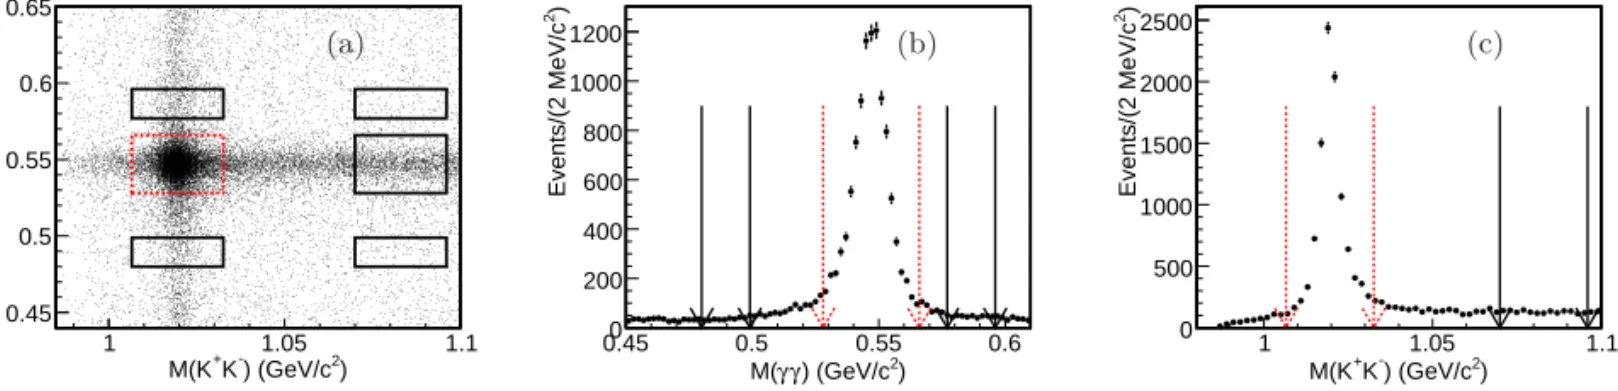
After the above selection process, a scatter plot of the invariant mass of the γγ system (M (γγ)) versus the in-variant mass of the K+K− system (M (K+K−)) in data
is shown in Fig.1(a), where the events concentrated in the region indicated by the dotted-line box correspond to the J/ψ → ηφπ+π− signal. The φ and η signal
re-gions are defined as |M (K+K−) − M
φ| < 0.013 GeV/c2
and |M (γγ) − Mη| < 0.019 GeV/c2, where Mφ and Mη
are world average values of the φ and η masses,
respec-tively. Fig.1(b) and (c) show the γγ and K+K−
invari-ant mass distributions for events with a K+K−invariant
mass within the φ signal region and a γγ invariant mass within the η signal region, respectively. Both η and φ signals are clearly seen with very low background levels.
IV. MEASUREMENT OF J/ψ → ηY (2175)
WITH Y (2175) → φf0(980) AND f0(980) → π+π−
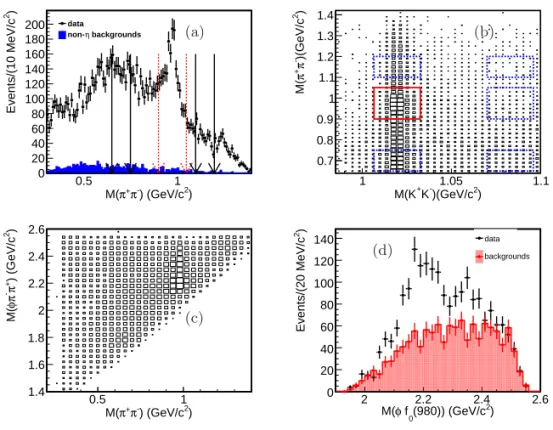
With the above requirements on the η and φ can-didate masses, the π+π− invariant mass distribution
is shown in Fig. 2(a). A clear f0(980) signal is
visi-ble. The non-φ and/or non-η backgrounds are estimated with the events in the η − φ sideband regions, shown as the shaded histogram in Fig. 2(a). The η sideband is defined by 0.480 GeV/c2 < M (γγ) < 0.499 GeV/c2
or 0.577 GeV/c2 < M (γγ) < 0.596 GeV/c2,
and the φ sideband is defined by 1.070 GeV/c2 <
M (K+K−) < 1.096 GeV/c2. Using a mass
require-ment of 0.90 GeV/c2 < M (π+π−) < 1.05 GeV/c2 to
select the f0(980) signal, the invariant mass distribution
of φf0(980) is shown in Fig.2(d), where a broad structure
around 2.2 GeV/c2 is evident. Figure2(c) shows a
two-dimensional histogram of M (φπ+π−) versus M (π+π−).
A cluster of events populating the Y (2175) and f0(980)
signal regions is observed, which corresponds to the decay of Y (2175) → φf0(980) with f0(980) → π+π−.
Since the contribution from non-η background events in the f0(980) mass region is small and can be neglected,
the two-dimensional φ-f0(980) sidebands are used to
es-timate the background events in this analysis. With the η mass requirement applied, the φ and/or non-f0(980) events are estimated by the weighted sums of
horizontal and vertical sidebands, with the entries in the diagonal side bands subtracted to compensate for the double counting of background components. The defi-nition of the two-dimensional side bands is illustrated in Fig. 2(b). The weighting factors for the events in the horizontal, vertical and the diagonal side bands are mea-sured to be 0, and 0.66, -0.085 respectively, which are determined from the results of a two-dimensional fit to the mass spectrum of M (K+K−) versus M (π+π−). No
signal of f0(980) is evident in non-φ processes as shown in
the scatter plot of M (π+π−) versus M (K+K−). Hence,
the weighting factor for the events in the horizontal side band is zero, and the non-φ events in the horizontal side band are not used in the background estimation. The two-dimensional Probability Density Functions (PDFs) for J/ψ → ηφf0(980), φ but non-f0(980), non-φ and
non-f0(980) processes are constructed by the product of
one-dimensional functions, where the resonant peaks are parameterized by Breit-Wigner functions (for φ) and a shape taken from simulation (for f0(980)), and the
non-resonant parts are described by polynomials with coeffi-cients left free in the fit. To account for the difference of the background shape between the signal region and side bands due to the varying phase space, the obtained
) 2 ) (GeV/c -K + M(K 1 1.05 1.1 ) 2 ) (GeV/c γγ M( 0.45 0.5 0.55 0.6 0.65 (a) ) 2 ) (GeV/c γ γ M( 0.45 0.5 0.55 0.6 ) 2 Events/(2 MeV/c 0 200 400 600 800 1000 1200 (b) ) 2 ) (GeV/c -K + M(K 1 1.05 1.1 ) 2 Events/(2 MeV/c 0 500 1000 1500 2000 2500 (c)
FIG. 1. (a) Scatter plot of M (γγ) versus M (K+K−). The boxes with the dotted and solid lines show the η and φ signal and sidebands regions, respectively. (b) The γγ invariant mass spectrum for events with the K+
K−invariant mass in the φ signal region. (c) The K+
K− invariant mass spectrum for events with the γγ invariant mass in the η signal region. In plots (b) and (c), the dotted arrows show the signal regions and the solid lines show the sideband regions, which are described in the text.
background mass distribution is multiplied by a correc-tion curve determined from an MC sample of 1 million events of the phase space processes J/ψ → ηφπ+π−. The
estimated K+K−π+π− invariant mass distribution for
the total non-φ or non-f0(980) components is shown by
the shaded histogram in Fig. 2(d). No evident Y (2175) signal is observed.
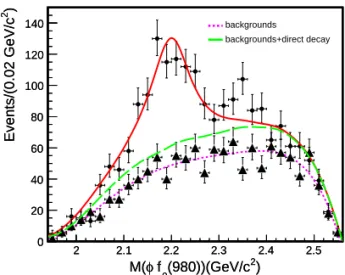
To extract the yield of Y (2175), an unbinned maxi-mum likelihood fit to the φf0(980) invariant mass is
per-formed. The Y (2175) signal, the direct three-body decay of J/ψ → ηφf0(980), and the background from the above
estimation shown as the shaded histogram in Fig. 2(b) are included in the fit. With the assumption of no inter-ference between the Y (2175) signal and the direct three-body decay of J/ψ → ηφf0(980), the probability density
function (PDF) can be written as ǫ(m) × (G ⊗ |A(m)|2) + A(J/ψ → ηφf 0) + BKG, (1) where A(m) = P l1 J →ηYP l2 Y →φf0 m2−M2
0+iM0Γ0 is a Breit-Wigner function
representing the Y (2175) signal shape, taking into ac-count the phase space factor of a two-body decay. M0
and Γ0 are left free in the fit. PJ→ηY and PY →φf0
de-note the momentum of the η in the rest frame of the J/ψ and that of the φ in the rest frame of the Y (2175), respectively. l1 and l2, which label the relative orbital
angular momenta of the η − Y (2175) and φ − f0(980)
systems, are set to be 1 and 0 in the fit, respectively. G is a Gaussian function representing the mass resolution, and the corresponding parameters are taken from MC simulation. ǫ(m), the detection efficiency as a function of the φf0(980) invariant mass, is also obtained from MC
simulation. A(J/ψ → ηφf0) represents the component
of the direct decay of J/ψ → ηφf0(980) with the shape
derived from the phase space MC sample. Finally, BKG refers to the background component estimated from the two-dimensional weighted sideband method.
Figure 3 shows the results of the fit, where the cir-cular dots with error bars show the distribution for the signal and the triangular dots with error bars are for
the backgrounds estimated by the sidebands. The solid curve is the overall fit projection, the dotted curve the fit for the backgrounds, and the dashed curve for the sum of the direct decay of J/ψ → ηφf0 and backgrounds.
The mass and width of the Y (2175) are determined to be M = 2200 ± 6 MeV/c2 and Γ = 104 ± 15 MeV,
re-spectively. The fit yields 471 ± 54 Y (2175) events with a statistical significance of greater than 10σ, which is deter-mined by the change of the log-likelihood value and the number of degree of freedom in the fit with and without the Y (2175) signal. Taking into account the detection efficiency, (9.10 ± 0.01)%, obtained from MC simulation, the product branching fraction is
B(J/ψ → ηY (2175), Y (2175) → φf0(980),
f0(980) → π+π−) = (1.20 ± 0.14) × 10−4.
We also perform a fit to the φf0(980) invariant mass,
allowing interference between the Y (2175) and the di-rect decay J/ψ → ηφf0(980). An ambiguity in the phase
angle occurs when a resonance interferes with a vary-ing continuum [42]. Thus, two solutions with different relative phase angles, corresponding to constructive and destructive interferences, are found. The final fit and the individual contributions of each of the components are shown in Fig.4(a), (b) for constructive and destructive interference, respectively. The mass, width, and yields of the Y (2175) signal, as well as the relative phase angle, are shown in TableI. The statistical significance of the interference is 2.5σ, which is determined from the differ-ences of the likelihood values and the degrees of freedom between the fits with and without interference. In this analysis, the fit results without considering interference are taken as the nominal values.
V. MEASUREMENT OF J/ψ → φf1(1285) AND
φη(1405)
The ηπ+π− mass spectrum recoiling against the φ is
) 2 ) (GeV/c -π + π M( 0.5 1 ) 2 Events/(10 MeV/c 0 20 40 60 80 100 120 140 160 180 200 data backgrounds η non- (a) ) 2 )(GeV/c -K + M(K 1 1.05 1.1 ) 2 )(GeV/c -π + π M( 0.7 0.8 0.9 1 1.1 1.2 1.3 1.4 (b) ) 2 ) (GeV/c -π + π M( 0.5 1 ) 2 ) (GeV/c + π -πφ M( 1.4 1.6 1.8 2 2.2 2.4 2.6 (c) ) 2 (980)) (GeV/c 0 f φ M( 2 2.2 2.4 2.6 ) 2 Events/(20 MeV/c 0 20 40 60 80 100 120 140 data backgrounds (d)
FIG. 2. (a) The π+
π− invariant mass spectrum. The shaded histogram shows the non-η background estimated with η sideband region; the dotted and solid arrows denote the f0(980) signal and sideband regions, respectively. (b) The scatter plot of M (π+
π−) versus M (K+K−). The solid box shows the signal region, and the dotted boxes show the sideband regions of φ and f0. (c) The scatter plot of M (φπ+
π−) versus M (π+π−). (d) The φπ+π− invariant mass distribution after imposing the f0(980) signal mass window requirement. The shaded histogram shows the background distribution estimated with the sideband method described in the text.
TABLE I. Two solutions of the fit to M (φf0(980)), taking interference with the direct decay ηφf0 into account. Errors are statistical only.
Parameters Constructive Destructive M (MeV/c2) 2171 ± 10 2170 ± 9
Γ (MeV) 128 ± 26 126 ± 25
Signal yields 400 ± 167 744 ± 40 relative angle Φ(rad) −0.51 ± 0.78 0.60 ± 0.64
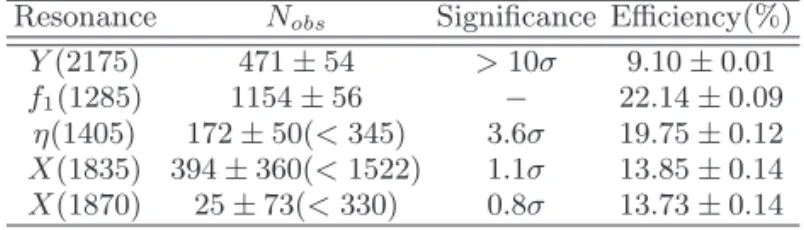
f1(1285) signal, a small structure around 1.4 GeV/c2,
which is assumed to be the η(1405), is evident over a large non-resonant background. A fit to the ηπ+π−
in-variant mass is performed with a PDF that includes con-tributions from the f1(1285) and η(1405) signals, the
decay J/ψ → ηφπ+π− (including the process J/ψ →
ηφf0(980)), and backgrounds from non-η and non-φ
pro-cesses. In the fit, the f1(1285) and η(1405) signal shapes
are described by Breit-Wigner functions convoluted with Gaussian functions for their mass resolutions. The mass and width of the f1(1285) signal are left free in the fit,
while those of the η(1405) signal are fixed to the values in the PDG [1]. The parameters of the Gaussian functions for the mass resolutions are fixed to their MC values. The shape of the J/ψ → ηφπ+π− decay is represented
by a third-order Chebychev polynomial function, and the corresponding parameters are allowed to vary. The
non-η and non-φ background is estimated with the events in the η-φ sideband regions, as shown by the dashed lines in Fig.5, and is fixed in the fit.
The fit, shown in Fig. 5, yields 1154 ± 56 f1(1285)
signal events, with a mass of 1281.7 ± 0.6 MeV/c2 and
a width of 21.0 ± 1.7 MeV. The mass and width are in good agreement with world average values [1]. Using a detection efficiency of (22.14±0.09)%, obtained from MC simulation, the product branching fraction is measured to be:
B(J/ψ → φf1(1285),
f1(1285) → ηπ+π−) = (1.20 ± 0.06) × 10−4,
where the error is statistical only.
For the η(1405) signal, the fit yields 172 ± 50 events with a statistical significance of 3.6σ, evaluated from the difference of the likelihood values between the fits with and without the η(1405) included. The product branching fraction is B(J/ψ → φη(1405), η(1405) → ηπ+π−)=(2.01 ± 0.58) × 10−5, where the error is
statis-tical only. To determine the upper limit on the η(1405) production rate, a series of similar fits with given num-bers of η(1405) events are performed, and the likelihood values of the fits as a function of the number of η(1405) events are taken as a normalized probability function. The upper limit on the number of signal events at the 90% C.L., NU.L., is defined as the value that contains
) 2 (980))(GeV/c 0 f φ M( 2 2.1 2.2 2.3 2.4 2.5 ) 2 Events/(0.02 GeV/c 0 20 40 60 80 100 120 140 ) 2 (980))(GeV/c 0 f φ M( 2 2.1 2.2 2.3 2.4 2.5 ) 2 Events/(0.02 GeV/c 0 20 40 60 80 100 120 140 backgrounds backgrounds+direct decay
FIG. 3. Result of the fit to the φf0(980) invariant mass dis-tribution described in the text. The circular dots with error bars show the distribution in the signal region; the triangular dots with error bars show the backgrounds estimated using sideband regions; the solid curve shows the overall fit pro-jection; the dotted curve shows the fit for the backgrounds; and the dashed curve is for the sum of the direct decay of J/ψ → ηφf0 and backgrounds. ) 2 (980)) (GeV/c 0 f φ M( 2 2.1 2.2 2.3 2.4 2.5 ) 2 Events/(0.02 GeV/c -50 0 50 100 150 ) 2 (980)) (GeV/c 0 f φ M( 2 2.1 2.2 2.3 2.4 2.5 ) 2 Events/(0.02 GeV/c -50 0 50 100 150 Y(2175) the direct decay interference
Y(2175)+the direct decay+interference backgrounds global fit (a) ) 2 (980)) (GeV/c 0 f φ M( 2 2.1 2.2 2.3 2.4 2.5 ) 2 Events/(0.02 GeV/c -50 0 50 100 150 ) 2 (980)) (GeV/c 0 f φ M( 2 2.1 2.2 2.3 2.4 2.5 ) 2 Events/(0.02 GeV/c -50 0 50 100 150 (b)
FIG. 4. The fit projections to the φf0(980) invariant mass distribution showing the (a) constructive and (b) destructive solutions. The short-dashed line denotes the signal distribu-tion; the dot-dashed curve shows the fit to the backgrounds estimated by the sidebands; the long-dashed line denotes the direct decay of J/ψ → ηφf0; and the dotted line denotes the interference component.
90% of the integral of the normalized probability func-tion. The fit-related uncertainties on NU.L.are estimated by using different sideband regions for the effect of the non-η and non-φ background, different orders of Cheby-chev polynomials for the shape of the J/ψ → ηφπ+π−
and changing the mass and width values of the η(1405) within one standard deviation from the central values for the signal shape. Finally, after taking into account fit-related uncertainties, we obtain NU.L.= 345. This upper
limit and the detection efficiency of (19.75 ± 0.12)%, es-timated from MC simulation, are used to evaluate the
) 2 )(GeV/c + π -π η M( 1.1 1.2 1.3 1.4 1.5 1.6 1.7 1.8 1.9 2 ) 2 Events/(0.01 GeV/c 0 50 100 150 200 250 300 350 400 ) 2 )(GeV/c + π -π η M( 1.1 1.2 1.3 1.4 1.5 1.6 1.7 1.8 1.9 2 ) 2 Events/(0.01 GeV/c 0 50 100 150 200 250 300 350 400 -π + π φ η backgrounds φ / η non-histograms: X(1835) histograms: X(1870)
FIG. 5. Fit to the ηπ+
π− invariant mass spectrum. The solid lines show the total fit and the f1(1285) and η(1405) components; the dashed line denotes the non-η and non-φ background estimated using the η-φ sidebands; the dotted curve represents the J/ψ → ηφπ+
π− component; the solid histogram indicates the shape of the X(1835) (with arbitrary normalization); and the dash-dotted histogram shows the pre-dicted shape of the X(1870) signal (with arbitrary normaliza-tion).
upper limit on the branching fraction:
B(J/ψ → φη(1405), η(1405) → ηπ+π−)) < N U.L. ǫ × NJ/ψ× B(η → γγ) × B(φ → K+K−) × (1 − σsys) = 4.45 × 10⁻⁵, (2)
where σsys is the systematic error to be discussed in
de-tail below. Since the background uncertainty is taken into account in the calculation of NU.L. by choosing the
maximum event yield from the variations of the back-ground functions, the systematic uncertainty from this source is excluded here. The final results on the upper limit of the branching fraction are shown in TableIII.
In the ηπ+π− mass spectrum shown in Fig. 5, we do
not observe obvious structures around 1.84 GeV/c2 or
at 1.87 GeV/c2. Using the same approach as was used
for the η(1405), we set 90% C.L. upper limits for the X(1835) and X(1870) production rates, where the signal shape of the X(1835) or X(1870) is described by a Breit-Wigner function convoluted with a Gaussian function for the mass resolution, and the background is modeled by a third-order Chebychev polynomial. The resonant param-eters of the X(1835) and X(1870) are fixed to the values of previous BESIII measurements [22, 23]. The results are summarized in TableIIand TableIII.
TABLE II. Measurements of the number of events, statistical significances, and efficiencies.
Resonance Nobs Significance Efficiency(%)
Y (2175) 471 ± 54 > 10σ 9.10 ± 0.01
f1(1285) 1154 ± 56 − 22.14 ± 0.09
η(1405) 172 ± 50(< 345) 3.6σ 19.75 ± 0.12 X(1835) 394 ± 360(< 1522) 1.1σ 13.85 ± 0.14 X(1870) 25 ± 73(< 330) 0.8σ 13.73 ± 0.14
VI. SYSTEMATIC ERRORS
The sources of systematic error include: the efficiency difference between data and MC simulation for the track reconstruction, the PID, the photon detection, and the kinematic fit; the fitting procedure; the ambiguity in the interference; and the number of J/ψ events. Their effects on the measurement of the resonance parameters and the branching fractions are discussed in detail below.
a. MDC Tracking efficiency The tracking efficiency has been investigated using the almost background-free control samples of J/ψ → π+π−pp and J/ψ → K0
SKπ
[43]. The difference in tracking efficiency between data and MC is found to be 2% per charged kaon and pion. Therefore, 8% is taken as the total systematic error for the detection efficiency of four charged tracks.
b. PID efficiency To evaluate the PID efficiency un-certainty, we have studied the kaon and pion PID ef-ficiencies using the control samples of J/ψ → K∗±K∓
and J/ψ → ρπ [43], respectively. The difference in PID efficiency between data and MC is 1% per kaon and pion. Hence, 4% is taken as the total systematic error from the PID efficiency.
c. Photon detection efficiency The photon detec-tion efficiency has been studied using a control sample of J/ψ → ρπ [43]. The difference between data and MC is found to be 1% per photon. Therefore, 2% is taken as the total systematic error for the efficiency of the detection of the two photons.
d. Kinematic fit To estimate the uncertainty as-sociated with the kinematic fit, a control sample of J/ψ → φη′(η′ → ηπ+π−), which has exactly the same
final state as the signal, is first selected without a kine-matic fit. The kinekine-matic fit efficiency is then evaluated from the ratio of the η′ yields with and without the
kine-matic fit requirement, where the η′yield is extracted from
the fit to the η′ signal in the ηπ+π−invariant mass. The
difference of the kinematic fit efficiency between data and MC, 0.4%, is taken as the systematic error for the kine-matic fit.
e. Uncertainties of B(η → γγ) and B(φ → K+K−) The branching fractions of η → γγ and
φ → K+K− are taken from the PDG [1]. The
uncer-tainties of these branching fractions, 0.5% and 1.0%, are taken as the systematic errors.
f. Uncertainty of the number ofJ/ψ events The total number of J/ψ events is determined from an analysis
of inclusive J/ψ hadronic decays, and the uncertainty of the number of J/ψ events, 1.2% [44], is taken as the systematic error from the number of J/ψ events.
g. Background uncertainty In the measurement of the resonance parameters and branching fractions of the Y (2175), a fit is performed to the φf0(980) invariant mass
spectrum. In the fit, the shape and amplitude of the background from the non-φ and non-f0(980) are fixed to
the estimation from the φ − f0(980) sideband regions.
To estimate its impact on the final results, we use differ-ent φ − f0(980) sideband regions to estimate the
back-ground, and follow the same fit procedure. The maxi-mum changes on both the Y (2175) resonance parameters and its signal yield are taken as the systematic errors. The uncertainty due to the background on the mass and width of the Y (2175) are ±4.0 MeV/c2 and ±14.0 MeV,
respectively.
For the branching fraction of J/ψ → φf1(1285)/η(1405) with f1(1285)/η(1405) → ηπ+π−,
the non-η and non-φ backgrounds are estimated with the events in the η − φ sideband regions. Analogous to the evaluation of the Y (2175) errors, we define different sideband regions to estimate the backgrounds and follow the same fit procedure. The largest changes are taken as the uncertainty from the background for these measurements. Compared to the number of f1(1285)
events, the fluctuation of background shape under the η(1405) peak has a large impact on the signal yields in the fit due to the limited statistics.
h. Impact from possible extra resonances In the invariant mass spectrum of φf0(980), a small structure
around 2.35 GeV/c2 is found (Fig. 3). To evaluate its
impact on the Y (2175) measurement, we perform a fit with an additional signal around 2.35 GeV/c2, which is
described with a Breit-Wigner function convoluted with a Gaussian function for the mass resolution. The fit re-sults show that the significance of the structure around 2.35 GeV/c2 is only 3.8σ. It is therefore not considered
in the nominal final results. However, the impact on the Y (2175) measurement is taken as the systematic error. The uncertainty due to the possible extra resonance on the mass and width of the Y (2175) are ±3.0 MeV/c2and
±5.0 MeV, respectively.
In the measurement of the branching fraction of J/ψ → φf1(1285) with f1(1285) → ηπ+π−, we perform a fit
without the η(1405) signal. The difference of results with or without the η(1405) signal included in the fit is taken as the systematic error on the f1(1285)
measure-ment from the impact of the η(1405).
i. Parameterization of thef0(980) The systematic
er-ror from the f0(980) shape is estimated by comparing the
detection efficiencies from the signal MC samples simu-lated with different parameterizations of the f0(980). We
use the resonant parameters of the f0(980) from Ref. [45],
instead of the nominal values from the measurements of BESII [41] mentioned in Section II, to describe the f0(980) shape. This leads to a difference in the detection
uncer-TABLE III. Measurements of the branching fractions for the decay modes. Upper limits are given at the 90% C.L.
Decay mode Branching fraction B
J/ψ → ηY (2175), Y (2175) → φf0(980), f0(980) → π+ π− (1.20 ± 0.14 ± 0.37) × 10−4 J/ψ → φf1(1285), f1(1285) → ηπ+π− (1.20 ± 0.06 ± 0.14) × 10−4 J/ψ → φη(1405), η(1405) → ηπ+ π− (2.01 ± 0.58 ± 0.82)(< 4.45) × 10−5 J/ψ → φX(1835), X(1835) → ηπ+ π− < 2.80 × 10⁻⁴ J/ψ → φX(1870), X(1870) → ηπ+ π− < 6.13 × 10⁻⁵
tainty on the Y (2175) branching fraction measurement from the f0(980) parameterization.
j. Uncertainty from fixed mass and width values on the branching ratio of J/ψ → φη(1405) with η(1405) → ηπ+π− The mass and width of the η(1405) are fixed
to their PDG values in the fit to the η(1405) signal. We change the mass and width values by one standard devi-ation from their central values in the fitting procedure. The maximum change on the branching fraction is deter-mined to be 7.0% when the mass and width values are fixed at one negative standard deviation from the central values.
k. Uncertainty from parameter sets in the generation of J/ψ → φf1(1285) The parameters used in the
gen-eration of the signal MC sample of J/ψ → φf1(1285) are
taken from the angular distribution of the φ in the rest frame of the J/ψ found in real data. The impact of the uncertainty of these parameters on the efficiency, 3.2%, is taken as a source of systematic error on the branching fraction.
In TableIV, a summary of all contributions to the sys-tematic errors on the branching fraction measurements is shown. In each case, the total systematic uncertainty is obtained by adding the individual contributions in quadrature. For the uncertainties on the Y (2175) res-onant parameters, we find that the dominant systematic uncertainties are from the background shape and a pos-sible additional resonance around 2.35 GeV/c2. Adding
the various systematic uncertainties in quadrature, the total systematic errors on the mass and width of the Y (2175) are ±5.0 MeV/c2 and ±14.8 MeV, respectively.
VII. SUMMARY
In summary, we present an analysis of J/ψ → ηφπ+π−
based on (225.3±2.8)×106J/ψ events collected with the
BESIII detector. The Y (2175) resonance is observed in the invariant mass spectrum of φf0(980) with a statistical
significance of greater than 10σ. The mass and width of the Y (2175) are measured and are in good agreement with previous experimental results (TableV). Neglecting the effects of interference with the direct decay J/ψ → ηφf0(980), the product branching fraction is measured to
be B(J/ψ → ηY (2175), Y (2175) → φf0(980), f0(980) →
π+π−) = (1.20 ± 0.14 ± 0.37) × 10−4. We also perform
a fit taking the interference between the Y (2175) and the direct decay. The corresponding results are shown in
TableI.
In addition, we investigate the ηπ+π− mass spectrum
recoiling against the φ in the J/ψ decay. A structure around 1.28 GeV/c2is clearly seen, and the fit results are
in good agreement with the world average values of the f1(1285) parameters. The product branching fraction of
J/ψ → φf1(1285) with f1(1285) → ηπ+π− is measured
to be B(J/ψ → φf1(1285) → φηπ+π−) = (1.20 ± 0.06 ±
0.14)×10−4. A structure around 1.4 GeV/c2seems to be
present in the ηπ+π− mass spectrum. Assuming it to be
the η(1405), the product branching fraction is calculated to be B(J/ψ → φη(1405) → φηπ+π−) = (2.01 ± 0.58 ±
0.82) × 10−5. We also present a 90% C.L. upper limit
on the branching fraction B(J/ψ → φη(1405),η(1405) → ηπ+π−) < 4.45 × 10⁻⁵. In a previous experiment, the
η(1405)/η(1440) is observed in both ηππ and KKπ in-variant mass spectra recoiling against the γ and ω in J/ψ decays. However, no significant structure around 1.4 GeV/c2is observed in the π+π−η mass spectrum
re-coiling against the φ in this analysis, which may imply that u and d quarks account for more of the quark con-tent in the η(1405) than the s quark. We also perform searches for the X(1835) and X(1870) in the vicinity of 1.8 GeV/c2 in the ηπ+π− mass spectrum, and observe
no evident structures. The corresponding upper limits at 90% C.L. of branching fraction are measured. All of these measurements provide information in understand-ing the nature of the X(1835) and X(1870).
ACKNOWLEDGEMENTS
The BESIII collaboration thanks the staff of BEPCII and the IHEP computing center for their strong sup-port. This work is supported in part by National Key Basic Research Program of China under Con-tract No. 2015CB856700; Joint Funds of the National Natural Science Foundation of China under Contracts Nos. 11079008, 11179007, U1232201, U1332201; National Natural Science Foundation of China (NSFC) under Con-tracts Nos. 10935007, 11121092, 11125525, 11235011, 11322544, 11335008, 11175189; the Chinese Academy of Sciences (CAS) Large-Scale Scientific Facility Program; CAS under Contracts Nos. YW-N29, KJCX2-YW-N45; 100 Talents Program of CAS; INPAC and Shanghai Key Laboratory for Particle Physics and Cos-mology; German Research Foundation DFG under Con-tract No. Collaborative Research Center CRC-1044;
Is-TABLE IV. Summary of systematic errors (in %) for the branching fraction measurements. The fourth column shows the sources of systematic errors on the branching fraction of J/ψ → φη(1405) with η(1405) → ηπ+
π−, while the fifth column shows those on the upper limits of the branching fractions of J/ψ → φη(1405), φX(1835), φX(1870) with η(1405)/X(1835)/X(1870) → ηπ+π−.
Sources Y (2175) f1(1285) η(1405) η(1405)/X(1835)/X(1870) MDC tracking 8.0 Photon detection 2.0 PID 4.0 Kinematic fit 0.4 B(η → γγ) 0.5 B(φ → K+ K−) 1.0 Number of J/ψ events 1.2 f0(980) selection 7.6 − − − Background uncertainty 19.1 4.1 39.3 − The fixed M/Γ of η(1405) − − 7.0 − Parameters of φf1(1285) generation − 3.2 − − Extra resonance 21.4 4.0 − − Total 31.1 11.4 41.0 9.4
TABLE V. Comparison of Y (2175) parameters as measured by different experiments.
Collaboration Process M (MeV/c2
) Γ (MeV) BABAR [2] e+e−→φf0 (ISR) 2175 ± 10 ± 15 58 ± 16 ± 20 BESII [3] J/ψ → ηφf0(980) 2186 ± 10 ± 6 65 ± 23 ± 17 BELLE [4] e+e−→φf0 (ISR) 2079 ± 13+79 −28 192 ± 23 +25 −61 BABAR(updated) [5] e+ e−→φf0 (ISR) 2172 ± 10 ± 8 96 ± 19 ± 12 BESIII J/ψ → ηφf0(980) 2200 ± 6 ± 5 104 ± 15 ± 15
tituto Nazionale di Fisica Nucleare, Italy; Ministry of Development of Turkey under Contract No. DPT2006K-120470; Russian Foundation for Basic Research under Contract No. 14-07-91152; U.S. Department of Energy under Contracts Nos. 04ER41291,
DE-FG02-05ER41374, DE-FG02-94ER40823, DESC0010118; U.S. National Science Foundation; University of Groningen (RuG) and the Helmholtzzentrum fuer Schwerionen-forschung GmbH (GSI), Darmstadt; WCU Program of National Research Foundation of Korea under Contract No. R32-2008-000-10155-0.
[1] K. A. Olive et al. [Particle Data Group], Chin. Phys. C 38, 090001 (2014).
[2] B. Aubert et al. [BABAR Collaboration], Phys. Rev. D 74, 091103(R) (2006).
[3] M. Ablikim et al. [BES Collaboration], Phys. Rev. Lett. 100, 102003 (2008).
[4] C. P. Shen et al. [BELLE Collaboration], Phys. Rev. D 80, 031101(R) (2009).
[5] B. Aubert et al. [BABAR Collaboration], Phys. Rev. D 86, 012008 (2012).
[6] B. Aubert et al. [BABAR Collaboration], Phys. Rev. Lett. 95, 142001 (2005).
[7] C. Z. Yuan et al. [BELLE Collaboration], Phys. Rev. Lett. 99, 182004 (2007).
[8] G. J. Ding and M. L. Yan, Phys. Lett. B 650, 390 (2007). [9] G. J. Ding and M. L. Yan, Phys. Lett. B 657, 49 (2007). [10] Z. G. Wang, Nucl. Phys. A 791, 106 (2007).
[11] E. Klempt and A. Zaitsev, Phys. Rept. 454, 1 (2007). [12] C. F. Qiao, Phys. Lett. B 639, 263 (2006).
[13] A. Martinez Torres, K. P. Khemchandani, L. S. Geng, M. Napsuciale and E. Oset, Phys. Rev. D 78, 074031 (2008).
[14] S. L. Zhu, Int. J. Mod. Phys. E 17, 283 (2008).
[15] T. Barnes, N. Black and P. R. Page, Phys. Rev. D 68, 054014 (2003).
[16] W. M. Yao et al., J. Phys. G 33, 1 (2006).
[17] J. J. Manak et al., Phys. Rev. D 62, 012003 (2000). [18] D. L. Scharre et al., Phys. Lett. B 97, 329 (1980). [19] H. J. Behrend et al. [CELLO Collaboration], Z. Phys. C
42, 367 (1989).
[20] I. Vodopianov et al. [L3 Collaboration], Acta Phys. Pol. B 31, 2453 (2000).
[21] M. Ablikim et al. [BES Collaboration], Phys. Rev. Lett. 95, 262001 (2005).
[22] M. Ablikim et al. [BESIII Collaboration], Phys. Rev. Lett. 106, 072002 (2011).
[23] M. Ablikim et al. [BESIII Collaboration], Phys. Rev. Lett. 107, 182001 (2011).
[24] C. S. Gao and S. L. Zhu, Commun. Theor. Phys. 42, 844 (2004).
[25] G. J. Ding and M. L. Yan, Phys. Rev. C 72, 015208 (2005).
[26] G. Hao, C. F. Qiao and A. L. Zhang, Phys. Lett. B 642, 53 (2006).
[28] N. Kochelev and D. P. Min, Phys. Lett. B 633, 283 (2006).
[29] B. Kerbikov, A. Stavinsky and V. Fedotov, Phys. Rev. C 69, 055205 (2004).
[30] D. V. Bugg, Phys. Lett. B 598, 8 (2004).
[31] B. S. Zou and H. C. Chiang, Phys. Rev. D 69, 034004 (2004).
[32] M. Ablikim et al. [BESIII Collaboration], Nucl. Instrum. Meth. A 614, 345 (2010).
[33] Z. Y. Deng et al., HEP&NP. 30, 371 (2006).
[34] S. Jadach, B. F. L. Ward and Z. Was, Comp. Phys. Commu. 130, 260 (2000).
[35] S. Jadach, B. F. L. Ward and Z. Was, Phys. Rev. D 63, 113009 (2001).
[36] K. T. Chao et al., Modern Physics A 24, No.1 supp. (2009).
[37] R. G. Ping, Chin. Phys. C 32, 599 (2008).
[38] D. J. Lange, Nucl. Instrum. Meth. A 462, 152 (2001). [39] J. C. Chen et al., Phys. Rev. D 62, 034003 (2000). [40] S. M. Flatt´e, Phys. Lett. B 63, 224 (1976).
[41] M. Ablikim et al. [BES Collaboration], Phys. Lett. B 607, 243 (2005).
[42] A. D. Bukin, arXiv:0710.5627.
[43] M. Ablikim et al. [BESIII Collaboration], Phys. Rev. D 83, 112005 (2011).
[44] M. Ablikim et al. [BESIII Collaboration], Chin. Phys. C 36 (10), 915 (2012).