ESTIMATING BODY WEIGHT FROM SEVERAL BODY MEASUREMENTS IN HARNAI
SHEEP WITHOUT MULTICOLLINEARITY PROBLEM
M. A. Khan, M. M. Tariq, E. Eyduran*, A. Tatliyer**, M. Rafeeq, F. Abbas, N. Rashid, M. A. Awan and K. Javed***
*Center for Advanced studies in Vaccinology and Biotechnology (CASVAB), University of Balochistan, Quetta, Pakistan
*Biometry Genetics Unit, Department of Animal Science, Faculty of Agriculture, Iğdır University, 76000, Iğdır-Turkiye **Biometry Genetics Unit, Department of Animal Science, Faculty of Agriculture, Süleyman Demirel University, 32000,
Isparta-Turkiye
***Department of Livestock Production,University of Veterinary and Animal Sciences, Lahore, Pakistan Corresponding Auther: [email protected]
ABSTRACT
The aim of this study was to estimate body weight from several linear body characteristics collected from 730 Harnai sheep, in Pakistan. For this aim, morphological characteristics viz. body length (BL), withers height (WH), chest girth (CG), paunch girth (PG), face length (FL), length between ears (LBE), length of ears (EARL), width (FTW) and length (FTL) of tail to be useful for breeding purposes were measured. With removing multicollinearity problem, the complex relationship between BW and the measured characteristics was assessed by using scores derived from factor and principal component analyses in multiple regression analysis (MLRA) for male and female sheep. Body weight from morphological characteristics was predicted by Regression tree method. R2(%), adjusted R2(%), and RMSE values for weight prediction were estimated very high for MLRA (90.6, 90.3, and 4.635 for male sheep, and 92.4, 92.3, and 4.102 for female sheep), whereas use of factor scores in MLRA (87.8, 87.6, 0.352 for male sheep and 92.0, 91.9, and 0.284 for female sheep), and principal component scores (85.9, 85.8, and 0.367 for male sheep and 88.8, 88.7, and 0.335 for female sheep) in MLRA exactly removed multicollinearity problem. Regression tree method explained 84.4 % of total variation in BW. Consequently, use of factor and principal component scores in MLRA gave breeders a good chance without multicollinearity problem for a more accurate estimation of body weight in Harnai sheep compared to the results of MLRA. The results might present valuable knowledge for genetically improving body weight of Harnai sheep. Key words: Body weight, Factor Analysis, Harnai Sheep, Multicollinearity, Principal Component Analysis, Regression
Tree.
INTRODUCTION
The body weight (BW) prediction is necessary for deciding suitable medicinal dose, feed amount, and marketing for an animal (Birteeb and Ozoje, 2012; Eyduran et al., 2013). The prediction of BW and its relationships with other morphological measurements produce appreciable knowledge for breeding investigation with regard to meat production per animal (Janssens and Vandepitte, 2004; Yilmaz et al., 2013;Iqbal
et al., 2013). A good description of indigenous sheep
breeds on their own breed characteristics is required for conservation of their gene sources and the obtainment of their elite flocks for breeding aims (Riva et al., 2004; Yilmaz et al., 2013).
A lot of work has been conducted to describe the variation in BW from morphological traits in sheep, with multiple linear regression, non-linear function, and ridge regression analyses. In this context, breeders have to make a good decision and interpretation on the best method defining the relationship between BW and other morphological traits (Tariq et al., 2012b). Therefore, BW affected by genotype, gender, birth type, dam age at
lambing, and managerial applications (Yilmaz et al., 2013), has been regressed on the most preferred body measurements in the literature (Tariq et al., 2012a). In recent years, use of factor or principle component scores in MLRA has given much more successful results on eliminating a severe multicollinearity problem than MLRA and ridge regression analyses (Tariq et al., 2012b). Use of factor scores for breeding studies was reported in Yilmaz et al. (2011). Additionally, more detailed knowledge has also been obtained on BW prediction with the use of regression tree method yielding more advantageous results in few reports published earlier (Eyduran et al., 2008; Tariq et al., 2012a).
Multicollinearity problem, unfavorably influencing interpretation of regression equations on BW prediction, was not scrutinized for earlier prediction equations. Up to now, the BW prediction from some morphological traits has not been reported in indigenous Harnai sheep by using regression tree method, factor scores and principle component scores in MLRA. Without the multicollinearity problem, this investigation was conducted to predict BW from morphological traits in the indigenous sheep by applying regression tree
method, factor and principle component scores in MLRA, respectively.
MATERIALS AND METHODS
This study was carried out in the Harnai breed rearing area in four districts of Balochistan (Quetta, Pishin, Ziarat and Loralai), and data were collected from (n=7) randomly selected villages of each district. The information on (n= 245) males and (n= 485) female animals of different ages and weight (at birth, 6 to 9 mo, 2 teeth, 4 teeth, 6 teeth, and 8 teeth) and different morphological characteristics i.e. body length, body height, chest girth, paunch girth, face length, length between ears, length of ears, width and length of tail were measured using spring balance and standard measuring tape (Tariq et al., 2011).
The owners were also inquired about the feeding, management, vaccination and other breeding practices, natural mating is the common practice for breeding in the survey area , the major breeding season is autumn (October and November) and lambing season is Spring (February and March) but breeding is also practiced during summer in those animals which were failed to conceive during autumn.
Sheep were maintained under the semi-intensive system of management. Animals are released during the day to forage for feed and housed overnight. It was also observed during the study that there is no permanent pastures for sheep grazing. However, farmers use the range land and apple orchards when the fruits are cut down and the animals are allowed for grazing.
Statistical Analysis: The basic factor analysis equation can be written in matrix form:
Z
F
Where
Z
is a px1 vector of variables,T
Y
a X
is a pxm matrix of factor loadings, F is anmx1 vector of factors and
is a px1 vector of error factors (Sharma, 1996). Owing to the differences in the units of regressors for factor analysis, the regressors were standardized and eigen values were calculated by a correlation matrix of variables. VARIMAX rotation was used for facilitating interpretation of factor loadings (Yilmaz et al., 2011). Factor coefficients were used to get factor scores for the selected factors in the factor analysis. Factors with eigen values greater than 1 were considered as new regressors in multiple regression analysis. Score values in relation to the extracted factors were used as new regressors. The multiple linear regression equation for fitting standardized body weight and the factor scores equation are expressed below:BW= a+ b1FS1+ b2FS2+ b3FS3+ b4FS4+e
Where
a
, intercept (with a value of zero); b1, b2 ,b3and b4are regression coefficients of Factor Scores. FSis the factor score and e is the error (residual) term. The significance control for each of regression coefficients (intercept and slopes) was performed using a t-statistic.
The basic equation of PCA is, in matrix notation, given by following equation:
'
Y
W X
These equations are also written as:
1 1 2 2
...
kj k j k j pk pj
Y
w X
w X
w X
Where
S
ykj is the standardized score value of the jth observation in the kth PCs; j is the number of observation, k is the number of the selected PC number (1, 2), p is the number of regressors (k = 1, 2, 3, 4, 5, 6, 7, 8, and 9)w
pk k is the standardized weight of the pth variable andZ
pj is thestandardized value of the jth observation.
Z
pj is calculated as: p xX
X
Z
S
Where
X
p is the original value of the pth variable and is the mean of that variable andS
x is thestandard deviation of the variable. Then, multiple linear regression analysis was used to study the relationship between BW and principal component scores from PCA as follows:
BW= a+b1PC1+ b2PC2+e
Where;
a
intercept (with a value of zero), b1 and b2are regression coefficients of the first and second principal component scores, and e is error term. See Mendes (2009) for more information.The appropriateness of the multiple regression analysis was decided by the coefficient of determination (R2) and Root of Mean Square Error (RMSE) (Eyduran et
al., 2009; Sakar et al., 2011). Variance Inflation Factor
(VIF) is one of the diagnostics giving information on multicollinearity level and its upper limit is 10 in a MLRA (Karakus et al., 2010).
BW prediction from other morphological characteristics of 757 Harnai sheep was performed using Exhaustive CHAID with F- test as suggested by Eyduran et al. (2008).
Statistical analyses were performed using MINITAB and SPSS programs.
RESULTS
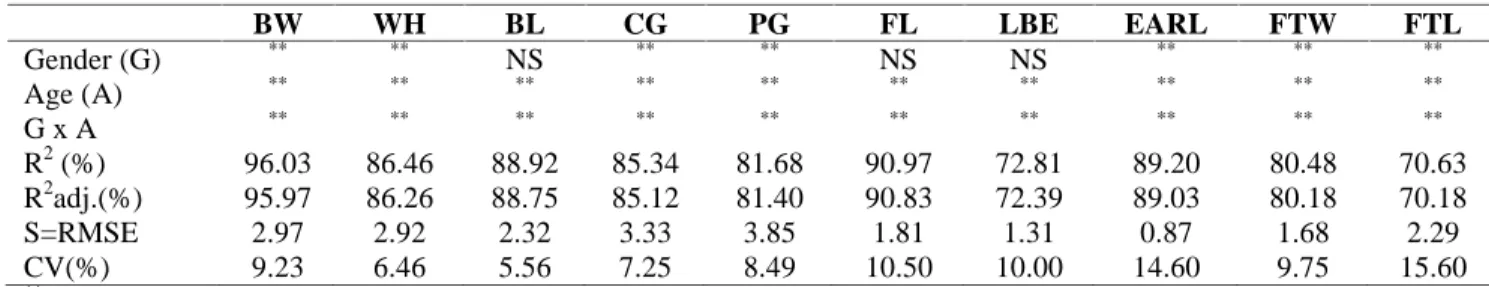
Factorial ANOVA results given in Table 1 showed wide variation in BW, WH, BL, CG, PG, FL, LBE, EARL, FTW, and FTL characteristics on the basis of their coefficient of determination (70.63 to 96.03 %) and adjusted determination coefficients (70.18 to 95.97
%). The effect of age x gender interaction was significant for each characteristic (Table 1). Table 1. ANOVA results of morphological characteristics in Harnai Sheep
BW WH BL CG PG FL LBE EARL FTW FTL Gender (G) ** ** NS ** ** NS NS ** ** ** Age (A) ** ** ** ** ** ** ** ** ** ** G x A ** ** ** ** ** ** ** ** ** ** R2(%) 96.03 86.46 88.92 85.34 81.68 90.97 72.81 89.20 80.48 70.63 R2adj.(%) 95.97 86.26 88.75 85.12 81.40 90.83 72.39 89.03 80.18 70.18 S=RMSE 2.97 2.92 2.32 3.33 3.85 1.81 1.31 0.87 1.68 2.29 CV(%) 9.23 6.46 5.56 7.25 8.49 10.50 10.00 14.60 9.75 15.60 **P<0.01 NS: non-significant
The summary results for MLRA in the Harnai male and female sheep is presented in Table 2. The explained variation of male BW was nearly 90.6% R2 and 90.3 % adjusted R2 with the significant regressors, viz. WH, BL, CG, FL, LBE, and EARL (P<0.01). The furthest contributions on male BW were FL (1.59) and EARL (1.10). R2and adjusted R2 values for female BW were 92.4% and 92.3%. WH, CG, FL, LBE, and EARL
provided important contributions in female BW (P<0.01), but the major contributions were performed by LBE (1.13) and FL (0.70). VIF estimates (1.9 to 7.1 for male and 3.4-9.1 for female) displayed that there was no collinearity problem in each regressor (Table 2). Root of error variance of MLRA was 4.635 and 4.102 for male and female sheep, respectively.
Table 2. Results of Multiple Linear Regression
A WH BL CG PG FL LBE EARL FTW FTL Multiple linear Regression Male Coef -34.67 0.26 0.34 0.14 -0.09 1.59 0.54 1.1 0.1 -0.01 S = 4.634 R2=90.6% R2(adj)=90.3% SE Coef 3.36 0.07 0.09 0.07 0.07 0.16 0.21 0.33 0.2 0.13 T -10.3 3.98 3.93 2.07 -1.34 10.09 2.56 3.34 0.51 -0.09 P 0.00 0.00 0.00 0.04 0.18 0.00 0.01 0.00 0.61 0.93 VIF 4.2 4.8 3.1 4.5 7.1 2.2 4.1 2.6 1.9 Female Coef -41.20 0.66 -0.04 0.30 -0.07 0.70 1.13 0.48 0.17 0.08 S = 4.102 R2=92.4% R2(adj)=92.3% SE Coef 2.30 0.07 0.08 0.06 0.05 0.09 0.13 0.18 0.10 0.08 T -17.94 9.57 -0.52 4.76 -1.46 7.91 8.39 2.73 1.67 1.10 P 0.00 0.00 0.61 0.00 0.14 0.00 0.00 0.01 0.10 0.27 VIF 6.30 8.30 9.10 4.10 9.00 3.70 6.90 5.10 3.40
Results of Using Factor Scores in Multiple Linear Regression: Results of factor analysis in the Harnai male sheep are given in Table 3. Variation of 88.5% on size dimension of male sheep was explained by Factors 1-4 with 39.8%, 23.1%, 13.3% and 12.3%, respectively. Present communalities varied from 0.775 to 0.980 on male sheep. BL (0.933), PG (0.921), WH (0.870) and CG (0.831) made much higher contribution to Factor 1 compared with other regressors and EARL (0.893), FTW (0.724), and FL (0.612) were more significant contributors on the structuring of Factor 2. Furthermore, LBE (0.870) and FTW (0.512) made greater contribution to Factor 3. Similarly, FTL (-0.906) was the highest contributor to Factor 4. Results for using factor scores in MLRA are in Table 4. The new uncorrelated variables (FS1, FS2, FS3 and FS4) in MLRA positively influenced BW.
New uncorrelated regressors gave the best results for BW prediction of Harnai female sheep. For
instance, all the Factors 1-4 were responsible for 96.1% variability of the female LBE. High percentage of variation for each original regressor was explained in Table 3. Communalities from female Harnai sheep ranged between 0.916 and 0.961. WH (0.961), BL (0.832), CG (0.720) and FL (0.709) were of great importance in the settlement of Factor 1 (P<0.01). Similarly, FTL (0.940), FTW (0.813), and EARL (0.750) outstandingly contributed to the formation of Factor 2. The structuring of Factor 3 was with contribution of LBE (-0.784). Also PG (-0.701) was more influential in the settlement of Factor 4. .
Results of using factor scores in MLRA are reported in Table 4. Factor scores (new derived regressors) were significant contributors (92.0 % R2and Adjusted % 91.9 R2) for the female BW prediction. RMSE was 0.284. Using factor scores in MLRA exhibited a good alternative to definitely eliminate multicollinearity problem (Table 2). Factor scores (FS1, FS2, FS3 and
FS4) were deduced to be considerable predictors explaining variation of female BW (P<0.01). Table 3. Rotated Factor Loadings and Communalities
Variable Male Female
Factor1 Factor2 Factor3 Factor4 Com. Factor1 Factor2 Factor3 Factor4 Com.
PG 0.921 -0.075 0.101 -0.170 0.892 0.628 0.218 -0.162 -0.701 0.960 WH 0.870 0.229 0.084 -0.115 0.829 0.961 0.079 -0.131 -0.100 0.956 BL 0.933 0.118 0.049 -0.000 0.886 0.832 0.281 -0.184 -0.354 0.931 CG 0.831 0.215 0.193 -0.011 0.775 0.720 0.355 -0.333 -0.416 0.927 FTL 0.113 0.355 0.142 -0.906 0.980 0.191 0.940 -0.098 -0.112 0.942 FTW 0.080 0.724 0.512 -0.156 0.817 0.104 0.813 -0.405 -0.283 0.916 EARL 0.137 0.893 0.186 -0.283 0.932 0.421 0.750 -0.418 -0.024 0.916 LBE 0.216 0.367 0.870 -0.140 0.958 0.321 0.460 -0.784 -0.176 0.961 FL 0.578 0.612 0.257 -0.348 0.980 0.709 0.492 -0.434 -0.067 0.938 Variance 3.5833 2.0756 1.196 1.1086 7.964 3.3586 2.8186 1.3405 0.9276 8.445 % Var 39.8 23.1 13.3 12.3 88.5 37.3 31.3 14.9 10.3 93.8
Multiple Regression Analysis for PCA Scores: With PCA, original regressors were transformed into two new-latent-regressors with eigenvalues of 4.9581 and 1.9903 for describing the chance in body shape and dimension of Harnai male sheep. PC1 and PC2 equations are:
PC1= 0.367 WH – 0.341 BL – 0.354 CG – 0.324 PG -0.415 FL – 0.308 LBE – 0.315 EARL - 0.291 FTW-0.260 FTL PC2= 0. 281 WH + 0.390 BL + 0.265 CG + 0.412 PG -0.109 FL – 0.282 LBE – 0.404 EARL - 0.411 FTW – 0.326 FTL
Sheep with better values in all original regressors in PC1 equation would be suggested to give heavier BW. Results from PCA scores in MLRA are described in Table 5, and displayed worthy predictors of two PC scores (86.7 % R2 and Adjusted % 86.6 R2). Root of error variance was observed 0.367.
The PCA results for male and female Harnai sheep are presented in Table 4. For female Harnai sheep, two new-latent-regressors whose eigenvalues were 6.3555 and 1.3835 and their PCA equations were written below: PC1= - 0.300 WH – 0.350 BL – 0.368 CG – 0.320 PG – 0.372 FL – 0.332 LBE – 0.348 EARL – 0.308 FTW – 0.291 FTL PC2= 0.478 WH + 0.322 BL + 0.198 CG + 0.311 PG + 0.031 FL – 0.212 LBE – 0.286 EARL – 0.451 FTW -0.450 FTL
Using PCA scores in MLRA without multicollinearity problem was a good choice to achieve the greatest importance results in Table 5. They yielded much high with 88.8 % R2and adjusted 88.7 %R2.
Table 4. Results for Multiple Regression Analysis for Factor Scores
FS1 FS2 FS3 FS4 Male Coef 0.65 0.56 0.27 -0.25 S = 0.352 R2= 87.8% R2(adj) = 87.6% SE Coef 0.02 0.02 0.02 0.02 T 29.01 25.06 11.81 -10.9 P 0.000 0.000 0.000 0.000 VIF 1 1 1 1 Female Coef 0.71 0.45 -0.44 -0.15 S(RMSE)= 0.284 R2=92% R2(adj) =91.9% SE Coef 0.01 0.01 0.01 0.01 T 54.96 34.64 -34.1 -11.43 P 0.000 0.000 0.000 0.000 VIF 1 1 1 1
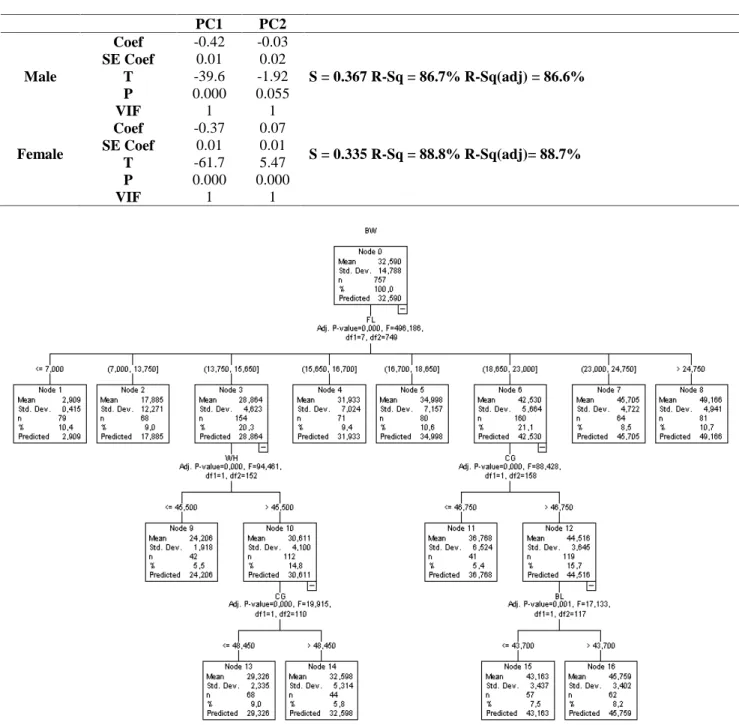
Results of Regression Tree Method: Regression tree (RT) diagram explained 84.4 % of variation in BW. Grand mean (32.590 kg) were given in Node 0 for 757 Harnai sheep at top of RT. FL was the most significant regressor on BW (P=0.000), and Node 0 was divided into
Nodes 1-8 on the basis of FL regressor, respectively. A wide range of 2.909 to 49.166 kg was estimated in the BW together with increasing FL regressor from Node 1 to Node 8. In the first stage, no significant regressor was found on terminal Nodes 1, 2, 4, 5, 7, and 8. Node 3, a
group of Harnai sheep with 13.750 < FL < 15.650 cm, had a mean of 28.864 kg in the BW. WH significantly affected BW of Harnai sheep in Node 3. The Node 3 was seperated into two child Node 9 (a group of those with WH < 45.50 cm among Harnai sheep with 13.750 < FL < 15.650 cm) and Node 10 (a group of those with WH > 45.50 cm among Harnai sheep with 13.750 cm < FL < 15.650) with respect to WH, respectively. BW means of Nodes 9 and 10 were 24.206 and 30.611 kg, respectively. Node 10 was divided into two child Nodes (13 and 14)
with means of 29.326 and 32.598 kg according to CG regressor, but Node 9 was also a terminal node. Node 6 representing a group of Harnai sheep with 18.650 < FL < 23.000 cm was branched in terms of CG regressor into Nodes 11 and 12, respectively. A group of sheep with CG < 46.750 cm within Node 6 was Node 11, also a terminal node, with the mean of 36.768 kg. The influence of BL on BW of sheep in Node 12, re-branched into two Nodes 15 (43.163kg) and 16 (45.759 kg) as to BL, was significant.
Table 5. Results of PCA Scores in Multiple Regression
PC1 PC2 Male Coef -0.42 -0.03 S = 0.367 R-Sq = 86.7% R-Sq(adj) = 86.6% SE Coef 0.01 0.02 T -39.6 -1.92 P 0.000 0.055 VIF 1 1 Female Coef -0.37 0.07 S = 0.335 R-Sq = 88.8% R-Sq(adj)= 88.7% SE Coef 0.01 0.01 T -61.7 5.47 P 0.000 0.000 VIF 1 1
DISCUSSION
Unlike the present results, CG was reported to be a good predictor in the BW prediction of various sheep breeds (Afolayan et al., 2006; Sowande and Sobola, 2008; Yilmaz et al., 2013). Topal et al. (2003) emphasized that the best model (85.1 % R2) is the MLRA model including body length (BL), hearth depth (HD), hearth girth (HG), and pump width (PW) for the BW prediction of Awassi sheep. These values were lower than the present results. In Morkaraman sheep, the MLRA model from HG and PW were reported to be the most suitable model with 78.4 %R2(Topal and Macit, 2004), which was lower than the present results for Harnai sheep, with nine regressors. In the present study R2 results were almost consistent with those mentioned by Cam et al., (2010), with a great accuracy of 91.1 %R2 from chest depth (CD), rump height (RH), chest width (CW), canon circumference (CC), and hearth girth (HG) for Karayaka male sheep, respectively, and of 90.1 %R2 from hearth girth (HG), rump height (RH), chest depth (CD), and body length (BL) for Karayaka female sheep, respectively.
Yakubu, (2009) emphasized a great importance of multicollinearity problem in defining the relationship with a great accuracy between the BW and the morphological characteristics as also addressed in the present paper.
Correlation (r2) values found for Harnai male (90.6% and 90.3%) and female sheep (92.4% and 92.3%) in the only MLRA were higher compared to previous authors (Yilmaz et al., 2013), but lower than Sowande and Sobola, (2008) using HG, HL (Head Length), and WHQ (Width of Hindquarter). The variation may be ascribed to use of different age ranges and breed differences and managerial condition. The current results without multicollinearity problem in MLRA were not in agreement with those reported by Tariq et al. (2012b), who encountered multicollinearity problem in the BW prediction of Mengali male sheep in MLRA from testicular and morphological characteristics as also addressed by Jahan et al. (2013), facing the problem for stepwise and ridge regression analyses.
However, comprehensive investigation on other morphological characteristics connected with BW must be conducted for breeding goals (Yilmaz et al., 2013). Thus, a great number of morphological characteristics were elaborated for the BW prediction in the present study.
Although MLRA has been repeatedly used to predict body weight in the literature, usage of factor and principal component scores in MLRA is scarce for the weight prediction without multicollinearity problem. The relevant regression equation with 87.8 % R2and Adjusted % 87.6 R2in BW prediction of male Harnai sheep from factor scores in MLRA (P<0.01) were higher than those
reported by Tariq et al. (2012b), with the BW estimation of 79.1% R2 and 78.5 % adj.R2 from testicular length (TL), scrotal length (SL), scrotal circumference (SC), body length (BL), withers height (WH) and heart girth (HG) regressors in indigenous male Mengali sheep. The explained proportions of variation in BW of Harnai male sheep were established higher compared to the proportions of Tariq et al. (2012b) in Mengali male sheep. Similarly, Jahan et al. (2013) remarked 91.1% R2 of BW variation from TL, SL, SC, BL, WH and HG regressors in the Balochi male sheep after eliminating multicollinearity problem with the aim of using factor analysis.
Present communalities with a range of 0.916 and 0.961, which were very higher than those found in young and adult Bergamasca female sheep in the investigation conducted by Riva et al. (2004), who referred to be the most significant relationship found between regressors and factors regarding width and height measurements. The difference may be ascribed to the employment of different age groups and linear morphological traits. Present communalities were almost in agreement with those of Tariq et al. (2012b) on 107 male Mengali sheep. Difference between the present study and earlier studies may be due to having their typical morphological structures various regarding different sheep breeds. Further studies should be conducted to generalize the present results on Harnai sheep for breeding goals.
In spite of the fact that different regressors were used in the present and earlier studies for similar purposes, usage of factor and principal component scores could provide a fairly better knowledge for removing their multicollinearity problem in the improvement of BW. When the evidence of significant genetic correlations between weight and morphological traits, which can be measured easily in Harnai sheep, is introduced, they are thought to be distinguishing tools as indirect selection criteria in having allowable genetic improvement of body weight in Harnai sheep.
REFERENCES
Afolayan, R. A., Adeyinka, I. A. and C. A. M. Lakpini (2006). The estimation of live weight from body measurements in Yankasa sheep. Czech J. Anim. Sci., 51: 343-348.
Birteeb, P. T. and M. O. Ozoje (2012). Prediction of Live Body Weight From Linear Body Measurements of West Afrıcan Long-Legged And West Afrıcan Dwarf Sheep In Northern Ghana. J. Anim. Feed Res., 2: 427-434.
Cam, M. A., M. Oflaz and E. Soydan (2010). Body measurements reflect body weights and carcass yields in Karayaka sheep. Asian J. Anim. Vet. Adv., 5: 120.
Eyduran, E., K. Karakus, S. Karakus and F. Cengiz (2009). Usage of factor scores for determining relationships among body weight and body measurements. Bulgarian J. Agric. Sci. 15: 374-378.
Eyduran, E., K. Karakus, S. Keskin and F. Cengiz (2008). Determination of factors influencing birth weight using regression tree (RT) method. J. Appl. Anim. Res., 34: 109-112.
Eyduran, E., M. Topal and A.Y. Sonmez (2010). Use of factor scores in multiple regression analysis for estimation of body weight by several body measurements in brown trouts (Salmo trutta
fario). Int. J. Agric. Biol. 12: 611-615
Eyduran, E., M. Topal and A.Y. Sonmez and S. Keskin (2012). Carcass weight estimation from some morphological traits of Capoeta capoeta capoeta (Guldenstädt, 1772) using factor scores in multiple regression analysis. Pakistan J. Stat., 28: 159-165
Eyduran, E., A. Waheed, M.M. Tariq, F. Iqbal and S. Ahmad (2013). PREDICTION of live weight from morphological characteristics of commercial goat in Pakistan using factor and principal component scores in multiple linear regression. The J. Anim. P. Sci., 23(6): 1532-1540.
Ifeanyichukwu, U. (2012). Use of factor scores for determining the relationship between body measurements and semen traits of cocks, Open J. Anim. Sci., 2: 41-44.
Iqbal, M., K. Javed and N. Ahmad (2013). Prediction of body weight through body measurements in Beetal goats. Pakistan J. Sci. 65 (4): 458-461 Jahan, M., M. M. Tariq, M. A. Kakar, E. Eyduran and A.
Waheed (2013). Predicting body weight from body and testicular characteristics of Balochi male sheep in Pakistan using different statistical Analyses, The J. Anim. P. Sci., 23(1), 14-19. Janssens, S. and W. Vandepitte (2004). Genetic
parametres for body measurement and linear type trait in Belgian Bleu du Maine, Suffolk and texel sheep, Small Rumin. Res., 54: 13-24. Karakus. K., E. Eyduran, T. Aygun, and K. Javed (2010).
Appropriate growth model describing some testicular characteristics in Norduz male lambs. The J. Anim. Plant Sci., 20: 1-4.
Mendes, M. (2009). Multiple linear regression models based on principal component scores to predict slaughter weight of broiler. Arch. Geflügelk., 73: 139-144.
Mendes, M., and E. Akkartal (2009). Regression tree analysis for predicting slaughter weight in broilers. Italian J. Anim. Sci., 8: 615-624.
Riva, J., R. Rizzi, S. Marelli and L. G. Cavalchini (2004). Body measurements in Bergamasca sheep. Small Rum. Res., 55: 221–227.
Sakar, E., S. Keskin and S. Unver(2011). Using of factor analysis scores in multiple linear regressıon model for prediction of kernel weight in Ankara walnuts. The J. Anim. Plant Sci., 21, 182-185. Sowande, O. S. and O. S. Sobola (2008). Body
measurement of West African Dwarf sheep as parameters for estimation of live weight. Trop. Anim. Hea. Prod. 40: 433-439.
Tariq, M. M., M. A. Bajwa, F. Abbas, E. Eyduran, M. A. Awan, M. Rafeeq, A. Waheed, A. Husssain, F. A. Bukhari, M. A. Attiq, Z. Ahmad, and Y. Javed (2011). Some morphological, fertility and growth traits for Mengali sheep of Balochistan, Pakistan. Iğdır Univ. J. Inst. Sci. & Tech. (JIST), 1: 63-68.
Tariq, M. M., M. Rafeeq, M. A. Bajwa, M. A. Awan, F. Abbas, A. Waheed, F. A. Bukhari, and P. Akhtar (2012a). Prediction of body weight from body measurements using regression tree (RT) method for indigenous sheep breeds in Balochistan, Pakistan, The J. Anim. Plant Sci. 22: 20-24.
Tariq, M. M., E. Eyduran, M. A. Bajwa, A. Waheed, F. Iqbal and Y. Javed (2012b). Prediction of body weight from testicular and morphological characteristics in indigenous Mengali sheep of Pakistan: using factor analysis scores in multiple linear regression analysis. Int. J. Agric. Biol. 14: 590-594
Topal, M., N. Yildiz, N. Esenbuğa, V. Aksakal, M. Macit and M. Özdemir (2003). Determination of best fitted regression model for estimation of body weight in Awassi Sheep. J. Appl. Anim. Res. 23: 201-208.
Topal, M. and M. Macit (2004). Prediction of body weight from body measurements in Morkaraman sheep. J. App. Anim. Res. 25: 97-100.
Yakubu, A. (2009). Fixing collinearity instability in the estimation of body weight from morpho-biometrical traits of west African dwarf goats. Trakia J. Sci. 7: 61-66.
Yilmaz, I., E. Eyduran, A. Kaygisiz and K. Javed (2011). Estimates of genetic parameters for lactation shape parameters with multivariate statistical technique in Brown Swiss cattle, Int. J. Agric. Biol. 13: 174-178.
Yilmaz, O., I. Cemal and O. Karaca (2013). Estimation of mature live weight using some body measurements in Karya sheep. Trop. Anim. Heath Prod. 45: 397–403.