belirlendiği görülmektedir. Bazı ülkeler kalibrasyonu
laboratuvar ve saha kontrolleri olarak tespit ederken bazı
ülkelerde sadece laboratuvar ortamında kalibrasyon söz
konusudur. Kalibrasyon süresi yönüyle incelendiğinde
4-5 yıllık periyotlarda kalibrasyonların zorunlu tutulduğu
görülmektedir.
EHD cihazları için kalibrasyon yöntemi TS EN 12405-1
Gaz Sayaçları – Dönüşüm Tertibatları – Bölüm 1:Hacim
Dönüşümü (Gas meters – Conversion devices – Part 1:
Volume conversion) standardında verilmiştir. Bu
standartta verilen yönteme göre EHD cihazları tüm
basınç ve sıcaklık bölgesi taranacak biçimde referans bir
cihazla karşılattırılmakta ve elde edilen ölçüm hatasının
%0,5 değerinden daha düşük olup olmadığına
bakılmaktadır.
4. UGETAM ELEKTRONİK HACİM
DÜZELTME CİHAZLARI KALİBRASYON
LABORATUVARI HİZMETLERİ
Özelleştirmelerle birlikte doğalgaz dağıtımı İstanbul,
Ankara, Bursa ve Eskişehir gibi illerimizin dışında da
son 10 yılda hızla yaygınlaştı. Bu sektörün teknik destek
kuruluşu olarak UGETAM bu sektör tarafından ihtiyaç
duyulacak tüm hizmetlerle ilgili gerekli girişimleri
öncesinden sağlama bilinciyle 2012 yılında Elektronik
Hacim Düzeltme Cihazlarının kalibrasyon ve ayarlarını
yapabilen bir laboratuvar çalışmasını tamamlayarak
sektörün hizmetine sunmuştur. TÜBİTAK projesi olarak
yürütülen çalışmanın tamamlanmasının ardından
akreditasyon çalışmaları da tamamlanarak 2013 yılı
içinde TÜRKAK Türk Akreditasyon Kurumundan
akreditasyon sağlanmıştır. UGETAM EHD Cihaz
Kalibrasyon Laboratuvarı bu yönüyle Türkiye’nin ilk ve
tek laboratuvarı konumundadır. Laboratuvarda, birden
fazla EHD cihazının aynı anda kalibrasyonunun
yapılmasına yönelik özel bir sistem kurularak TPE Türk
Patent Enstitüsünden patenti alınmıştır. Bu sistemle
birden çok ve farklı yazılımla çalışan EHD cihazı eş
zamanlı
olarak
kalibrasyon
işlemine
tabii
tutulabilmektedir. Uzun kalibrasyon süresine sahip
EHD cihazları için bu yöntem son derece önem
taşımakta, birden çok cihazın kalibrasyonu,
marka-modele bağımlı olmaksızın daha kısa sürelerde
gerçekleştirilebilmektedir. Diğer taraftan kalibrasyon
sonucu hata sınırları dışında tespit edilen cihazların
ayarları da bu laboratuvar bünyesinde yapılabilmektedir.
5. SONUÇ VE DEĞERLENDİRMELER
Bahsedildiği
gibi
EHD
cihazları
doğalgaz
faturalandırma-ölçüm
sisteminin
en
önemli
unsurlarından biri olarak durmaktadır. Hatta ülkemizde
EPDK Enerji Piyasası Düzenleme Kurumu tarafından
belirlenen yeni serbest tüketici şartlarıyla birlikte EHD
cihazlarının önemi daha da artmıştır. Gaz dağıtımcıları
ve Serbest tüketiciler arasında teslim noktalarında EHD
cihazları kullanılarak daha hassas ölçümler ve dolayısı
ile daha adil alım-satımlar olacaktır. Ancak bu durumun
sağlanması için EHD cihazlarıyla ilgili teknik
düzenlemelerin de eşzamanlı olarak gerçekleştirilmesi
gerekmektedir.
Bu teknik düzenlemeler, en azından, kalibrasyon
periyotları, yetkili kurumları ve kişileri, kullanılan
hesaplama algoritmaları ile ilgili sınırlamalara ve
izinlere yönelik kuralları içermelidir.
Diğer taraftan EHD cihazı alımında kurum, kuruluş ve
kişilerin de teknik kriterlere dikkat etmeleri önemlidir.
En başta EHD cihazlarının MID(Measurament
Instrument Directive) kapsamında CE markası taşımaları
önemlidir. 2004/22 AT Ölçü Aletleri Yönetmeliği
çerçevesinde 2009 yılı sonrasında onay alarak, imal
edilmiş EHD cihazlarının bu markayı taşımaları kanuni
biz zorunluluktur.
Bugün itibariyle EHD cihazlarının kalibrasyon
şartlarıyla ilgili olarak zorlayıcı bir mevzuat olamasa
bile dağıtım kuruluşlarının ölçüm sistemlerini güvence
altına almak için kalibrasyon yaptırmaları önemlidir.
Burada kalibrasyon yapan sistemler için akreditasyon
önemli bir ayırt edici unsur olarak durmaktadır. Çünkü
EHD
cihazlarının
kalibrasyonlarının
yapıldığı
laboratuvar referanslarının izlenebilir, düşük belirsizliğe
ve yüksek doğruluğa sahip olmaları önemlidir.
6. KAYNAKÇA
[1] TS EN 12405-1 Gaz Sayaçları – Dönüşüm
Tertibatları – Bölüm 1:Hacim Dönüşümü (Gas
meters – Conversion devices – Part 1: Volume
conversion) Nisan 2008
[2] 2004/22/AT Ölçü Aletleri Yönetmeliği 07.08.2008
tarih ve 26960 Nolu Resmi gazetede yayımlanan.
[3]TS EN ISO 12213-1 Doğalgaz – Sıkıştırma Faktörü
Hesaplanması – Bölüm 1: Giriş ve Kılavuz
[4]TS EN ISO 12213-2 Doğalgaz – Sıkıştırma Faktörü
Hesaplanması – Bölüm 2: Molar Bileşim Analizi
Kullanılarak Hesaplama
[5]
TS EN ISO 12213-2 Doğalgaz – Sıkıştırma Faktörü
Hesaplanması – Bölüm 3: Fiziksel Özellikler
Kullanılarak Hesaplama
[6] Alman Yönetmelikleri ( Gaz sayaçları ve EHD
Cihazları )
[7] CMI Yönetmelikleri
[8] G-18 (rev. 2) Reverification Periods for Gas
Meters, Ancillary Devices and Metering
Installations – An Agency of Industry Canada
[9] Utility-Measuring Instruments Directive 200422EC
Common Application for utility meters - 11.1 -
Issue-4 WELMEC
[10] Measuring systems for gaseous fuel – OIML R140
Edition 2007 (E)
SMART METERING IN GAS – REVENUE POTENTIAL OR WASTE OF MONEY?
Itron is bringing clarity to your investment decisions
André Wankelmuth
11. Director Strategic Market Development
Itron
SUMMARY
In this paper Itron introduces a consulting methodology that goes beyond the traditional feature to benefit approach, and concentrates instead on a problem-focused risk management approach. Following five easy steps, risks are identified, prioritized, their impact assessed and risk mitigation options
selected that build the fundament for a risk management strategy.
Working with customers in Turkey, risks on regulatory compliance / rate making, supplier dependency, exchange
rate exposure, timeliness of readings, outstanding receivables, meter rightsizing and tamper detection as well
as their potential impact have been identified, going far beyond the usual evaluations of efficiency improvements. Using Itron’s new consulting service, utilities in Turkey and
around the world are assessing whether changing the metering infrastructure to smart technologies is adding value
or not. As proven in Turkey addressing one or two issues might be sufficient to pay for a complete roll-out.
ABSTRACT
So you are thinking about implementing a smart grid infrastructure. You have read all the relevant documentation and standards and looked at the newest and most innovative technologies. You have even talked to existing smart grid users about their experience. But with all of that information there is still this lingering question – is smart grid the right path for my utility?
The traditional model to support your decision process is a cost-benefit analysis. More often than not, these analyses follow a feature oriented approach. Starting from technology, the customer implementation environment is evaluated and a path is suggested to realize certain benefits offered by a specific feature.
Furthermore smart metering is frequently focused on efficiency improvements to the key utility operational processes. This is even truer for the gas industry: some of the major smart metering drivers for the electricity utilities such as peak load reduction or load control do not apply to gas. Especially in the quickly developing countries, operational efficiency is not a key factor either – low labor costs often
outbalance the substantial cost of a smart meter implementation.
In this paper Itron introduces its consultancy service for gas utilities that follows a much broader, problem focused approach. Instead of starting from features and afterwards finding problems that can be solved with this technology, Itron’s consulting services take a technological neutral standpoint and focus on the core building blocks that make up a gas utilities’ business model to identify relevant external and internal risks.
In his article, André Wankelmuth, director of strategic market development at Itron, provides insight into Itron’s methodology and puts a special focus on key findings as they relate to the Turkish market.
ÖZETÇE
Demek ki akıllı şebeke altyapısı uygulamayı düşünmektesiniz. Konu ile ilişkili tüm dokümantasyon ve standartları okuyup, en yeni ve en yenilikçi teknolojileri incelediniz. Hatta mevcut akıllı şebeke kullanıcıları ile deneyimleri hakkında görüştünüz. Edinilen tüm bilgilerle bile şu daimi soru hala mevcuttur – akıllı şebeke idarem için doğru bir yol mudur? Karar sürecinizi desteklemek için geleneksel model maliyet-fayda analizidir. Çoğunlukla, bu analizler özellik odaklı bir yaklaşım takip eder. Teknolojiden yola çıkarak, müşteri uygulama ortamı değerlendirilir ve spesifik bir özellik tarafından sunulan kesin faydaları gerçekleştirmek için bir metot tavsiye edilir.
Ayrıyeten akıllı ölçüm, çoğunlukla idarenin ana işlevsel süreçlerinin verimlilik gelişimine odaklanır. Bu durum gaz sektöründe daha da doğrudur: azami yük azaltılması veya yük kontrolü gibi elektrik idarelerinin başlıca akıllı ölçüm faktörlerinin bazıları gaza uygun düşmez.
Özellikle hızlı gelişen ülkelerde operasyonel verimlilik temel etken değildir –düşük işçilik maliyetleri genellikle akıllı sayaç uygulamasının büyük maliyetinden daha ağır basar. Bu bildiride Itron; gaz idareleri için daha kapsamlı, problem odaklı danışmanlık hizmetini tanıtmaktadır. Özelliklerden
başlayıp devamında da bu teknoloji ile çözülecek sorunları bulmaktansa; Itron’un danışmanlık hizmetleri tarafsız teknolojik bakış açısı ile yaklaşır ve gaz idarelerinin ilgili dış ve iç risklerini tanımlamak için iş modellerini düzenleyen temel yapı taşlarına odaklanır.
Itron’un stratejik pazar geliştirme direktörü André Wankelmuth bu makalesinde Itron’un metodolojisine ışık tutmaktadır ve Türk Pazarı ile ilgili temel bulgulara özel olarak odaklanmıştır.
1. LOOKING BACK
Smart metering and smart grid have become the most important topics of conversation in the energy industry. Smart Grid is supposed to solve the challenge of the ever growing energy demand on the one end and increasing scarcity of energy resources on the other.
When a utility wants to evaluate if the implementation of a smart grid is the right path to pursue, the question comes down to the payback of that major investment: the return on invest (ROI). The traditional model to support that decision process is a cost-benefit analysis (CBA) factoring in tangible and intangible assets like increased brand value, innovation, environmental aspects.
These analyses usually follow a feature-oriented approach. Starting from a technology choice, the customer’s implementation environment is evaluated and a path is suggested to realize certain benefits offered by each feature. In JRCs Reference Report on Guidelines for conducting a cost-benefit analysis for Smart Grid projects (Giordano, et al., 2012), the following 4 steps have been determined:
“identify each technology and program that fits within the scope of smart grids;
identify benefits of each technology / program […]; identify technology, installation program and management
costs based on utility and customer characteristics; compare costs and benefits to determine investment
returns […]”
Giordano et al. expand the scope in their proposed guidelines to include societal benefits and consumer benefits, as well as qualitative impact analysis and sensitivity analysis on the quantified benefits. But at its core the proposed procedure still starts with technology and then derives benefits from the provided functionality (refer to Figure 1).
Itron has observed that many international markets have focused on a technology driven discussion that resulted in quiet detailed technical specifications, with no clear answer to the
question: “What problem do we want to solve with this technology?”
The second breakdown is manifested by the fact that especially for gas-only utilities, the business case is becoming very hard to justify. Big business case drivers for electricity utilities such as Peak Load Reduction or Demand Side Management do not apply to gas utilities, often leaving only a very narrow approach focusing on generating benefits from operational efficiency improvements. Benefits like automation of meter reading, back office savings, synergies / better management of field work orders or billing automation, etc.
Figure 1: Methodology for performing a CBA (own representation acc. Giordano, et al., 2012) These benefits are often not sufficient to provide a positive cost-benefit result. This is even truer for countries with low labor costs such as Turkey. Using the example of reading automation, with a price of about €0,50 per successful read and the requirement of bi-monthly reads the total cost per year add up to €3. Introducing a GPRS based smart meter to automate the process would add up to €4-6 per year on communication cost alone - even a well-negotiated telecommunication contract will be in the range of €0,30 to €0,50 per month. Asset costs and installation and maintenance costs are not even considered in this example.
Are we at a dead end for gas utilities who want to go smart? Not at all! We just need to take a different approach that is not driven by technology and take a wider angle instead of looking at operational efficiency only.
2. CHANGING THE APPROACH
Technology is helping to solve problems; if it does not help, there is no reason to implement it. Therefore the starting point has to be identifying the problem first and then deciding on the technology that solves that problem.Itron takes a risk management approach to this challenge looking at the end-to-end utility’s business model (adapted from Kunreuther (2014)) as shown in Figure 2.
1. Identify Risk 2. Prioritize Risks 3. Risk Assessment 4. Identify Risk Management Options 5. Design Risk Management Strategy 6. Implementation 7. Monitor Progress and Update Strategy
Figure 2: Risk management approach – own representation adapted from Kunreuther (2014)
Starting from a completely neutral technology standpoint, Itron looks at each building block of the business model from customer segments, revenue streams and key activities to key partners and cost structure. Furthermore Itron tries to identify all potential internal and external risks that might impact the business model (refer to Figure 3 for the main challenge areas for gas utilities).
Having identified the key risks Itron prioritizes according to potential impact and likelihood of occurrence. For the top risks, an assessment of the minimum and maximum financial impact is performed based on Itron’s more than 100 years of industry expertise and experience from smart metering roll-outs all over the world.
Only in step four after identifying and qualifying the risk will Itron be looking at the technology components and at their ability to address, solve or at least minimize the dedicated risks. After selecting the right technology components, a potential end-to-end solution is designed that establishes the core for successful mitigating the risk using smart metering technologies. Each strategic option is then commercially assessed via a comprehensive net present value (NPV) analysis (financial model using the time value of money to appraise long-term projects).
This process clearly outlines whether there is a pay back and whether it makes sense to invest in smart technologies or not. The net present value and the calculated internal rate of return (profitability of the investment) are fundamental in supporting the selection process for the right option.
Step six and seven are mainly driven from the side of the utility, with Itron taking a more supporting and consulting role. The gas utilities industry is changing dramatically highlighting the importance of managing risks: “[…] The utility sector used to be considered a crisis-proof industry. This no longer applies. Economic and political framework conditions have become less predictable. To us, systematically recording, assessing and controlling risks is more important than ever before […]” (RWE Aktiengesellschaft, 2012, p. 88). This increased risk
scenario is not limited to European markets either. Itron’s customer Brazilian gas utility for example is not only looking at managing market risks, operational risks and financial risks, but also supply risks, environmental and regulatory risks: “[…]This Brazilian gas utility has a standing committee that monitors, discusses, and adopts measures to minimize exposure to risk affecting operations and / or performance. […] As a support tool, it structured the online risk management system that it has been using for five years.” (Brazilian gas utility, 2012, p. 40).
Figure 3: Gas Utility Challenges and Risks Global support for like the statements above encourage Itron to continue working and enhancing this approach to create extended value for our customers. Whereas some challenges generally apply for gas utilities around the world, the specifics are dependent on each customer’s situation and need to be looked at individually.
What is becoming very quickly apparent is the fact that utility challenges are much broader than looking at operational efficiency only. Itron has identified a comprehensive set of key gas utility challenges at stake (refer to Figure 3).
Safety and security is a major topic for two reasons: 1) The main value proposition to consumers is the secure and safe supply of energy. Nobody wants to cook and heat with gas if there is a safety hazard. 2) The gas infrastructure (pipes and meters) is the central, most costly and valuable asset in a distribution service operator’s business. Because of these reasons, leak detection, ensuring system integrity and anticipation of ageing patterns for piping and metering assets are some of the main challenges in these categories keeping utilities’ managers awake at night.
Network delivery performance challenges include the provision of adequate capacity for peak demands (e.g. during a cold winter day), but at the same time the challenge to not oversize the infrastructure and guarantee a high asset utilization. Furthermore, constant monitoring of pressure stability and gas quality is required for proper network delivery performance. Especially in developing nations (not only there, but in developed countries as well) and due to rising energy prices
across the globe, revenue protection is a major challenge. How can utilities ensure that the revenues for the services provided can be recognized in order to get a return on the huge investments made for the smart grid infrastructure? Questions along the lines of assuring cash flows, the reduction of outstanding receivables and the reduction of internal and external apparent losses need to be addressed.
Very well known of course is also the discussion about how to engage and satisfy the end consumer. What new services can be offered? Improvement of supply and payment convenience, reduction of customer complaints, budget control support and delivering meaningful information to consumers are major topics to be taken into account.
Profitable operation and management of a regulated business with changing framework conditions is undoubtedly a very important aspect as well. Thus regulatory compliance in respect to rate making, fair and accurate billing and reduction of the company’s CO2 footprint are major themes to be assessed. Managing scarce energy resources is the major challenge of our century. In the risk category ‘resource management’, Itron looks at the energy resource gas itself, but also at the utilities’ resources in a broader sense. Themes of interest are the reduction of gas losses, security of supply (ensure availability and new customer connection), customer and employee retention, unbalanced trade conditions or price volatility impact. Looking at all themes above, it is fair to summarize that there are many more challenges than just operational efficiency improvements that have to be considered when evaluating the benefits of smart technologies. With its proven evaluation technique and methodology, Itron has gained insight into these themes and has built a point of view on how smart technologies can help to manage these risks.
3. APPLYING THE METHODOLOGY - HOW
DOES IT LOOK IN PRACTICE?
Let us take an example to illustrate how the methodology works.
Step 1: Identify risks
Reading the annual report of Brazilian gas utility, a gas utility in Brazil, on average 1.4 months of outstanding receivables can be identified. In Turkey outstanding receivables of up to 2.8 months have been observed. It is obvious there is a problem of bill to cash that has to be addressed.
Efficiency improvements in data collection using smart meters will reduce the time between metering and bill issuance, but not
the time from sending the bill until the revenue is recognized. The risk has to be addressed differently.
Step 2: Prioritize risks
As only a single risk is used in this example, prioritization is irrelevant. Nevertheless outstanding receivables have a direct cash impact and with an average of 2.8 months outstanding, the likelihood of this risk manifesting is very high.
Step 3: Risk assessment
For the sake of illustration let us take two months (60 days) of outstanding receivables as a baseline In an utility with 1,000,000 end customers and $700 M yearly revenue, 60 days outstanding receivables amount to about $115 M ($700 M / 365 * 60) or $115 per customer. Using a technology that limits the outstanding receivables to 5 days, a one-time benefit of about $105 M could be realized. This alone could already pay for the investment needed to change the meter base to smart meters.
Step 4: Risk management options
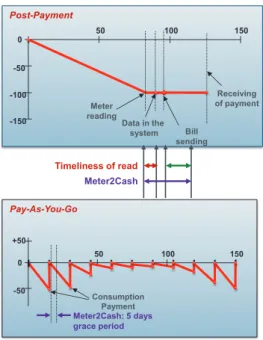
One specific technology (among many) addressing the identified challenge is “Pay-As-You-Go”. The payment period (e.g. 1 month) is programmed in the smart meter. At the end of the payment period, the meter gives a warning and the consumer has a five day grace period to pay the total volume of gas that was consumed. If the consumer doesn’t pay the total outstanding volume on the meter, the valve of the meter will close until the total outstanding volume is paid (refer to Figure 4 bottom picture).The outstanding receivables are reduced to 5 days. -150 -100 -50 0 50 100 150 Meter reading Bill sending Receiving of payment Data in the system Post-Payment Meter2Cash Timeliness of read -50 0 50 150 Pay-As-You-Go +50 100 Consumption Payment Meter2Cash: 5 days grace period
Figure 4: Meter2Cash cycle conventional post payment and PayGo (Pay-As-You-Go)
Whether it makes sense to include the “Pay-As-You-Go” technology in a final end-to-end solution depends on the complete problem landscape that needs to be assessed.
4. FINDINGS FOR TURKEY
Geographically Turkey enjoys a very favorable position being located between Europe, Middle East and Asia with gas pipelines from main energy producers such as Russia, Azerbaijan and Iraq traversing the country.
With a strong growth in GDP in the past years (4.5% between 2002 and 2009) and the actual growth in 2013 still reaching 2.1%, Turkey shows that it can withstand adverse global economic environments.
Due to its strong economic growth, Turkey’s energy demand is increasing quickly. Natural gas plays a dominant role (17% CAGR since 1988) in industrial use, electricity generation and residential use for cooking, heating and hot water. This trend is expected to continue in the future. Interest rates at a historical low rate of 4.5% and forecasts extend this rate even more. With the Natural Gas Market Law 4646 issued in 2001, Turkey’s Energy Market Regulatory Authority (EMRA) started the liberalization of the Turkish energy market. Intended to
foster the uptake of natural gas, infrastructure distribution and supply activities have been privatized. This allows for increased market competition, followed by a diversification in offerings, a reduced monopolistic dependency and improvement in end customer service, quality and pricing.
Rate making / regulatory compliance risk
In the privatization process the Turkish regulator EMRA assigns licenses to distribute gas in a certain area based on a tendering process with the successful bidder obtaining a guarantee for a fixed distribution margin for a period of eight years. After the initial eight year period, the tariff is calculated based upon the investments made by the distribution service company with both capital and operational expenditures being considered in the calculation (refer to Figure 6).
Regulators aim to limit the profit of distribution service operators as they operate in a local monopoly but at the same time regulators want to ensure a fair return on the investment done by the operator. The revenue calculation in Turkey as defined by EMRA follows a regulatory asset base (RAB) approach with a revenue income cap (Perrin & Chosson, 2013, p. 7). Other European countries like France or the Netherlands follow incentive-based approaches or a mixture of both like e.g. in Greece, Italy or Spain.
In principle RAB schemes calculated the so called “revenue requirement” (capped revenue) based on the non-depreciated assets the company acquired multiplied by the allowed rate of return. The annual depreciation, operating expenses and taxes are then added to the sum (refer to Figure 5).
T
+
E
+
d
+
r
x
B
=
R
Figure 5: Rate calculation principle for regulatory asset base approaches with revenue cap
In principle the same approach is used by the regulator EMRA in Turkey: The asset base (ODVT and SHDVT) is multiplied by the rate of return (RMGO) and amortization (I) and operating expenses (IG and DG) are added to the equation (refer to Figure 6)
across the globe, revenue protection is a major challenge. How can utilities ensure that the revenues for the services provided can be recognized in order to get a return on the huge investments made for the smart grid infrastructure? Questions along the lines of assuring cash flows, the reduction of outstanding receivables and the reduction of internal and external apparent losses need to be addressed.
Very well known of course is also the discussion about how to engage and satisfy the end consumer. What new services can be offered? Improvement of supply and payment convenience, reduction of customer complaints, budget control support and delivering meaningful information to consumers are major topics to be taken into account.
Profitable operation and management of a regulated business with changing framework conditions is undoubtedly a very important aspect as well. Thus regulatory compliance in respect to rate making, fair and accurate billing and reduction of the company’s CO2 footprint are major themes to be assessed. Managing scarce energy resources is the major challenge of our century. In the risk category ‘resource management’, Itron looks at the energy resource gas itself, but also at the utilities’ resources in a broader sense. Themes of interest are the reduction of gas losses, security of supply (ensure availability and new customer connection), customer and employee retention, unbalanced trade conditions or price volatility impact. Looking at all themes above, it is fair to summarize that there are many more challenges than just operational efficiency improvements that have to be considered when evaluating the benefits of smart technologies. With its proven evaluation technique and methodology, Itron has gained insight into these themes and has built a point of view on how smart technologies can help to manage these risks.
3. APPLYING THE METHODOLOGY - HOW
DOES IT LOOK IN PRACTICE?
Let us take an example to illustrate how the methodology works.
Step 1: Identify risks
Reading the annual report of Brazilian gas utility, a gas utility in Brazil, on average 1.4 months of outstanding receivables can be identified. In Turkey outstanding receivables of up to 2.8 months have been observed. It is obvious there is a problem of bill to cash that has to be addressed.
Efficiency improvements in data collection using smart meters will reduce the time between metering and bill issuance, but not
the time from sending the bill until the revenue is recognized. The risk has to be addressed differently.
Step 2: Prioritize risks
As only a single risk is used in this example, prioritization is irrelevant. Nevertheless outstanding receivables have a direct cash impact and with an average of 2.8 months outstanding, the likelihood of this risk manifesting is very high.
Step 3: Risk assessment
For the sake of illustration let us take two months (60 days) of outstanding receivables as a baseline In an utility with 1,000,000 end customers and $700 M yearly revenue, 60 days outstanding receivables amount to about $115 M ($700 M / 365 * 60) or $115 per customer. Using a technology that limits the outstanding receivables to 5 days, a one-time benefit of about $105 M could be realized. This alone could already pay for the investment needed to change the meter base to smart meters.
Step 4: Risk management options
One specific technology (among many) addressing the identified challenge is “Pay-As-You-Go”. The payment period (e.g. 1 month) is programmed in the smart meter. At the end of the payment period, the meter gives a warning and the consumer has a five day grace period to pay the total volume of gas that was consumed. If the consumer doesn’t pay the total outstanding volume on the meter, the valve of the meter will close until the total outstanding volume is paid (refer to Figure 4 bottom picture).The outstanding receivables are reduced to 5 days. -150 -100 -50 0 50 100 150 Meter reading Bill sending Receiving of payment Data in the system Post-Payment Meter2Cash Timeliness of read -50 0 50 150 Pay-As-You-Go +50 100 Consumption Payment Meter2Cash: 5 days grace period
Figure 4: Meter2Cash cycle conventional post payment and PayGo (Pay-As-You-Go)
Whether it makes sense to include the “Pay-As-You-Go” technology in a final end-to-end solution depends on the complete problem landscape that needs to be assessed.
4. FINDINGS FOR TURKEY
Geographically Turkey enjoys a very favorable position being located between Europe, Middle East and Asia with gas pipelines from main energy producers such as Russia, Azerbaijan and Iraq traversing the country.
With a strong growth in GDP in the past years (4.5% between 2002 and 2009) and the actual growth in 2013 still reaching 2.1%, Turkey shows that it can withstand adverse global economic environments.
Due to its strong economic growth, Turkey’s energy demand is increasing quickly. Natural gas plays a dominant role (17% CAGR since 1988) in industrial use, electricity generation and residential use for cooking, heating and hot water. This trend is expected to continue in the future. Interest rates at a historical low rate of 4.5% and forecasts extend this rate even more. With the Natural Gas Market Law 4646 issued in 2001, Turkey’s Energy Market Regulatory Authority (EMRA) started the liberalization of the Turkish energy market. Intended to
foster the uptake of natural gas, infrastructure distribution and supply activities have been privatized. This allows for increased market competition, followed by a diversification in offerings, a reduced monopolistic dependency and improvement in end customer service, quality and pricing.
Rate making / regulatory compliance risk
In the privatization process the Turkish regulator EMRA assigns licenses to distribute gas in a certain area based on a tendering process with the successful bidder obtaining a guarantee for a fixed distribution margin for a period of eight years. After the initial eight year period, the tariff is calculated based upon the investments made by the distribution service company with both capital and operational expenditures being considered in the calculation (refer to Figure 6).
Regulators aim to limit the profit of distribution service operators as they operate in a local monopoly but at the same time regulators want to ensure a fair return on the investment done by the operator. The revenue calculation in Turkey as defined by EMRA follows a regulatory asset base (RAB) approach with a revenue income cap (Perrin & Chosson, 2013, p. 7). Other European countries like France or the Netherlands follow incentive-based approaches or a mixture of both like e.g. in Greece, Italy or Spain.
In principle RAB schemes calculated the so called “revenue requirement” (capped revenue) based on the non-depreciated assets the company acquired multiplied by the allowed rate of return. The annual depreciation, operating expenses and taxes are then added to the sum (refer to Figure 5).
T
+
E
+
d
+
r
x
B
=
R
Figure 5: Rate calculation principle for regulatory asset base approaches with revenue cap
In principle the same approach is used by the regulator EMRA in Turkey: The asset base (ODVT and SHDVT) is multiplied by the rate of return (RMGO) and amortization (I) and operating expenses (IG and DG) are added to the equation (refer to Figure 6)
Figure 6: EMRA rate calculation
When looking at the formula in Figure 6, it seems that it is irrelevant to work on efficiency improvements as operating expenses (OPEX) are recognized in the tariff as well. Itron found out in a specific case analyzed that the allowed annual revenue calculated was very similar for a scenario with more capital expenditure (CAPEX) heavy smart meters going in hand with optimized OPEX as for a less CAPEX intense scenario with more manual OPEX heavy processes. But the impact on the bottom line net income (= Allowed revenue – costs of goods sold – sales, marketing and general expenses) was extensive: depending on the scenario, the net income was double to triple as high for the case with higher automation compared to the lower automation case.
One surprise finding in the analyzed case was that the initial agreement (refer to explanation about privatization process above) was very favorable and that the revenue cap would be reduced by about 50% after the initial period although heavy CAPEX was factored into the period before the official rate was applied. This finding enables the customer to anticipate and prepare for the time ahead requiring the implementation of focused cost avoidance measures.
Supplier dependency, exchange rate exposure
EMRA’s target is to increase the amount of gas imported by privately owned companies to more than 20% and foster competition. This shall be achieved by demanding distribution service companies to obtain less than 50% of their gas from a single source. In practice Botas is still the main source of gas in Turkey as changes are only slowly starting to materialize. Long term gas supply contracts that are often still linked to oil indices are in their nature take or pay contracts. This bears two risks: First, gas market prices have been significantly lower than oil prices (€10-12 per MWh (RWE Aktiengesellschaft, 2012, p. 39)) which constitutes a risk of about USD 288 M for a distribution volume of 2 Bn m³ (€11 / 100 m³ x 1.31 x 2 Bn m³) for long term contracts linked to the price of oil versus gas market prices. Secondly, consumption below 80% of the contracted volume has to be paid regardless if the volumes have been delivered or not. From experience with cases in Latin America where supplier dependency was even lower, Itron could demonstrate that this is a risk of about 3% of the costs of goods sold. So for a utility distributing 2 Bn m³ per year the risk amounts to about USD 26 M.
A better forecasting accuracy supports a stronger negotiation position on supply contracts, especially when market pricing is not linked to the oil index. The basis for proper forecasting is provided by a granular view of what amount of gas is consumed and what amount of gas was injected into the grid. This balancing of input and output is only possible having clear cut-off dates for which consistent sets of data are available across the whole meter park.
Timeliness of readings, outstanding receivables
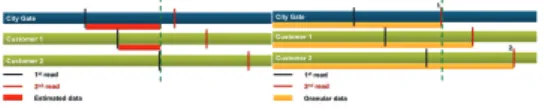
Why is it difficult to have clear cut-off dates with consistent data? The reason lies within the manual reading process. The essential drawback of manual reads is that no data logging takes place in between each manual read. Thus no consistent set of data across the whole meter park at a defined cut-off date can be achieved. Refer to the left side of Figure 7. As only punctual data is available from the first and second reads and readings for different customers do not take place at the same time, consumption data from last read to cut-off date (green line) has to be estimated. City Gate Customer 1 Customer 2 1stread 2ndread Estimated data City Gate Customer 1 Customer 2 1 2 1stread 2ndread Granular data
Figure 7: Timeliness of readings and clean cut-off date using walk-by smart technology
Besides a potential benefit of reducing labor costs via automation, smart technologies send granular data like last 30 daily index values or more are stored in a smart meter’s or module’s memory, making a clean cut-off possible. Figure 7 on the right side shows an example using a walk-by system. Readings are still taken at defined punctual dates, but in taking the read more granular (e.g. daily) data is collected from the smart meter. Latest at the date marked with “2” in the diagram, a clean cut-off is possible for the date marked “1”.
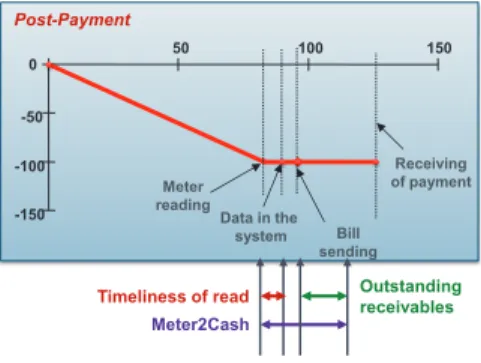
In some instances the bills can be even printed on site, thus achieving a consistent cut-off date is not relevant from a billing point of view. From both a profit and loss point of view and an accurate forecasting point of view, a detection of losses (technical or apparent) through a clean cut-off is essential. In cases where bill printing is not possible on site (either due to a technological or regulatory point of view), the timeliness of readings become important again, as it reduces read to cash cycle time (refer to Figure 8 time between meter read and bill generation). The timeliness of reading defined as the time it takes from taking the meter read until the data is in the system can be almost instant, for example if the handheld is equipped with a GPRS modem sending data to the head-end over the air. The time frame between “1” and “2” (refer to Figure 7) becomes zero if e.g. smart meters with fixed network architectures are used, that send in daily data.
-150 -100 -50 0 50 100 150 Meter reading Bill sending Receiving of payment Data in the system Post-Payment Meter2Cash
Timeliness of read Outstanding receivables
Figure 8: Meter-to-Cash Cycle: Importance of timeliness of readings and outstanding receivables
Another important aspect to influence the meter-to-cash cycle is the time between sending the bill and the moment the money is received in the bank account – the time of receivables outstanding. For customers that are not on direct debit accounts, this time can be up to 60 days or more and a certain percentage cannot be recovered at all, and are required to be written off as impairment of receivables. For a utility each day of receivables outstanding represents 0.247% of revenue (yearly revenue / 365 days). If the time between meters being read and having the data in the system for bill generation is two days and the average is 45 days of receivables outstanding, the outstanding receivables add up to 12.88% of revenue.
Minimizing these outstanding receivables often generates a one-time cash effect high enough to fund a smart roll-out project without considering other benefits.
Meter rightsizing
Service points differ in consumption depending on the use of gas for cooking-only (low) cooking and hot water (mid) or cooking, hot water and heating (high). Apart from the core usage type, consumption will also differ based on customer segment residential, light commercial, or industrial.
The size of the meter measuring unit needs to be aligned with the main operating range to provide accurate data. Caliber mismatches can cause undercounting for low and high flow rates. Smaller engines age quicker when frequently operated at max flow. Bigger engines are less accurate at low flows and have a higher starting flow.
Looking only at monthly reads (refer to Figure 7) only an assessment of the average consumption is possible. With more granular data, peak usages on specific days of the week or specific times of use can be identified. This enables utilities to have a much more accurate assessment of caliber matching. Assuming 3 to 5% of an installed base of around 1 M meters (equals 30k to 50k meters) are not properly matched to the application (e.g. small engine meter running almost all the time at Qmax) and assuming a 5-10% undercounting compared to the right-sized meter on a yearly distributed gas volume of 2 Bn m³, the impact can be calculated at around $167 k per year to $555 k. As the meter charge for bigger calibers is higher, an additional 0.32-0.54% revenue $3.2 M to $5.4 M can be generated.
Figure 6: EMRA rate calculation
When looking at the formula in Figure 6, it seems that it is irrelevant to work on efficiency improvements as operating expenses (OPEX) are recognized in the tariff as well. Itron found out in a specific case analyzed that the allowed annual revenue calculated was very similar for a scenario with more capital expenditure (CAPEX) heavy smart meters going in hand with optimized OPEX as for a less CAPEX intense scenario with more manual OPEX heavy processes. But the impact on the bottom line net income (= Allowed revenue – costs of goods sold – sales, marketing and general expenses) was extensive: depending on the scenario, the net income was double to triple as high for the case with higher automation compared to the lower automation case.
One surprise finding in the analyzed case was that the initial agreement (refer to explanation about privatization process above) was very favorable and that the revenue cap would be reduced by about 50% after the initial period although heavy CAPEX was factored into the period before the official rate was applied. This finding enables the customer to anticipate and prepare for the time ahead requiring the implementation of focused cost avoidance measures.
Supplier dependency, exchange rate exposure
EMRA’s target is to increase the amount of gas imported by privately owned companies to more than 20% and foster competition. This shall be achieved by demanding distribution service companies to obtain less than 50% of their gas from a single source. In practice Botas is still the main source of gas in Turkey as changes are only slowly starting to materialize. Long term gas supply contracts that are often still linked to oil indices are in their nature take or pay contracts. This bears two risks: First, gas market prices have been significantly lower than oil prices (€10-12 per MWh (RWE Aktiengesellschaft, 2012, p. 39)) which constitutes a risk of about USD 288 M for a distribution volume of 2 Bn m³ (€11 / 100 m³ x 1.31 x 2 Bn m³) for long term contracts linked to the price of oil versus gas market prices. Secondly, consumption below 80% of the contracted volume has to be paid regardless if the volumes have been delivered or not. From experience with cases in Latin America where supplier dependency was even lower, Itron could demonstrate that this is a risk of about 3% of the costs of goods sold. So for a utility distributing 2 Bn m³ per year the risk amounts to about USD 26 M.
A better forecasting accuracy supports a stronger negotiation position on supply contracts, especially when market pricing is not linked to the oil index. The basis for proper forecasting is provided by a granular view of what amount of gas is consumed and what amount of gas was injected into the grid. This balancing of input and output is only possible having clear cut-off dates for which consistent sets of data are available across the whole meter park.
Timeliness of readings, outstanding receivables
Why is it difficult to have clear cut-off dates with consistent data? The reason lies within the manual reading process. The essential drawback of manual reads is that no data logging takes place in between each manual read. Thus no consistent set of data across the whole meter park at a defined cut-off date can be achieved. Refer to the left side of Figure 7. As only punctual data is available from the first and second reads and readings for different customers do not take place at the same time, consumption data from last read to cut-off date (green line) has to be estimated. City Gate Customer 1 Customer 2 1stread 2ndread Estimated data City Gate Customer 1 Customer 2 1 2 1stread 2ndread Granular data
Figure 7: Timeliness of readings and clean cut-off date using walk-by smart technology
Besides a potential benefit of reducing labor costs via automation, smart technologies send granular data like last 30 daily index values or more are stored in a smart meter’s or module’s memory, making a clean cut-off possible. Figure 7 on the right side shows an example using a walk-by system. Readings are still taken at defined punctual dates, but in taking the read more granular (e.g. daily) data is collected from the smart meter. Latest at the date marked with “2” in the diagram, a clean cut-off is possible for the date marked “1”.
In some instances the bills can be even printed on site, thus achieving a consistent cut-off date is not relevant from a billing point of view. From both a profit and loss point of view and an accurate forecasting point of view, a detection of losses (technical or apparent) through a clean cut-off is essential. In cases where bill printing is not possible on site (either due to a technological or regulatory point of view), the timeliness of readings become important again, as it reduces read to cash cycle time (refer to Figure 8 time between meter read and bill generation). The timeliness of reading defined as the time it takes from taking the meter read until the data is in the system can be almost instant, for example if the handheld is equipped with a GPRS modem sending data to the head-end over the air. The time frame between “1” and “2” (refer to Figure 7) becomes zero if e.g. smart meters with fixed network architectures are used, that send in daily data.
-150 -100 -50 0 50 100 150 Meter reading Bill sending Receiving of payment Data in the system Post-Payment Meter2Cash
Timeliness of read Outstanding receivables
Figure 8: Meter-to-Cash Cycle: Importance of timeliness of readings and outstanding receivables
Another important aspect to influence the meter-to-cash cycle is the time between sending the bill and the moment the money is received in the bank account – the time of receivables outstanding. For customers that are not on direct debit accounts, this time can be up to 60 days or more and a certain percentage cannot be recovered at all, and are required to be written off as impairment of receivables. For a utility each day of receivables outstanding represents 0.247% of revenue (yearly revenue / 365 days). If the time between meters being read and having the data in the system for bill generation is two days and the average is 45 days of receivables outstanding, the outstanding receivables add up to 12.88% of revenue.
Minimizing these outstanding receivables often generates a one-time cash effect high enough to fund a smart roll-out project without considering other benefits.
Meter rightsizing
Service points differ in consumption depending on the use of gas for cooking-only (low) cooking and hot water (mid) or cooking, hot water and heating (high). Apart from the core usage type, consumption will also differ based on customer segment residential, light commercial, or industrial.
The size of the meter measuring unit needs to be aligned with the main operating range to provide accurate data. Caliber mismatches can cause undercounting for low and high flow rates. Smaller engines age quicker when frequently operated at max flow. Bigger engines are less accurate at low flows and have a higher starting flow.
Looking only at monthly reads (refer to Figure 7) only an assessment of the average consumption is possible. With more granular data, peak usages on specific days of the week or specific times of use can be identified. This enables utilities to have a much more accurate assessment of caliber matching. Assuming 3 to 5% of an installed base of around 1 M meters (equals 30k to 50k meters) are not properly matched to the application (e.g. small engine meter running almost all the time at Qmax) and assuming a 5-10% undercounting compared to the right-sized meter on a yearly distributed gas volume of 2 Bn m³, the impact can be calculated at around $167 k per year to $555 k. As the meter charge for bigger calibers is higher, an additional 0.32-0.54% revenue $3.2 M to $5.4 M can be generated.
Tamper detection
Pipes and metering assets are key to a utility business model. The pipes are needed to transport and distribute the gas and the metering assets make sure that the main revenue and margin source (m³ supplied) get accurately measured. If this baseline is not ensured, all planned investments to improve profitability will fail.
Due to an increase in energy prices and “so called” fuel poverty in many countries, tampering of gas meters in order to get free gas is on the rise. Tamper methods observed by Itron in the field range from metrological seal forging, meter reversal and removal, register clamping and drum blocking with hot wires to more sophisticated methods of magnetic or electromagnetic interference tampering or interval tampering by disconnecting the meter from the grid for a certain period of time.
Preventing tampering through meter design is to a certain degree possible e.g. by using non-magnetic materials or back-run protection in the measuring unit. When prevention is not possible or sufficient, advanced detection mechanisms help to identify gas theft attempts. Smart meters provide the added possibility of taking preventive or corrective action. Detection is possible in a direct manner via advanced sealing mechanisms, alarms provided by smart meters or indirect via data mining on the data collected.
Using smart technologies, the meter can be read remotely without entering the house, rendering an up-front information unnecessary. Due to data logging smart metering solutions can record interval tampering on meter level and a more advanced analysis can be performed on the system level including the evaluation of tamper sensor information, thereby allowing easy detection of even sophisticated tampering behavior.
The losses due to tampering events observed by Itron vary between 4% of unaccounted for gas in developed nations and 7% in developing nations. The impact for a utility assuming conservative 3-5% apparent losses on a yearly residential distribution volume of 1 Bn m³ is a margin effect in the range of $1.7 M to $2.8 M.
5. REFERENCES
[1] Brazilian gas utility, 2012 Annual Report, Sao Paulo: Regulatory and Institutional Affairs, 2012.
[2] Giordano, V. et al., JRC Reference Reports - Guidelines for conducting a cost-benefit analysis of smart grid projects, Luxembourg: Publications Office of the European Union, 2012.
[3] Kunreuther, M.-K. a. U. Global Risks Report. Risk Management. 2014.
[4] Perrin, L.-M. & Chosson, C.-E. Mapping power and utilities regulation in Europe, s.l.: EYGM Limited, 2013.
[5] RWE Aktiengesellschaft, Annual Report 2012, Bad Oeynhausen: Kunst- und Werbedruck, 2012.
AKILLI ŞEHİRLERDE CBS İLE ALTYAPI YÖNETİMİ
SMART CITIES INFRASTRUCTURE MANAGEMENT WITH GIS
Mustafa Yalçınkaya
1, Gönül Yıldız
2,Ahmet Fatih Hameş
31İGDAŞ Altyapı Bilgi Sistemleri Müdürlüğü,Kavacık,İSTANBUL, [email protected] 2İGDAŞ Altyapı Bilgi Sistemleri Müdürlüğü,İGABİS Proje Şefliği,Kavacık,İSTANBUL, [email protected] 3İGDAŞ Altyapı Bilgi Sistemleri Müdürlüğü,İGABİS Proje Şefliği,Kavacık,İSTANBUL, [email protected]
ÖZET
Bilgi ve bilişim teknolojilerinde meydana gelen hızlı gelişmelerle birlikte günümüz şartlarında kamu kurumları ve özel şirketler; mevcut varlıklarının tespiti, analizi, sunumu ve paylaşımı konularında Coğrafi Bilgi Sistemleri (CBS) tabanlı projelere yatırım yapmaktadırlar. Ve bu projelerle bilgiye daha hızlı ulaşarak daha akıllı karar vermek ve daha etkili stratejiler üretme ihtiyacı duymaktadırlar. Yatırım planlama aşamasından son kullanıcıya varıncaya kadar her bir evrede CBS teknolojilerinin kullanımı, kurumlara etkin bir süreç yönetimi imkânı sağlayacak, doğru veriler ile sistemli bir şekilde doğru kararlar alınmasında yardımcı olacaktır.
Metropol kentlerde nüfus artışının sebep olduğu hızlı kentleşme ile altyapı problemleri karmaşık hale gelmiştir. Hızla artan nüfusu, kültürel, ticari ve sanayi yapısıyla Türkiye’nin en büyük kenti olan İstanbul’a doğalgaz hizmeti ve işletmesini sunmak belli sorumlulukları beraberinde getirmektedir. İstanbul Gaz Dağıtım Anonim Şirketi (İGDAŞ) ‘ın altyapı ve üstyapı yatırımlarının ve doğalgaz şebekelerine ait tüm enstrümanların sağlıklı bir şekilde yönetilmesi için; bu enstrümanların konumsal ve öznitelik verilerin toplanıp, saklandığı ve analizlerinin yapılıp son kullanıcılara ulaştığı akıllı bir sistemin kurulmasını zorunlu kılmaktadır. İGDAŞ Altyapı Bilgi Sistemleri (İGABİS)’in doğalgaz varlıklarının yönetilmesinde Coğrafi Bilgi Sistemleri(CBS) uygulamalarının sağladığı akıllı çözümlerin sektöre kazanımları bu çalışmada anlatılacaktır.
Anahtar Sözcükler: Coğrafi Bilgi Sistemleri(CBS), Varlık Yönetimi, Akıllı Altyapılar
ABSTRACT
With rapid developments in information technologies, public institutions and private companies need to invest in Geographical Information Systems (GIS)-based projects for the determination, analysis, presentation and sharing of their existing assets, to take decisions more quickly by gaining faster access to information with these projects and to draw up smarter strategies. In each stage from investment stage to reaching the end user, the use of GIS technologies will provide institutions with an efficient process management and help correct decision-making systematically with accurate data. Infrastructure problems have become more complex with irregular urbanization due to population increase in metropolitans. Providing natural gas service and operation to Istanbul –Turkey's largest city with its population around 15 million people and cultural, commercial and industrial
management of infrastructure and superstructure investments of Istanbul Gas Distribution Company (IGDAS) as well as all instruments related to natural gas networks, it is compulsory to establish a system to collect and analyse positional and qualitative data of these instruments and communicate the same to end users. This study focuses on sectoral acquisitions of convenience provided by Geographical Information Systems (GIS) applications.
Keywords: Geographical Information Systems (GIS), Asset Management, Infrastructure