* Corresponding Author
Received: 10 July 2018 Accepted: 27 May 2019
Experimental and Modeling Investigation of Mass Transfer during Infrared Drying of Kumquat Slices
İlknur KÜÇÜK* and İbrahim DOYMAZ
Yıldız Technical University, Faculty of Chemical and Metallurgical Engineering, Department of Chemical Engineering, 34220, İstanbul, Türkiye
[email protected] , ORCID Address: http://orcid.org/0000-0001-9203-0693
[email protected] , ORCID Address: http://orcid.org/0000-0002-4429-6443
Abstract
In this work, mass transfer of kumquat slices was investigated during infrared drying. The effect of the infrared radiation power (50-88 W) on the drying characteristics of the kumquat slices was evaluated as the drying parameter. It was determined that the infrared power affected the drying and colour characteristics of kumquat slices and drying time decreased with increased infrared power. Five different mathematical models were evaluated for moisture ratios using nonlinear regression analysis. The results of regression analysis indicated that the Midilli & Kucuk model is the best model to describe the drying behaviour with the lowest 2 and RMSE values and highest R2 values. The effective moisture diffusivity at each infrared power was determined by Fick’s second law of diffusion, an increase in the power led to increase in the effective moisture diffusivity between 8.31×10⁻⁹ and 1.89×10⁻⁸ m2/s. The dependence of effective moisture diffusivity on infrared power was expressed by a modified Arrhenius type equation. Activation energy was estimated by a modified Arrhenius type equation as 1.92 kW/kg. A positive effect was observed on the ΔE with increasing in infrared power and with rising in infrared radiation power it was
dergipark.org.tr/adyusci 9 (1) (2019)
decreased. Whereas, it was observed that the chroma values increased with rising in infrared radiation power.
Keywords: Activation energy, Effective moisture diffusivity, Kumquat, Infrared
drying.
Kızılötesi Kurutma Sırasında Kumkuat Dilimlerinin Kütle Transferinin Deneysel ve Modelleme İncelemesi
Özet
Bu çalışmada, kızılötesi kurutma sırasında kumkuat dilimlerinin kütle transferi araştırılmıştır. Kurutma parametresi olarak kızılötesi radyasyon gücünün (50-88 W) kumkuat dilimlerinin kurutma karakteristiği üzerindeki etkisi değerlendirilmiştir. Kızılötesi gücün, kumkuat dilimlerinin kurumasını ve renk özelliklerini etkilediği ve kuruma süresinin artan kızılötesi güç ile azaldığı belirlenmiştir. Doğrusal olmayan regresyon analizi kullanılarak beş farklı matematiksel model nem oranları için değerlendirilmiştir. Regresyon analiz sonuçları Midilli & Kucuk modelinin en düşük 2 ve RMSE değerleri ve en yüksek R2 değerleri ile kurutma davranışını tanımlayan en iyi model olduğunu göstermiştir. Her bir kızılötesi güçteki efektif nem difüzyonu, Fick’in ikinci difüzyon yasası ile belirlenmiştir, güçteki artış efektif nem difüzyonunda 8.31×10⁻⁹ ve 1.89 10−8 m2/s arasında artışa yol açmıştır. Efektif nem difüzyonun kızılötesi güçe bağımlılığı modifiye bir Arrhenius tipi denklem ile ifade edilmiştir. Aktivasyon enerjisi modifiye Arrhenius tipi denklem ile 1.92 kW/kg olarak hesaplanmıştır. Kızılötesi güçteki artma ile ΔE'de pozitif bir etki gözlemlenmiş ve kızılötesi radyasyon gücündeki yükselme ile bu etki azalmıştır. Bununla birlikte kızılötesi radyasyon gücündeki yükselmenin chroma değerlerini artırdığı gözlenmiştir.
Anahtar Kelimeler: Aktivasyon enerjisi, Efektif nem difüzyonu, Kumkuat, Kızılötesi kurutma.
1. Introduction
Kumquats which is the smallest of the citrus fruits, are an excellent source of nutrients and phytochemicals including flavonoids, vitamins, carotenoids, and terpenoids, with a marked antioxidant activity [1]. As in the other citrus species, in kumquat essential oils are greatly accumulated in the oil glands of the peel. Owing to their health benefits, they are traditionally used as folk medicine in Asian countries. However, rather than being important as a source of raw material for applications in pharmaceutical, sanitary, cosmetic, agricultural and food industries, kumquats play a very important role for the flavor and taste conferred the fruit as well as for their healthy properties, as they are consumed as a whole, including their peel. Kumquats that is native to south-eastern China spread, not just in Asia and in Japan but also in Argentina, Brazil, USA, in the Mediterranean region [2].
The postharvest shelf life of kumquat fruit is relatively short due to the effect of Penicillium, which result in high levels of decay. Also, unlike other citrus fruits, its thin, edible peels don't protect them as well as the thicker peels of oranges or lemon and kumquats don't have a long shelf life. Therefore, kumquat must be subjected to some form of preservation such as liqueurs, marmalades, sauces and it can be candied or preserved whole in sugar syrup. Drying can make the product available throughout the year at reasonable cost. Dried whole kumquats are often used to cure inflammatory syndromes of respiratory tract, such as coughing, hoarseness and sore throats [2-3].
Drying is a traditional or industrial preservation method that is used in the food industry. The drying process is intended to remove water from foodstuff to prevent microbial spoilage and chemical alterations, thus prolonging shelf-life while realizing space and weight savings. This process generally involves removal of water by application of heat. Improper drying may lead to irreversible damages to product quality, high energy and time consumption, unseasonable charges, etc. [4]. Drying of agricultural products can be performed using different methods, including traditional and industrial drying. Infrared drying has gained popularity as an alternative drying method for obtaining high quality dried fruits, vegetables and grains [5].
Infrared drying has gained popularity as an alternative drying method for agricultural products. When infrared radiation is used to warm up or dry moist materials, it penetrates into them and the energy of radiation converts into heat [5]. Compared with hot air drying, infrared radiation heating offers many advantages such as greater energy efficiency, heat transfer rate, and heat flux, which results in reduced drying time and higher drying rate. Some of agricultural products have been successfully dried by the infrared application and/or by a combined infrared-assisted convection process and others [6-8]. However, the infrared drying process of kumquat has not been reported in literature. The main objectives of this study were to investigate the effect of infrared power on drying and color characteristics, fit the experimental data to five thin-layer drying models, and compute effective moisture diffusivity and activation energy of kumquat slices. Please write subtitles and their contents of your manuscript here.
2. Material and Methods
Kumquat samples were obtained from a local market in Antalya. They were packed into plastic bags and stored in a refrigerator at 4°C prior to use. The initial moisture content of kumquats was determined by using an oven at 105°C for 24 h. Triplicate samples were used for the determination of moisture content and the average values were reported as 81.50 %, w.b. (4.405 kg water/kg dry matter, d.b.).
Drying experiments were carried out in a moisture analyzer (Snijders Moisture Balance). The experiments were carried out using several infrared power levels such as 50, 62, 74 and 88 W. Before the drying process, the samples were separated evenly and spread homogeneously over the pan. The power level was set from the control unit of the equipment. Approximately 50 g of sample, the half thickness (L) of a layer was about 13.25 mm, was put into the dryer after weighing. Moisture loss was recorded at 30 min intervals during drying. A digital balance (Mettler-Toledo AG) with 0.1 g accuracy was employed in recording the sample weight. Drying was continued until the sample weight attained a constant value. The drying process was continued until the moisture content remaining in the sample was about 0.425±0.02 kg water/kg dry matter (d.b.). The dried products were cooled, packaged in low-density polyethylene bags and
stored in incubators at ambient temperature. The experiments were run in triplicate and the drying curves were plotted using the average values of the moisture content.
2.1 Mathematical Modelling
Five semi-theoretical models were selected to describe the drying kinetics of the samples (Table 1).
Table 1. Mathematical models applied to the drying curves
Model name Model Reference
Lewis MRexp(kt) El-Beltagy et al. [9] Henderson & Pabis MRaexp(kt) Erbay and Icier [10] Logarithmic MRaexp(kt)c Afolabi et al. [11]
Page MRexp(ktn ) Falade and Ogunwolu [12] Midilli & Kucuk MRaexp(ktn )bt Midilli and Kucuk [13]
a, b, c, k and n empirical constants and coefficients in the drying models
The moisture content (M), moisture ratio (MR) and drying rate (DR) of kumquats were calculated using the following equations:
1 1 W W W M (2.1) e e t M M M M MR 0 (2.2) dt M M DR t tdt (2.3)
where M is the moisture content (kg water/kg dry matter), W is the weight of sample (kg), W1 is the dry matter content of sample (kg), and t is the drying time (min). M0, Me, Mt and Mt+dt are the initial moisture content, the equilibrium moisture content, the
moisture content at t and t+dt (kg water/kg dry matter), respectively. As the Me is very small compared to M0 and Mt values, the Me can be neglected and MR can be expressed as Mt/M0 [7].
2.2 Data Analysis
Experimental data were analyzed using the Statistica 8.0.550 (StatSoft Inc., USA) software package. The parameters of the models were estimated using a non-linear regression procedure based on the Levenberg-Marquardt algorithm. The fitting quality of the experimental data to all models was evaluated using the coefficient of determination (R2), reduced chi-square (2) and root mean square error (RMSE). The R2, 2 and RMSE were calculated from the following formulas:
N i i pre N i prei i MR MR MR MR R 1 2 exp, 1 2 exp, , 2 1 (2.4)
z N MR MR N 1 i 2 i, pre i exp, 2
(2.5) 2 / 1 N 1 i 2 i exp, i, pre MR ) MR ( N 1 RMSE
(2.6)where MRexp,i and MRpre,i are the experimental and predicted dimensionless moisture ratios, respectively; N is the number of observations; z is the number of constants. A higher R2 value and lower 2 and RMSE values indicate a better fit [14].
2.3 Calculation of Effective Moisture Diffusivity
Fick’s second law of diffusion equation was used to fit the experimental drying data for the determination of effective moisture diffusivity coefficients.
2 2 x M D t M eff (2.7) where M is the moisture content (kg water/kg dry matter), t is the drying time (s), and Deff is the effective moisture diffusivity (m2/s). The solution of diffusion Eq. (2.7) for slab geometry is solved by Crank [15] and supposed uniform initial moisture distribution, negligible external resistance, constant temperature and diffusivity, and negligible shrinkage:
0 2 2 2 2 2 4 1 2 1 2 1 8 n eff L t D n exp n MR (2.8)where Deff is the effective moisture diffusivity (m2/s), L is the half thickness of the slab (m), and n is the positive integer. Eq. (2.8) can be further simplified to only the first term of the series and expressed in a logarithmic form for long drying periods:
2 2 2 4 8 L t D ln MR ln eff (2.9)The effective moisture diffusivity was calculated from the slope (K) of a straight line, plotting experimental drying data in terms of ln (MR) versus time according to Eq. (2.9). 2 2 4L D K eff (2.10)
2.4 Estimation of Activation Energy
Temperature was not a directly measurable quantity during the infrared power drying process used in this study. For the calculation of activation energy, modified form of Arrhenius equation shows the relationship between the effective moisture diffusivity and the infrared power to sample weight [16].
p m Ea exp D Deff 0 (2.11)
where D0 is the pre-exponential factor of Arrhenius equation (m2/s), Ea is the activation energy (W/kg), p is the infrared output power (W), and m is the mass of the product (kg).
2.5 Colour
The colour values of the fresh and dried samples, at between 50 and 88 W powers, were evaluated using a hand-held tristimulus colorimeter (Chroma Meter-CR-400). The colour brightness coordinate L measures the whiteness value of a colour and ranges from black at 0 to white at 100. The chromaticity coordinate a measures red when positive and green when negative, and the chromaticity coordinate b measures yellow when positive and blue when negative. For the colour determinations, five measurements were done, and the corresponding average and standard deviation were calculated for each set of kumquat slices, fresh and dried at each infrared power. The Chroma and total color differences (E) calculated using Equations. (2.12) and (2.13), respectively: 2 2 b a C (2.12) 2 2 2 ) b ( ) a ( ) L ( E (2.13)
3. Results and Discussion 3.1 Analysis of Drying Curves
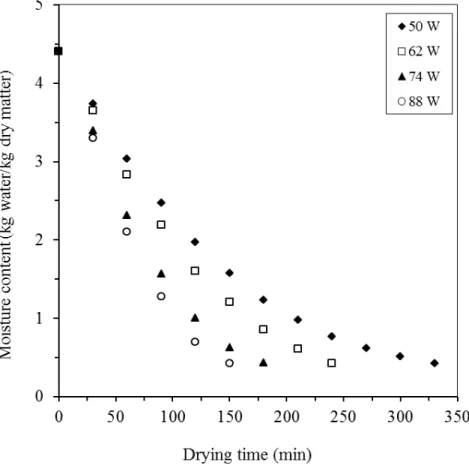
The effect of infrared power on moisture content and drying time is shown in Figure 1. The infrared power had a significant effect on the moisture content of the kumquat slices, as expected. It is observed that in infrared drying, an increase in the power level resulted in a decrease at drying time where the required time to reach the final moisture content at the power levels of 50, 62, 74 and 88 W, were about 330, 240, 180 and 150 min, respectively. The average drying rates increased 2.2 times as infrared power increased from 50 W to 88 W. In fact, at higher infrared powers, more heat is generated within the material leading to more vapour pressure differences between the
centre and surface of the product and consequently, increases the drying rate. This observation agree well with the results reported in the literature for infrared drying of different products such as lemon [17], red pepper [18], and spinach leaves [19].
Figure 1. Moisture content during drying time at different infrared powers
3.2 Drying Rate
The drying rate curves of kumquat slices are shown in Figure 2. It is clear that the drying rate decreases continuously with moisture content. The drying rates were higher in the beginning of the process, and then decreased with a decrease in moisture content of the samples. The reason for the decrease in drying rate might be due to a reduction in the porosity of samples caused by shrinkage with advancement, which increased the resistance to movement of water leading to further fall in drying rates [20]. This observation is in agreement with previous studies on infrared drying of foodstuffs [21,22]. In all cases constant drying rate period was not observed and therefore the
drying process occurred in the falling drying rate period. These results are in good agreement with those in earlier studies of various vegetables [17,19,23].
Figure 2. Drying rate as a function of moisture content at different infrared powers
3.3 Evaluation of Models
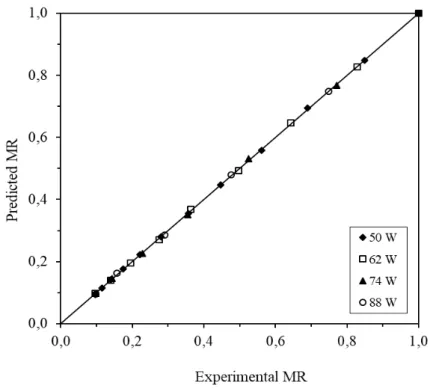
The moisture content data obtained from the drying experiments were fitted five thin-layer drying models identified in Table 1. The best model selected is based on the highest R2 and the lowest 2 and RMSE values. Results of the statistical computing are shown in Table 2. The R2 values for all models were above 0.98. Among the five thin-layer drying models tested, Midilli & Kucuk model obtained the highest R2 values and the lowest 2 and RMSE values in all the infrared drying conditions studied. It is clear that, the R2, 2 and RMSE values of this model were changed between 0.9998-0.9999, 0.000007-0.000038 and 0.006209-0.007845, respectively. Figure 3 compares experimental data with those predicted with the Midilli & Kucuk model for kumquat slices. As shown, the predicted moisture ratios are generally banded near to a 45° straight line, indicating the capability of the model to describe the drying behaviour of the samples appropriately.
Figure 3. Experimentally determined and predicted moisture ratios of kumquats Table 2. Statistical parameters of models at different infrared powers
Model name p (W) R2 2 RMSE
Lewis 50 62 74 88 0.9963 0.9900 0.9897 0.9834 0.000333 0.001010 0.001169 0.002075 0.049828 0.074413 0.065288 0.081637 Henderson & Pabis 50
62 74 88 0.9976 0.9927 0.9918 0.9860 0.000234 0.000842 0.001115 0.002184 0.041752 0.068283 0.065985 0.084516 Logarithmic 50 62 74 88 0.9986 0.9984 0.9970 0.9957 0.000148 0.000204 0.000507 0.000892 0.032412 0.029955 0.038245 0.046874 Page 50 62 74 88 0.9972 0.9998 0.9997 0.9997 0.000027 0.000015 0.000036 0.000040 0.012611 0.007621 0.009957 0.010425 Midilli & Kucuk 62
74 88 104 0.9999 0.9999 0.9998 0.9998 0.000007 0.000013 0.000028 0.000038 0.006209 0.006840 0.007845 0.006930
3.4 Effective Moisture Diffusivity and Activation Energy
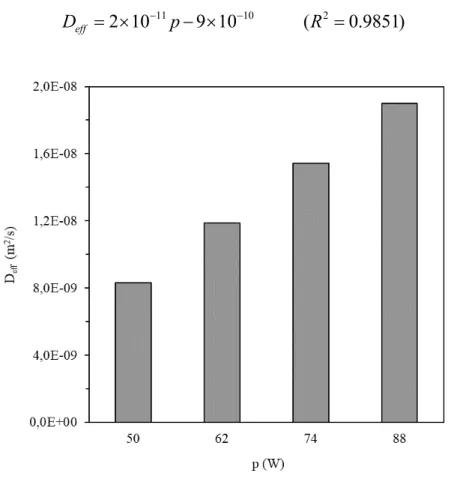
By plotting ln (MR) against drying time (Figure 4) and using the slope methods the effective moisture diffusivity of the samples was calculated under different drying conditions. The values of effective diffusivity (Deff) were calculated by using Eq. (3.2) and are shown in Figure 5. The Deff values of kumquat slices in the infrared drying at 50-88 W varied between 8.31×10⁻⁹ and 1.89×10⁻⁸ m2/s. It can be seen that Deff values increased greatly with increasing infrared power. Drying at 88 W has the highest value of Deff and the lowest value was obtained for 50 W. The values of Deff from this study lie within in general range 10-12 to 10-8 m2/s for drying of food materials [24]. The effect of infrared power on effective diffusivity is defined by the following equation:
11 10 2
2 10 9 10 ( 0.9851)
eff
D p R (3.1)
Figure 4. Variation of effective moisture diffusivity with infrared powers
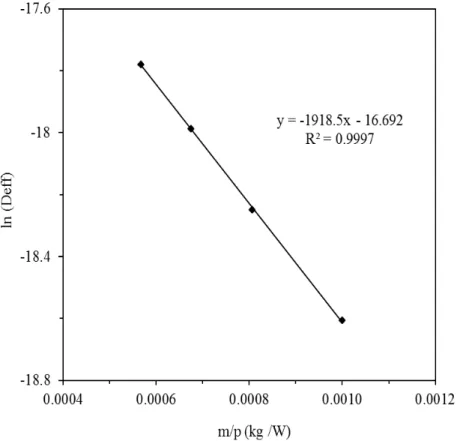
The activation energy can be determined from the slope of Arrhenius plot, ln (Deff) versus m/p (Eq. (3.2)). The ln (Deff) as a function of the sample weight/infrared power was plotted in Figure 5. The slope of the line is (-Ea) and the intercept equals to ln (D0). The results show a linear relationship due to Arrhenius type dependence. Eq.
(3.2) shows the effect of sample weight/infrared power on Deff of samples with the following coefficients: 9 2 eff 6746.1 m D 8.022 10 exp ( 0.9775) p R (3.2)
The estimated values of D0 and Ea from modified Arrhenius type exponential Eq. (2.11) are 5.633×10⁻⁸ m2/s and 1.92 kW/kg, respectively
Figure 5. Arrhenius-type relationship between effective moisture diffusivity and infrared powers
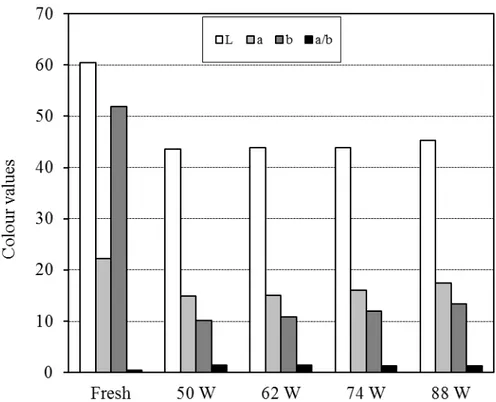
3.5 Colour Evaluation
Colour has to be considered as a special parameter that seems to be one of the most important criteria determining product quality and consumer preference. The average values for the colour parameters of fresh kumquat slices were as follows: L= 60.49, a= 22.24, and b= 51.88. The colour parameters of dried samples are presented in Figure 6. and Table 3. It can be seen that the entire dried kumquat slices had lower
values of L than the fresh samples. The L values which show lightness of product were ranged between 43.60 and 45.22. The lowest L value evaluated for dried product at 50 W. The decrease in L values might be caused by browning reactions [25]. It can be clearly seen from the Table 3, the values of an increased as the power output increased. Therefore, the samples tended toward greater redness values with the progressing drying time. On the other hand, the creation of brown pigments in the effect of non-enzymatic processes (Maillard reaction) during drying process might play an important role in the production of red colour [26]. The values of b were increased with increasing of power output, indicating dried samples were yellower at high power output (high temperature). The chroma is measure of chromaticity (C), which denotes the purity or saturation of the colour. The chroma (C) values showed an increase during process. Chroma (C) values varied from 18.08 to 21.93 at different infrared powers. Whereas, with increasing in infrared power from 50 to 88 W, ΔE was decreased from 45.62 to 41.71, respectively.
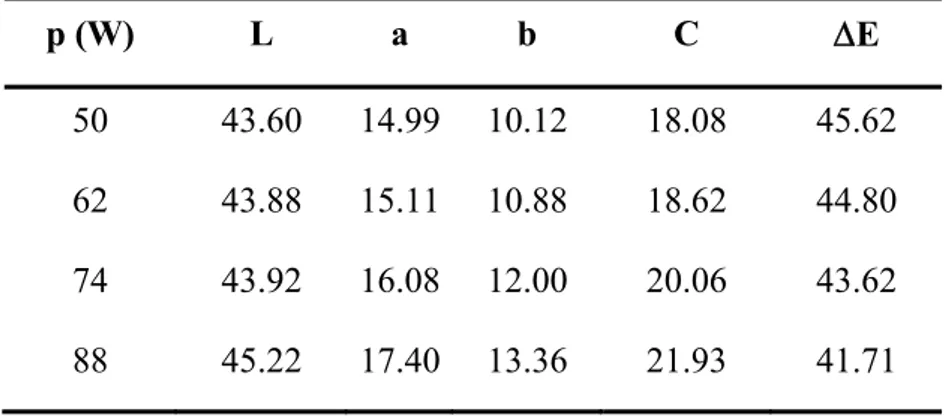
Table 3. Results of colour values for kumquat slices
p (W) L a b C E
50 43.60 14.99 10.12 18.08 45.62
62 43.88 15.11 10.88 18.62 44.80
74 43.92 16.08 12.00 20.06 43.62
Figure 6. Colour values of kumquat slices fresh and dried at various infrared powers
4. Conclusions
In this study, infrared drying of kumquat slices is presented. Drying time decreased considerably with increase in infrared power. The drying was observed to take place entirely in the falling rate drying period and hence moisture migration to the surface is based on diffusion. To explain the drying kinetics of kumquats, five drying models were applied and fitted to the experimental data. According to the results of statistical analysis, the experimental data were well predicted by the Midilli and Kucuk model. The effective moisture diffusivity varied between 8.31×10⁻⁹ and 1.89×10⁻⁸ m2/s and increased as infrared power increased. Activation energy was estimated by a modified Arrhenius type equation and found to be 1.92 kW/kg. The colour values of L, a, b and C increased while those of ΔE decreased as the power output increased.
References
[1] Lou, S. N., Lai, Y. C., Huang, J. D., Ho, C. T., Ferng, L. A. and Chang, Y. C.,
Drying Effect on Flavonoid Composition and Antioxidant Activity of Immature Kumquat, Food Chemistry, 171, 356-363, 2015.
[2] Rodrigues, S., Silva, E. O. and Brito, E., Exotic Fruits, Academic Press, Elsevier, London, 2018.
[3] Loy, S. N. and Ho, C. T., Phenolic Compounds and Biological Activities of Small-Size Citrus: Kumquat and Calamondin, J. Food Drug Anal., 25, 162-175, 2017.
[4] Torki-Harchegani, M., Ghanbarian, D., Pirbalouti, A. G. and Sadeghi, M.,
Dehydration Behaviour, Mathematical Modelling, Energy Efficiency and Essential Oil Yield of Peppermint Leaves Undergoing Microwave and Hot Air Treatments,
Renewable Sustainable Energy Rev., 58, 407-418, 2016.
[5] Touil, A., Chemkhi, A. and Zagrouba, F., Moisture Diffusivity and Shrinkage of Fruit and Cladode of Opuntia Ficus-Indica During Infrared Drying, J. Food
Process., 2014, 1-9, 2014.
[6] Ertekin, C. and Heybeli, N., Thin-layer Infrared Drying of Mint Leaves, J.
Food Process. Preserv., 38, 1480-1490, 2014.
[7] Alaei, B. and Chayjan, R. A., Modeling of Nectarine Drying Under Near Infrared-Vacuum Conditions, Acta Sci. Pol. Technol. Aliment., 14(1), 15-27, 2015.
[8] Doymaz, I., Infrared Drying Chracteristics of Bean Seeds, J. Food Process.
Preserv., 39, 933-939, 2015.
[9] El-Beltagy, A., Gamea, G. R. and Essa, A. H. A., Solar Drying Characteristics of Strawberry, J. Food Eng., 78, 456-464, 2007.
[10] Erbay, Z. and Icier, F., Thin-layer Drying Behaviours of Olive Leaves (Olea Europaea L.), J. Food Process Eng., 33, 287-308, 2010.
[11] Afolabi, T. J., Tunde-Akintunde, T. Y. and Adeyanju, J. A., Mathematical Modeling of Drying Kinetics of Untreated and Pretreated Cocoyam Slices, J. Food Sci.
Technol., 52, 2731-2740, 2015.
[12] Falade, K. O. and Ogunwolu, O. S., Modeling of Drying Patterns of Fresh and Osmotically Pretreated Cooking Banana and Plantain Slices, J. Food Process.
Preserv., 38, 373-388, 2014.
[13] Midilli, A. and Kucuk, H., Mathematical Modeling of Thin Layer Drying of Pistachio by Using Solar Energy, Energy Convers. Manage., 44, 1111-1122, 2003.
[14] Chayjan, R. A., Salari, K., Abedi, Q. and Sabziparvar, A. A., Modeling Moisture Diffusivity, Activation Energy and Specific Energy Consumption of Squash Seeds in a Semi Fluidized and Fluidized Bed Drying, J. Food Sci. Technol., 50,
667-677, 2013.
[15] Crank, J., The Mathematics of Diffusion, Oxford University Press, London, 1975.
[16] Darvishi, H., Quality, Performance Analysis, Mass Transfer Parameters and Modeling of Drying Kinetics of Soybean, Braz. J. Chem. Eng., 34, 143-158, 2017.
[17] Saghazi, A. A., Yousefi, A. R. and Salari, A., Mathematical Modeling of The Kinetics of Thin-Layer Infrared Drying of Lemon, Jordan J. Agric. Sci., 13, 663-674,
2017.
[18] Nasiroglu, S. and Kocabiyik, H., Thin-Layer Infrared Radiation Drying of Red Pepper Slices, J. Food Process Eng., 32, 1-16, 2009.
[19] Sarimeseli, A. and Yuceer, M., Investigation of Infrared Drying Behaviour of Spinach Leaves Using ANN Methodology and Dried Product Quality, Chem. Process
[20] Singh, B., Panesar, P. S. and Nanda, V., Utilization of Carrot Pomace for the Preparation of a Value Added Product, World Journal of Dairy and Food Science, 1,
22-27, 2006.
[21] Vega-Gálvez, A., Miranda, M., Díaz, L. P., Lopez, L., Rodriguez, K. and Di Scala, K., Effective Moisture Diffusivity Determination and Mathematical Modelling of the Drying Curves of the Olive-Waste Cake, Bioresour. Technol., 101, 7265-7270,
2010.
[22] Abano, E. E., Ma, H. L. and Qu, W., Thin-Layer Catalytic Far-Infrared Radiation Flavour of Tomato Slices, J. Agric. Eng., 45, 37-45, 2014.
[23] Shi, J., Pan, Z., Mchugh, T. H., Wood, D., Hirschberg, E. and Olson, D.,
Drying and Quality Characteristics of Fresh and Sugar-Infused Blueberries Dries with Infrared Radiation Heating, LWT Food Sci. Technol., 41, 1962-1972, 2008.
[24] Zogzas, N. P., Maroulis, Z. B. and Marinos-Kouris, D., Moisture Diffusivity Data Compilation in Foodstuffs, Drying Technol., 14, 2225-2253, 1996.
[25] Ju, H. Y., El-Mashad, H. M., Fang, X. M., Pan, Z., Xiao, H. W., Liu, Y. H. and Gao, Z. J., Drying Characteristics and Modeling of Yam Slices Under Different Relative Humidity Conditions, Drying Technol., 34, 296-306, 2016.
[26] Vega-Galvez, A., Scala, K. D., Rodriguez, K., Lemus-Mondaca, R., Miranda, M., Lopez, J. and Perez-Won, M., Effect of Air-Drying Temperature on Physico-Chemical Properties, Antioxidant Capacity, Color and Total Phenolic Content of Red Pepper (Capsicum annuum L. var. Hungarian), Food Chemistry 117(4), 647-653, 2009.