doi:10.3906/biy-1202-43
Genetic characterization of Turkish bread wheat landraces
based on microsatellite markers and morphological characters
Özlem ATEŞ SÖNMEZOĞLU1, Betül BOZMAZ2, Ahmet YILDIRIM1, Nejdet KANDEMİR2, Nevzat AYDIN3
1
Department of Biology, Kamil Özdağ Faculty of Science, Karamanoğlu Mehmetbey University, 70100 Karaman - TURKEY
2
Department of Field Crops, Faculty of Agriculture, Gaziosmanpaşa University, 60100 Tokat - TURKEY
3
Department of Bioengineering, Faculty of Engineering, Karamanoğlu Mehmetbey University, 70100 Karaman - TURKEY
Received: 23.02.2012 ● Accepted: 15.05.2012
Abstract: Wheat landraces could be unique sources of favorable genes for agronomic traits like yield and insect, pest, and disease resistances, as well as quality characteristics that are important for breeding programs. Molecular marker systems off er great opportunities to characterize wheat accessions, which in particular are not morphologically identifi able. In this study, 20 bread wheat landraces collected from diff erent regions of Turkey were characterized by using microsatellite markers (SSRs) and morphological characters. Seventeen morphological characters were used. Fift een SSR primers were prescreened and the 7 most polymorphic primers were employed in characterization. Th e most polymorphic SSR loci were Xgwm 95 and 295 with 11 alleles, followed by Xgwm 261 and 325 with 9 alleles. Th e total number of alleles was 63, with an average number of 9 alleles. Th e dendrogram showed that the bread wheat landraces can be divided into 2 major groups. Based on matrix values, the closest genotypes of landraces were TR 63445 and TR 63886 for molecular data, and TR 37179 and TR 46797 for morphological data. On the other hand, the most genetically diff erent genotypes were TR 37179 and TR 3608 in the SSR analysis, and TR 14851 and TR 3608 in the morphological characterization. Th ese results showed that SSR markers and morphological characters could be successfully used in genetic characterization and genetic diversity in bread wheat landraces that may be useful for wheat breeding programs as genetic resources.
Key words: Bread wheat, genetic diversity, landraces, microsatellite markers, morphological characters, Triticum
aestivum
Introduction
Wheat is one of the most important crops in the world because of its nutritional value and important role in daily energy intake. World wheat production is almost entirely based on 2 species, common or bread wheat (Triticum aestivum L.), which accounts for about 90% of world production, and macaroni or durum wheat (Triticum turgidum subsp. durum),
which accounts for the remaining 10% of wheat production (1).
Th ere are several diff erent genetic resources for wheat improvement. Among those, landraces have been the preferred ones due to their ease of crossing and their usual lack of dangerous linkage drags. Th ey are genetically homozygous but usually heterogeneous because of nonintense selections by
local growers. Th e characterization of landraces is crucial for exploiting the genetic variability for traits such as grain quality and resistance or tolerance to biotic and abiotic stresses. Diversity in genetic resources can be identifi ed by several methods such as morphological, biochemical, or molecular screening. Morphological traits have been studied for the determination of genetic diversity and selection criteria in wheat breeding (2-6). Th e disadvantages of morphological characterizations are their low polymorphism, heritability, and sensitivity to changes in environmental conditions. Morphological characters are also oft en limited in number and may be controlled by epistatic and pleiotropic gene eff ects (5). Th us, these characters may not adequately represent the genetic diversity among genotypes.
Molecular genetic markers have proven to be a valuable tool for identifying landraces containing genes that are frequently masked by undesirable phenotypes. Microsatellites are one of the most promising molecular marker types for screening of a genetic stock. Simple sequence repeats (SSRs) have many advantages over other markers such as ease of analysis, abundance, codominance, high reproducibility, and user friendliness (7-9). SSR markers are highly polymorphic in wheat (7). Th e genetic diversity studies in bread wheat (10-12) and its landraces (13,14) have been characterized by using SSR markers. Detection of genetic variation
and determination of genetic relationships between wheat individuals and populations are important considerations for the effi cient conservation and utilization of plant genetic resources (15).
Th e aim of this study was to screen some Turkish bread wheat landraces collected from highly diverse ecological regions in order to determine genetic variability and relationship by using SSRs and morphological characters.
Materials and methods Plant materials
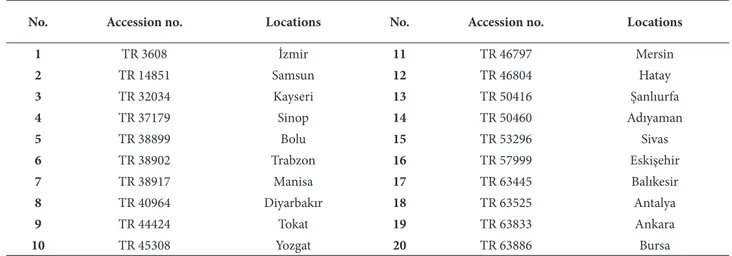
In this study, 20 bread wheat landraces were characterized by using SSR microsatellite markers and morphological characters. Accession numbers and locations of the collected landraces are illustrated in Table 1. Th e bread wheat landraces (Triticum
aestivum L.) were kindly provided by the Gene Bank
Department of the Aegean Agricultural Research Institute, İzmir, Turkey. Additionally, a Mexican wheat variety, Opata 85, was used as a reference plant variety in molecular characterization. Th e geographic distribution of the 20 bread wheat landraces is shown in Figure 1.
Evaluation of morphological characters
Ten accessions from each bread wheat landrace (a total of 200 genomes) were subjected to morphological observations. Th e data obtained by
Table 1. Th e accession numbers and locations of landraces collected from diff erent regions of Turkey.*
No. Accession no. Locations No. Accession no. Locations
1 TR 3608 İzmir 11 TR 46797 Mersin 2 TR 14851 Samsun 12 TR 46804 Hatay 3 TR 32034 Kayseri 13 TR 50416 Şanlıurfa 4 TR 37179 Sinop 14 TR 50460 Adıyaman 5 TR 38899 Bolu 15 TR 53296 Sivas 6 TR 38902 Trabzon 16 TR 57999 Eskişehir 7 TR 38917 Manisa 17 TR 63445 Balıkesir 8 TR 40964 Diyarbakır 18 TR 63525 Antalya 9 TR 44424 Tokat 19 TR 63833 Ankara 10 TR 45308 Yozgat 20 TR 63886 Bursa
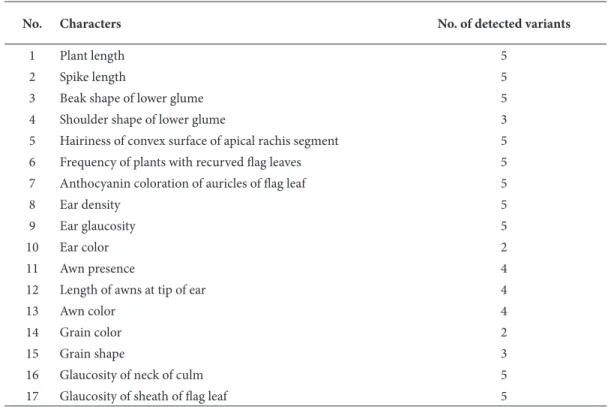
combining 10 accessions from each landrace were analyzed. Plants were grown in a greenhouse and distributed randomly to minimize the environmental eff ects. Data were recorded for 17 morphological characters of randomly selected plants, as follows: plant height, spike length, beak shape of lower glume, shoulder shape of lower glume, hairiness of convex surface of apical rachis segment, frequency of plants with recurved fl ag leaves, anthocyanin coloration of auricles of fl ag leaf, glaucosity of sheath of fl ag leaf, ear density, ear glaucosity, ear color, awn presence, length of awns at tip of ear, awn color, grain color, grain shape, and glaucosity of neck of culm (Table 2). Th e genetic distance matrix was computed by using JMP soft ware (5.0.1a, SAS Institute, 1989-2002). A dendrogram was constructed by clustering the matrix using the unweighted pair group method with arithmetic mean (UPGMA) by use of JMP 5.0.1a soft ware.
DNA isolation and polymerase chain reaction DNA was extracted from young leaves of each accession according to the method of Doyle and Doyle (16) with some modifi cations. DNA was isolated from the leaves of the same accessions of each landrace that was subjected to morphological observations. A total of 15 microsatellite primers were prescreened and the 7 most polymorphic primers were used for molecular characterization. Th e DNA of 10 accessions from each bread wheat landrace was isolated and specifi c DNA
regions were amplifi ed by polymerase chain reaction (PCR) using SSR primers. Th e chromosomal location, allele number, range of allele size, and PCR product size of the bread wheat landraces and cultivar Opata are shown in Table 3 (17).
PCR amplifi cations were performed according to the method of Röder et al. (17) with some modifi cations. PCR reactions were carried out in a volume of 30 μL in a Th ermo (Px2) thermal cycler. PCR mixes contained 50 ng of wheat genomic DNA, 0.25 μM of each primer, 0.2 μM dNTP mix, 2.5 μM MgCl2,10X PCR buff er, and 0.5 units of Taq DNA polymerase. Th e PCR cycling reactions were hot started for 5 min at 95 °C. Th e 30 cycles were performed as follows: 1 min at 94 °C, 1 min at 50-60 °C (diff erent annealing temperatures of primers), 1 min at 72 °C, and a fi nal extension step for 5 min at 72 °C. PCR products were separated on 8% denatured polyacrylamide gels and visualized with ethidium bromide. Electrophoresis was applied at 300 W of constant power for 7-8 h, and 0.5X TBE buff er was used as the running buff er during electrophoresis. Statistical analysis
Polymorphisms among amplifi ed bands were determined by using the Vilber Lourmat Bio 1D soft ware, v.11.04. Th e SSR markers were scored for the presence (1) or absence (0) of amplifi ed bands. Comparisons of genotypes and genetic relationships between genotypes were estimated by Numerical Bulgaristan Bolu Balıkesir Bursa Manisa İzmir Antalya Mersin Hat ay Şanlıurfa Adıyaman Diyarbakır Ankara Eskişehir Yozgat Sivas Kayseri Tokat Sinop Samsun Trabzon Erm eni stan N Gürcistan S W E İr an Suriye Irak 90 45 0 90 180 270 360 Km
Figure 1. Geographic distribution of the bread wheat landraces in Turkey. Th e landraces were collected from 6 diff erent geographical regions including 20 provinces.
Taxonomy and Multivariate Analysis System soft ware (NTSYSpc, version 2.1) (18). Th e program was used to obtain dendrograms showing the genetic distance among the genotypes.
SSR marker polymorphism rates were determined using polymorphism information content (PIC) values, which were calculated according to the following formula: PIC = 1 − Σ P2i, where Pi is the frequency of the ith allele (19).
Results
Microsatellite polymorphism
A total of 15 microsatellite primers were tested and 7 selected polymorphic primers were used in this study (Table 3). For this aim, 10 diff erent accessions from each landrace (a total of 200 samples) were used. Th e allele numbers and allele sizes of the primers are presented in Table 4. Th e number of alleles detected by a primer
Table 2. Morphological characters* evaluated in 20 bread wheat landraces.
No. Characters No. of detected variants
1 Plant length 5
2 Spike length 5
3 Beak shape of lower glume 5
4 Shoulder shape of lower glume 3
5 Hairiness of convex surface of apical rachis segment 5
6 Frequency of plants with recurved fl ag leaves 5
7 Anthocyanin coloration of auricles of fl ag leaf 5
8 Ear density 5
9 Ear glaucosity 5
10 Ear color 2
11 Awn presence 4
12 Length of awns at tip of ear 4
13 Awn color 4
14 Grain color 2
15 Grain shape 3
16 Glaucosity of neck of culm 5
17 Glaucosity of sheath of fl ag leaf 5
*Observed morphological characters were selected based on the cultivar registration criteria of the Ministry of Food, Agriculture, and Animal Husbandry of Turkey.
Table 3. Microsatellite markers used for diversity analysis and their molecular data.
Microsatellite loci Chromosomal location Repeat type Annealing temperature (°C) Opata PCR product size (bp)
Xgwm 18 1B (CA)17GA(TA)4 50 188 Xgwm 95 2A (AC)16 60 128 Xgwm 190 5D (CT)22 60 201 Xgwm 261 2D (CT)21 55 164 Xgwm 295 7D (GA)25 60 254 Xgwm 325 6D (CT)16 60 133 Xgwm 458 1D (CA)13 60 115
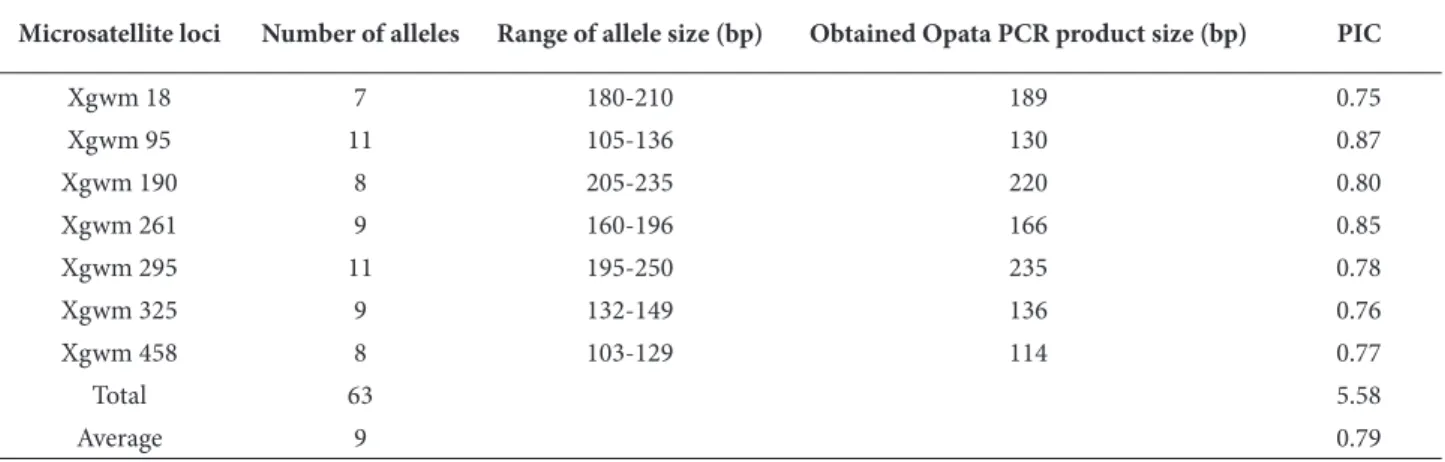
ranged from 7 to 11 among the bread wheat landraces. Th e most polymorphic microsatellite markers were Xgwm 95 and 295 with 11 alleles (Figure 2), followed by Xgwm 261 and 325 with 9 alleles (Figure 3). Th e PIC values of the analyzed microsatellite markers ranged from 0.75 to 0.87. Th e mean PIC value of all SSR markers was 0.79 (Table 4). Xgwm 95 had the highest number of alleles (11 alleles) per locus and the highest PIC value (0.87). Th e lowest number of alleles per locus and the PIC value were estimated to be 7 and 0.75 in Xgwm 18.
A dendrogram based on the relationship values among the landraces was prepared using SSR marker information (Figure 4). According to the dendrogram, the bread wheat landraces were grouped into 2 main sections, and these main sections were separated into several subgroups. Group 1 consisted of TR 32034, TR 37179, and TR 53296, while group 2 included all remaining landraces. Th e accession TR 37179 formed a subgroup, while TR 32034 and TR 53296 formed a diff erent subgroup in group 1. In the second group, the accession TR 46804 took place in
Opata 1 2 3 4 5 6 7 8 9 10 1 2 3 4 5 6 7 8 9 10
44424 53296 53296
50 bp ladder Table 4. Allele numbers and sizes of SSR primers used in the research.
Microsatellite loci Number of alleles Range of allele size (bp) Obtained Opata PCR product size (bp) PIC
Xgwm 18 7 180-210 189 0.75 Xgwm 95 11 105-136 130 0.87 Xgwm 190 8 205-235 220 0.80 Xgwm 261 9 160-196 166 0.85 Xgwm 295 11 195-250 235 0.78 Xgwm 325 9 132-149 136 0.76 Xgwm 458 8 103-129 114 0.77 Total 63 5.58 Average 9 0.79
Figure 2. Th e SSR marker profi les of landraces using Xgwm 95. As seen, the marker showed diff erent polymorphism patterns within landraces.
a separate subgroup, while 16 remaining landraces formed a diff erent subgroup.
Based on the matrix values, the closest genotypes of landraces were TR 63445 from Balıkesir and TR 63886 from Bursa. On the other hand, the most genetically diff erent genotypes were TR 37179 from Sinop and TR 3608 from İzmir. Th e results of the study showed that bread wheat landraces have high genetic variability.
Variations between accessions of landraces were also established (Figure 2). For this aim, 10 diff erent samples of each landrace were used. Genetic diff erences within the landraces were signifi cant. Allele numbers of the primers used and the dendrogram showed this variation. Similar results were found by other researchers, as well (20-22).
Bread Wheat Landraces 50 bp
ladder
Figure 3. Th e SSR marker profi les of landraces using Xgwm 261. Clear polymorphisms are revealed by the marker between landraces. 3608 İzmir 14851 Samsun 45308 Yozgat 38899 Bolu 38902 Trabzon 50460 Adıyaman 57999 Eskişehir 40964 Diyarbakır 44424 Tokat 38917 Manisa 63445 Balısekir 63886 Bursa 63833 Ankara 50416 Urfa 46797 İçel 63525 Antalya 46804 Hatay 32034 Kayseri 53296 Sivas 37179 Sinop 1 2 0.52 0.69 0.77 0.84 0.92 Coefficient
Figure 4. Dendrogram prepared based on SSR marker data of 20 bread wheat landraces.
Analyses of morphological characters
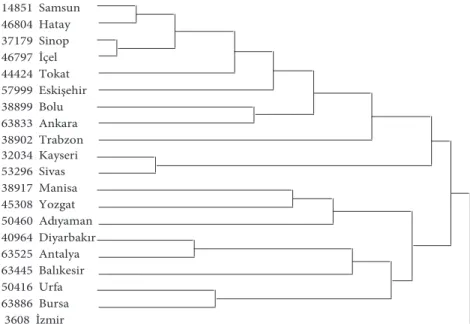
In this study, morphological data and molecular data (SSR markers) were used to investigate the genetic diversity among 20 bread wheat landraces. Th e landraces were clustered into 3 major groups according to morphological analysis (Figure 5). While 2 major groups consisted of 11 and 8 landraces, landrace TR 3608 formed a group by itself. Landraces TR 37179 and TR 46797 were the closest genotypes, and the most diff erent ones were TR 3608 and TR 14851 for morphological data. One of the minor groups contained the landraces from coastal cities (TR 14851, TR 46804, TR 37179, and TR 46797), although these accessions were grouped under diff erent clusters based on the SSR results. Cluster analysis based on the morphological data assigned the landraces from 2 neighboring cities (Kayseri and Sivas) into the same group. Th e landraces from 3 neighboring cities (Eskişehir, Bolu, and Ankara) were clustered together in a major cluster. Lines TR 40964 from Diyarbakır, TR 63525 from Antalya, and TR 63445 from Balıkesir clustered together in a minor group, and they were not from the same region.
Discussion
Th e results of the SSR analyses showed that bread wheat landraces have high genetic variability. Th e genetic variability of the landraces might be aff ected by various factors in their locations. Selections made by farmers according to aims of use may be the reason for the genetic variability between the landraces across locations (22). Th is might also be the main reason for genetic diff erences between the locations among collected genetic materials. Furthermore, the genetic variability between landraces might be due to natural selection such as ecological conditions, diseases, and pests damages. Th e results of our study showed that some landraces collected from the same locations or locations close to each other are genetically similar to each other. It was concluded in a diff erent study that the genotypes from the same geographic origin were grouped in the same cluster, whereas landraces from diff erent locations were closely related or the landraces from the same locations were distantly related (22,23). Similar results on genetic diversity in the molecular characterization of wheat landraces were reported by Dreisigacker et al. (11), Yildirim et al. (22), Strelchenko et al. (23), and Wei et al. (24).
Genetic diff erences within the bread wheat landraces were signifi cant. Th is result is expected and
14851 Samsun 46804 Hatay 37179 Sinop 46797 İçel 44424 Tokat 57999 Eskişehir 38899 Bolu 63833 Ankara 38902 Trabzon 32034 Kayseri 53296 Sivas 38917 Manisa 45308 Yozgat 50460 Adıyaman 40964 Diyarbakır 63525 Antalya 63445 Balıkesir 50416 Urfa 63886 Bursa 3608 İzmir
Figure 5. Dendrogram prepared based on morphological characters of bread wheat landraces.
desirable in landraces because they are genetically heterogeneous but are pure lines (homozygotes). A landrace population may have some advantages and superiority for unexpected conditions, and this might be a reason for having genetic variability in itself (25). Turkey has many wheat landrace populations and collections containing wide genetic variability. Th at is why it is one of the most important countries as a germplasm center for wheat (22,26).
Results also showed signifi cant variation in morphological traits and microsatellite DNA polymorphisms among wheat landraces. It was determined that there were low correlations between the results of the SSR marker analysis and morphological analysis. Th ree main reasons suggested for the low correlation between DNA markers and morphological characters are: 1) DNA markers cover a larger proportion of the genome, including coding and noncoding regions, than the morphological markers; 2) DNA markers are less subjected to artifi cial selection compared with morphological markers (4,27); and 3) it can be assumed that the screened SSR markers did not necessarily amplify the DNA regions linked to the gene regions expressing the morphological characters used in this study.
Morphological characteristics may be the results of the coexpression of several genes and may show closer phenotypical similarities due to selections by local farmers based on similar phenotypes, although they may have very distant genotypic properties. Th erefore, it could be assumed that the
SSR markers would estimate genetic distance better between 2 genotypes in contrast to the phenotypical characteristics (28).
Th e results showed that SSR markers could be successfully used in genetic characterization of wheat landraces. Th e PIC values of all markers were found to be higher than 0.5, which indicates that these markers are valuable in detecting diff erences among populations. McLauchlan et al. (29) obtained similar results in hexaploid wheat and wild wheat relatives. Th ey determined that SSR markers were a very useful tool for the estimation of genetic diff erences and similarities among and within wheat landraces. Similar results were also reported by other researchers in tetraploid and hexaploid wheat (11,21,22,30-32).
Acknowledgment
Th is study was supported by the Scientifi c and Technological Research Council of Turkey (TÜBİTAK, Project Code TOVAG 104O122).
Corresponding author: Özlem ATEŞ SÖNMEZOĞLU Department of Biology,
Kamil Özdağ Faculty of Science, Karamanoğlu Mehmetbey University, 70100 Karaman - TURKEY
E-mail: [email protected]
References
1. Kahrizi D, Cheghamirza K, Kakaei M et al. Heritability and genetic gain of some morpho-physiological variables of durum wheat (Triticum turgidum var. durum). African J Biotechnol 9: 4687-4691, 2010.
2. Schut JW, Oi X, Stam P. Association between relationship measures based on AFLP markers, pedigree data and morphological traits in barley. Th eor Appl Genet 95: 1161-1168, 1997.
3. Marti J, Bort J, Slafer GA et al. Can wheat yield be assessed by early measurements of normalized diff erence vegetation index? Annal Appl Biol 150: 253-257, 2007.
4. Salem KFM, El-Zanaty AM, Esmail RM. Assessing wheat (Triticum aestivum L.) genetic diversity using morphological characters and microsatellite markers. World J Agri Sci 4: 538-544, 2008.
5. Zarkti H, Ouabbou H, Hilali A et al. Detection of genetic diversity in Moroccan durum wheat accessions using agro-morphological traits and microsatellite markers. African J Agric Res 5: 1837-1844, 2010.
6. Akçura M. Th e relationships of some traits in Turkish winter bread wheat landraces. Turk J Agric For 35: 115-125, 2011. 7. Röder MS, Plaschke P, König SU et al. Abundance, variability
and chromosomal location of microsatellites in wheat. Mol Gen Genet 246: 327-333, 1995.
8. Hernández P, Laurie DA, Martin A et al. Utility of barley and wheat simple sequence repeat (SSR) markers for genetic analysis of Hordeum chilense and tritordeum. Th eor Appl Genet 104: 735-739, 2002.
9. Kandemir N, Yıldırım A, Gündüz R. Determining the levels of genetic variation using SSR markers in three Turkish barley materials known as Tokak. Turk J Agric For 34: 17-23, 2010. 10. Stachel M, Lelley T, Grausgruber H et al. Application of
microsatellites in wheat (Triticum aestivum L.) for studying genetic diff erentiation caused by selection for adaptation and use. Th eor Appl Genet 100: 242-248, 2000.
11. Dreisigacker S, Zhang P, Warburton ML et al. Genetic diversity among and within CIMMYT wheat landrace accessions investigated with SSRs and implications for plant genetic resources management. Crop Sci 45: 65-661, 2005.
12. Ijaz S, Khan IA. Molecular characterization of wheat germplasm using microsatellite markers. Genet Mol Res 8: 809-815, 2009. 13. Zhang P, Dreisigacker S, Buerkert A et al. Genetic diversity and
relationships of wheat landraces from Oman investigated with SSR markers. Genet Res and Crop Evo 53: 1351-1360, 2006. 14. Iqbal N, Tabasum A, Sayed H et al. Evaluation of genetic
diversity among bread wheat varieties and landraces of Pakistan by SSR markers. Cereal Res Commun 37: 489-498, 2009. 15. Mandoulakani BA, Bushehri AA, Tabatabaei BE et al. Genetic
diversity among wheat cultivars using molecular markers. J Crop Improv 24: 299-309, 2010.
16. Doyle JJ, Doyle JL. Isolation of plant DNA from fresh tissue. Focus 12: 13-15, 1990.
17. Röder MS, Korzun V, Wendehake K et al. A microsatellite map of wheat. Genetics 149: 2007-2023, 1998.
18. Rohlf FJ. NTSYS-pc Numerical Taxonomy and Multivariate Analysis System, Version 1.70. Exeter Publications. New York; 1992.
19. Anderson JA, Churchill GA, Autrique JE et al. Optimizing parental selection for genetic linkage maps. Genome 36: 181-186, 1993.
20. Eujayl I, Sorrels M, Baum M et al. Assessment of genotypic variation among cultivated durum wheat based on EST-SSRs and genomic SSRs. Euphytica 119: 39-43, 2001.
21. Huang XQ, Börner MS, Goral MW. Assessing genetic diversity of wheat (Triticum aestivum L.) germplasm using microsatellite markers. Th eor Appl Genet 105: 699-707, 2002.
22. Yildirim A, Ateş Sönmezoğlu Ö, Gökmen S et al. Determination of genetic diversity among Turkish durum wheat landraces by microsatellites. Afr J Biotechnol 10: 3915-3920, 2011.
23. Strelchenko P, Kenneth S, Mitrofanova O et al. Genetic diversity among hexaploid wheat landraces with diff erent geographical origins revealed by microsatellites: comparison with AFLP and RAPD. In: Proceedings of 4th International Crop Science Congress. Brisbane, Australia; 2004.
24. Wei YM, Hou YC, Yan ZH et al. Microsatellite DNA polymorphism divergence in Chinese wheat (Triticum aestivum L.) landraces highly resistant to Fusarium head blight. J Appl Genet 46: 3-9, 2005.
25. Allard RW, Bradshaw AD. Implications of genotype-environment interaction in applied plant breeding. Crop Sci 4: 503-508, 1964.
26. Zohary D. Centers of diversity and centers of origin. In: Frankel OH, Bonnet E. eds. Genetic Resources in Plants: Th eir Exploration and Conservation. Blackwell; 1970: pp. 33-42. 27. Semagn K. Genetic relationships among ten endod types as
revealed by a combination of morphological, RAPD and AFLP markers. Hereditas 137: 149-156, 2002.
28. Tsombalova J, Haljak M, Ingver A et al. Genetic diversity of Estonian-grown spring wheat varieties assessed by microsatellite and morphological analyses. Soil and Plant Sci 58: 97-104, 2008.
29. McLauchlan A, Henry RJ, Isaac PG et al. Microsatellite analysis in cultivated hexaploid wheat and wild wheat relatives. Henry RJ. ed. Plant Genotyping: Th e DNA Fingerprinting of Plants, CABI Publishing; 2001: pp. 147-159.
30. Mahmood A, Baenziger PS, Budak H et al. Th e use of microsatellite markers for the detection of genetic similarity among winter bread wheat lines for chromosome 3A. Th eor Appl Genet 109: 1494-1503, 2004.
31. Zeb B, Khan IA, Ali A et al. Study on genetic diversity in Pakistani wheat varieties using simple sequence repeat (SSR) markers. African J Biotechnol 8: 4016-4019, 2009.
32. Mangini G, Taranto F, Giove SL et al. Identifi cation of durum wheat cultivars by a minimum number of microsatellite markers. Cereal Res Commun 38: 155-162, 2010.