31
INDEXING AND INDEX FUNDS Hakan SARITAŞ(∗)
ABSTRACT
Proponents of the efficient market hypothesis believe that active portfolio management is largely wasted effort and unlikely to justify the expenses incurred. Therefore, they advocate a passive investment strategy that makes no attempt to outsmart the market. One common strategy for passive management is indexing where a fund is designed to replicate the performance of a broad-based index of stocks and bonds. Traditionally, indexing was used by institutional investors, but today, the use of index funds proliferated among individual investors. Over the years, both international and domestic index funds have disproportionately outperformed the market more than the actively managed funds have.
Key words: Indexing, Index Funds, Active and Passive Portfolio Management.
(∗) Yrd. Doç. Dr., Pamukkale Univ. İ.İ.B.F. İşletme Bölümü, Kınıklı-Denizli.
1. Introduction
Indexing is a relatively recent innovation that has become a popular vehicle for common stock investments. Institutions, as well as individuals, are using index funds in their investment portfolios. The basic assumption behind index funds is that the market is efficient; that is, information is freely available for all investors and stocks are “fairly priced.” Therefore, investors cannot beat the market and are just as well off with a market basket of stocks.
This study considers indexing as a means of portfolio investing. Performances of twenty five A Type Mutual Funds are evaluated using monthly return data from 1998 through 2002. Returns are measured against ISE-100 Index (Istanbul Stock Exchange-100 Index) returns. The results of the study suggest that indexing offer high returns compared to the actively managed mutual funds.
Active investment strategy is an approach to investing which involves relatively more trading and active monitoring of the portfolio, and many times is motivated by a philosophy that the investor can “beat the market ”(Maness & Zietlow, 1993: G-1). Passive investment strategy involves a minimal amount of oversight and very few transactions once the portfolio has been selected (Maness & Zietlow, 1993:G-14).
Passive investment strategy relies on efficient market hypothesis that refers to a market where prices at all times fully reflect all available information that is relevant to the valuation of securities. Fabozzi (1999: 175) suggests that when a market is efficient, strategies pursued to outperform a broad based stock market index will not consistently produce superior returns after adjusting for risk and transaction costs.
Proponents of the efficient market hypothesis believe that active management is largely wasted effort and unlikely to justify the expenses incurred. Therefore, they advocate a passive investment strategy that makes no attempt to outsmart the market. A passive strategy aims only at establishing a well-diversified portfolio of securities without attempting to find under- or overvalued stocks. Because the efficient market theory indicates that stock prices are at fair levels, given all available information, it makes no sense to buy and sell securities frequently, which generates large amount of brokerage fees without increasing expected performance (Bodie et al., 1993: 365).
A common strategy for passive management is to create an index fund that is designed to replicate the performance of a broad-based index. Passive management is economical and mitigates the potential problem of paying active management fees. The use of various types of index funds in combination with treasury bills can virtually eliminate diversifiable risk, which means returns by definition commensurate with the risk incurred. This is a desirable property if fair compensation of risk incurred is the primary basis for evaluating performance (Ennis, 1993: 27).
3. Indexing Strategy and Index Funds
Indexing is the more commonly followed passive investment strategy (Fabozzi, 1999: 253). With this approach, the money manager does not attempt to identify undervalued or overvalued stock issues using fundamental security analysis. Nor does the money manager attempt to forecast general movements in the stock market and then structure the portfolio so as to take advantage of those movements. Instead, an indexing strategy involves designing a portfolio to track
33
the total return performance of an index of stocks. In other words, indexing is the structuring of a passively managed portfolio of stocks or bonds, that seeks to replicate the returns of market indexes like the S&P 500 stock index or the Shearson/Lehman government bond index. Aiello and Chieffe (1999) indicate that indexing strategy is consistent with modern portfolio theory and presents important cost advantages for clients.
Indexing can take place in two principal forms (Miller and Meckel, 1999). First, it can be accomplished through the physical replication of securities in an index, such as owning the exact number of shares of Microsoft, in order to match Microsoft’s percentage of the S&P 500. This can be done in the form of exact matching, or in simpler close approximations such as "stratified sampling." Second, indexing can be accomplished through the use of derivatives contracts that seek to replicate the returns, not the holdings, of an index.
An index fund or account is comprised of securities that in the aggregate will produce a return replicating a designated securities index. Index funds were first introduced in the early 1970s in the USA when the stock market was recovering from one of the most sustained bear market of history. With stocks down about 40%, investors were in no mood to be adventurous and thousands left the market entirely. Investors believed their managers had failed to protect them for a down market. Vanguard Group introduced a fund that did not rely on managers, strategies, stock selection or market timing. Vanguard Index Trust 500 seeks to move in tandem with the Standard and Poor’s 500 Index. Index funds replicate either domestic indexes (i.e. S&P 500 Index in USA and ISE 100 Index in Turkey) or international indexes such as the Europe, Australia and Far East (EAFE) Index and smaller specialized indexes. Indeed, index fund managers can customize a fund to meet almost any special investment objectives.
In Turkey, in the recent years, index funds started to be used in capital markets after legal regulations was undertaken by the CMB (SPK). According to legal regulation in Turkey, an index fund is defined as “a fund that 80 % of its portfolio continuously consists of all or a part of securities in a selected index providing that the correlation between the value of the index and the value of the fund is least 90%” (SPK Tebliği, 1998).
Both theoretical and empirical reasons underlie the increased use of indexing strategy. The theoretical underpinning for this strategy is capital market theory. According to this strategy, in an efficient market, the “market portfolio” offers the highest level of return per unit of risk because it captures the efficiency of the market. As a proxy for the theoretical market portfolio, an index that is representative of the market should be used. In an efficient market, there is no value for stock selection and forecasting of market movements. In such a market, the best investment tool, which offers the ideal diversification eliminating diversifiable risk, is index fund (Fabozzi, 1999: 253; Karan, 2001: 535).
There are a number of fundamental reasons to consider indexing. These fundamental reasons are cost, diversification and risk reduction, performance, and predictability.
Lower cost: One of the more quantifiable of these reasons is “cost” -both in
terms of management fees and transaction costs. Management fees for active management are significantly higher than the fees for index management; indeed, they can be three to five times higher. The average mutual fund charges roughly 1.5% annually for management fees (Green, 1993: 88). As Table 1 indicates, typically, an active equity portfolio turns over between 100% and 120% per year, incurring annual transaction costs of approximately 0.60%. Index funds, on the other hand, incur annual transaction costs of approximately 0.05% (Parish, 1993: 14). This low transaction costs incurred by index funds is a result of low transaction turnover because transactions occur only when there are internal (dividends or interest) and external (deposits or withdrawals) cash flows, and when there are changes to the index.
Table 1. Transaction Costs Comparison (Equities)
Index Active Turnover 10-20% 100-120% Commissions 0.05% 0.12% Market Impact 0.30% 0.40% Total Annual Transaction Costs* 0.05% 0.60% *Turnover x (Commission + Market Impact).
35
diversification and continuing commitment to the market enable investors’ monies to participate in upward valuation surprises. Diversification is a risk reduction strategy in which investors hold securities of varying quality, type, industry, maturity, and/or size (Parish, 1993: 15).
While some forms of risk are diversifiable, some others are not. The risk that remains even after extensive diversification is called market risk, systematic risk, or non-diversifiable risk, which is the risk that is attributable to market-wide risk sources. Specific risk or non-market risk is the risk associated with specific firms and industries and can be diversified. Index funds eliminate non-market risk; since index funds represent the market, they have only market risk. For risk averse investors, indexing is an effective risk reduction strategy (Parish, 1993: 15). Market index funds are, by definition, broadly diversified across their respective capital market segments.
Historical evidence suggests that most active managers are not rewarded for the risk they assume when timing the market. Furthermore, active mangers, by definition, face greater volatility risk over the long term than index funds. Indeed, index funds have incurred no more than the average long term risk, relative to active managers, in achieving their above average long term performance results (Parish, 1993: 16).
Performance: Many investors view performance as the prime reason to
consider indexing. Historical evidence shows that, over time, indexing compares favorably with active management. Total return of an index fund is no better and no worse than the market as a whole because, as mentioned above, index funds represent the market.
Predictability: Active managers are expected to add value to such
benchmark indexes as the S&P 500 Index and the Lehman Brothers Government/Corporate Bond Index, either through excess return or decreased risk. The problem here is that it is impossible to accurately predict at the beginning of the year whether active managers will add value. This unpredictability has prompted a number of investors to use index funds as proxies for the various asset classes in their portfolios.
Index funds represent an investment strategy that is predictable and relatively easy to understand. Investors are constantly aware of how their investments are doing since most major indexes are published daily (Parish, 1993:16).
3.2. Shortcomings of Index Funds
Despite the fact that index funds have so many attractive characteristics, there are some undesirable characteristics. As Clarence C. Elebash (1993) indicates, index funds are unattractive because:
• They prevent superior performance. They do only as well as the
market and cannot do better.
• They do not permit investment managers to exploit market
inefficiencies. Index funds are essentially “buy and hold” investments.
• They allow someone else to make stock selection, i.e., the people
who manage the replicated index. For example, the committee in charge of the S&P 500 Index is the stock picker for S&P 500 Index funds.
4. Current Study
Many scholars examined performances of mutual funds using different approaches. Some of the studies indicated that actively managed mutual funds on average underperformed the market portfolio (benchmark) due to transaction costs and commissions incurred in intensive buying-selling transactions. Based on these findings, some scholars suggest that there is no need to try to beat the market since prices fully reflect all available information; that is market is efficient. On the other hand, other studies indicated that findings did not support the hypothesis that market is efficient.
The first comprehensive study on performances of mutual funds was conducted by Friend, Brown, Herman and Vickers. The findings of the study did not suggest that market inefficiency existed. Following studies done by Treynor and Kazuy, Sharpe, and Jensen showed that actively managed funds did not exhibit high performance. However, other studies done by Friend, Blume and Crockett, Carlson, McDonald, Mains and Kon, and Jen and Shawky exhibited contradictory results to earlier studies (Ippolito, 1993).
Annaert et al (2003) indicates that the literature has broadly come to a consensus that actively managed mutual funds, on average, cannot beat the market (or passively managed portfolios), an observation that clearly aligns with the efficient market hypothesis.
In this study, I examined performances of Turkish A type mutual funds and tried to find out if investors can benefit from investing in index funds instead of actively managed mutual funds.
37 4.1. Research Design
To find out if indexing can provide investors a good opportunity to get a desirable return while minimizing risk, I have performed tests to determine how actively managed mutual funds perform compared to a benchmark index.
I have tested the monthly return data of twenty five actively managed A Type Mutual Funds to determine whether they outperform the ISE-100 (IMKB-100) benchmark, using Sharpe, Treynor, and Jensen performance evaluation measures. Comparing the returns of mutual funds with the return of a benchmark such as ISE 100 Index does not take into consideration risks of returns. That is why above measures, which consider risk, were used in this study (for more detail on the measures, see Ayaydın, 1993: 76-81; Bolak, 2001: 286-288; Fabozzi, 1999: 723-725; and Karan, 2001: 673-678).
The Sharpe measure is the ratio of average risk premium to the total risk of the portfolio during the evaluation period. The Treynor measure is the ratio of average risk premium to systematic risk of the portfolio. Jensen measure is the intercept in regression of excess portfolio returns against excess market returns.
I attempt to answer the following questions: 1) Do actively managed mutual funds outperform the ISE-100 benchmark index individually?; 2) Do actively managed mutual funds outperform the ISE-100 benchmark index as a whole?
In this study, I used monthly return data on twenty five A Type Mutual Funds collected by the CMB (SPK). The sample period is January 1998 through December 2002. The ISE-100 IMKB-100) is the benchmark index. The three-month Treasury bill yield is used as the risk-free rate. I computed excess returns of the funds from this security.
Since this study aims to find out if indexing can provide investors a good opportunity to get a desirable return while minimizing risk, I have performed tests to determine how actively managed mutual funds perform compared to the benchmark index of ISE 100. The reason why actively managed fund performances are compared only with ISE 100 Index is that index funds are constructed based on broad market indexes. Although it is possible to compare mutual fund performances to performances of other investment instruments such as Treasury bills, interest rates, and foreign currency, such a comparison is beyond the scope of this study since this study aims at finding out if index funds are promising alternative for investors in Turkey compared to actively managed funds. A comparison of mutual fund performances to performances of other investment instruments such as Treasury bills, interest rates, and foreign currency may be the research subject of a further research.
4.2. Analysis of Data and Results
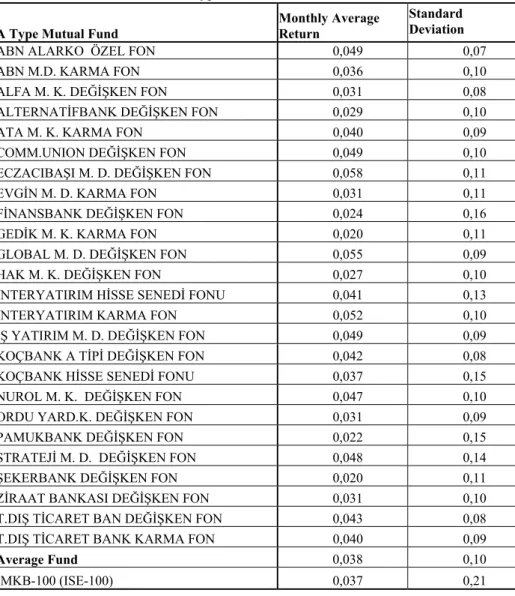
Table 2 shows the risk-return data for the twenty five funds and the ISE-100. During the evaluation period, the average monthly return on the mutual funds is 3.80 %. The average monthly return on the ISE-100 is 3.71 %. Twelve of the funds return more than the ISE-100. Eczacıbaşı M. D. Değişken Fon has the largest monthly returns at 5.80 % and Şekerbank Değişken Fon has the smallest at 1.95 %.
Table 2. Returns for A Type Mutual Funds and ISE-100 A Type Mutual Fund
Monthly Average Return
Standard Deviation
ABN ALARKO ÖZEL FON 0,049 0,07
ABN M.D. KARMA FON 0,036 0,10
ALFA M. K. DEĞİŞKEN FON 0,031 0,08
ALTERNATİFBANK DEĞİŞKEN FON 0,029 0,10
ATA M. K. KARMA FON 0,040 0,09
COMM.UNION DEĞİŞKEN FON 0,049 0,10
ECZACIBAŞI M. D. DEĞİŞKEN FON 0,058 0,11
EVGİN M. D. KARMA FON 0,031 0,11
FİNANSBANK DEĞİŞKEN FON 0,024 0,16
GEDİK M. K. KARMA FON 0,020 0,11
GLOBAL M. D. DEĞİŞKEN FON 0,055 0,09
HAK M. K. DEĞİŞKEN FON 0,027 0,10
İNTERYATIRIM HİSSE SENEDİ FONU 0,041 0,13
İNTERYATIRIM KARMA FON 0,052 0,10
İŞ YATIRIM M. D. DEĞİŞKEN FON 0,049 0,09
KOÇBANK A TİPİ DEĞİŞKEN FON 0,042 0,08
KOÇBANK HİSSE SENEDİ FONU 0,037 0,15
NUROL M. K. DEĞİŞKEN FON 0,047 0,10
ORDU YARD.K. DEĞİŞKEN FON 0,031 0,09
PAMUKBANK DEĞİŞKEN FON 0,022 0,15
STRATEJİ M. D. DEĞİŞKEN FON 0,048 0,14
ŞEKERBANK DEĞİŞKEN FON 0,020 0,11
ZİRAAT BANKASI DEĞİŞKEN FON 0,031 0,10
T.DIŞ TİCARET BAN DEĞİŞKEN FON 0,043 0,08
T.DIŞ TİCARET BANK KARMA FON 0,040 0,09
Average Fund 0,038 0,10
39
The lowest standard deviation is that of ABN Alarko Özel Fon at 0.0669. Finansbank Değişken Fon has the greatest standard deviation at 0.1599. The standard deviation of ISE-100 is 0.2050. The overall average standard deviation for the mutual funds is 0.1046. The benchmark index ISE-100 seems to be too risky compared to the actively managed mutual funds.
Given above results, investors who seek lower risk based on standard deviation would not consider investing in index funds based on the ISE-100 Index. Instead, risk averse investors should consider mutual funds that have lower standard deviation. In contrast, risk taker investors may consider investing in index funds based on the ISE-100 Index or actively managed funds that have higher return.
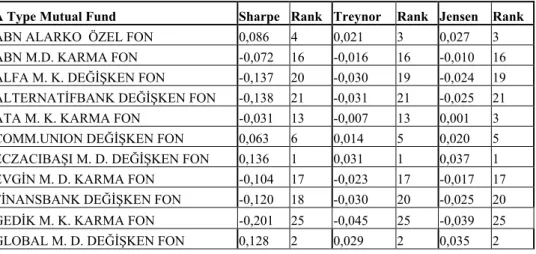
Table 3 exhibits the portfolio performance measures for the actively managed mutual funds. According to the Sharpe measure (excess return to variability), only nine of the funds with positive ratio and the two with negative ratio overperformed the ISE-100 Index. The average Sharpe measure for the mutual funds 0.04205) is less than that of the Sharpe measure for ISE-100 (-0.02842). Therefore, we cannot reject the null hypothesis that the average performance of the mutual funds is equal to or less than that of the ISE-100 Index in terms of Sharpe measure.
Based on the Sharpe measure, Eczacıbaşı M. D. Değişken Fon has the largest excess return for full risk of the fund at 13.6 % and Gedik M. K. Karma Fon has the smallest at –20.1 %. Although the average performance of the mutual funds is less than that of the ISE-100 Index in terms of Sharpe measure, it should be noticed that the ISE-100 Index has a negative performance in terms of Sharpe measure.
Above results indicate that actively managed mutual funds, on average, do not yield as much as compensating full risk incurred. In other words, actively managed funds, on average, exhibit poor performance in terms of excess return to variability.
According to Treynor measure (excess returns to nondiversifiable risk), only nine of the funds with positive ratio and the two with negative ratio overperformed the ISE-100 Index. Eczacıbaşı M. D. Değişken Fon has the largest excess return for nondiversifiable risk of the fund at 3.1 % and Gedik M. K. Karma Fon has the smallest at –4.5 %. The average fund has a –0.00947 Treynor measure, lower than the ISE-100 Treynor measure of –0.00583. Therefore, we
cannot reject the null hypothesis that the average performance of the mutual funds is equal to or less than that of the ISE-100 Index in terms of Treynor measure.
Although the average performance of the mutual funds is less than that of the 100 Index in terms of Treynor measure, it should be noticed that the ISE-100 Index has a negative performance in terms of Treynor measure.
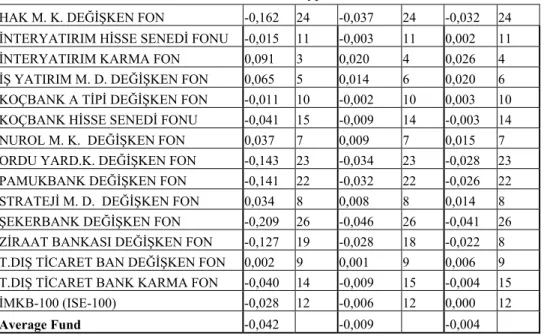
According to Jensen measure, eleven mutual funds exhibited high performance (having positive Jensen measure) compared to the ISE-100 Index. The average fund has a –0.00365 Jensen measure. Therefore, we cannot reject the null hypothesis that the average performance of the mutual funds is equal to or less than that of the ISE-100 Index in terms of Jensen measure.
These findings indicate that actively managed A Type Mutual Funds, on average, do not offer promising returns to investors compared to the ISE-100 Index. In other words, although some funds exhibit better performance compared to the benchmark index, if we assess the performances of actively managed funds as a whole, these funds do not justify the risks incurred and the costs born by investors. These findings suggest that investors have to take into consideration the risk and return characteristics of actively managed funds.
Since above measures consider excess returns of the funds (returns of the funds mines risk free rate), the findings show that the actively managed funds, on average, do not yield returns over the three-month Treasury bill yield (risk free rate). This case might have been resulted from the fact that real interest rates in Turkey have been higher over the recent years. Such a high interest rates have prevented investors from investing A Type mutual funds.
Table 3. Performance Measures for A Type Mutual Funds and ISE-100
A Type Mutual Fund Sharpe Rank Treynor Rank Jensen Rank
ABN ALARKO ÖZEL FON 0,086 4 0,021 3 0,027 3
ABN M.D. KARMA FON -0,072 16 -0,016 16 -0,010 16 ALFA M. K. DEĞİŞKEN FON -0,137 20 -0,030 19 -0,024 19 ALTERNATİFBANK DEĞİŞKEN FON -0,138 21 -0,031 21 -0,025 21 ATA M. K. KARMA FON -0,031 13 -0,007 13 0,001 3
COMM.UNION DEĞİŞKEN FON 0,063 6 0,014 5 0,020 5
ECZACIBAŞI M. D. DEĞİŞKEN FON 0,136 1 0,031 1 0,037 1 EVGİN M. D. KARMA FON -0,104 17 -0,023 17 -0,017 17 FİNANSBANK DEĞİŞKEN FON -0,120 18 -0,030 20 -0,025 20 GEDİK M. K. KARMA FON -0,201 25 -0,045 25 -0,039 25
41
Table 3.’ün devamı Performance Measures for A Type Mutual Funds and ISE-100 HAK M. K. DEĞİŞKEN FON -0,162 24 -0,037 24 -0,032 24 İNTERYATIRIM HİSSE SENEDİ FONU -0,015 11 -0,003 11 0,002 11 İNTERYATIRIM KARMA FON 0,091 3 0,020 4 0,026 4 İŞ YATIRIM M. D. DEĞİŞKEN FON 0,065 5 0,014 6 0,020 6 KOÇBANK A TİPİ DEĞİŞKEN FON -0,011 10 -0,002 10 0,003 10 KOÇBANK HİSSE SENEDİ FONU -0,041 15 -0,009 14 -0,003 14
NUROL M. K. DEĞİŞKEN FON 0,037 7 0,009 7 0,015 7
ORDU YARD.K. DEĞİŞKEN FON -0,143 23 -0,034 23 -0,028 23 PAMUKBANK DEĞİŞKEN FON -0,141 22 -0,032 22 -0,026 22 STRATEJİ M. D. DEĞİŞKEN FON 0,034 8 0,008 8 0,014 8 ŞEKERBANK DEĞİŞKEN FON -0,209 26 -0,046 26 -0,041 26 ZİRAAT BANKASI DEĞİŞKEN FON -0,127 19 -0,028 18 -0,022 8 T.DIŞ TİCARET BAN DEĞİŞKEN FON 0,002 9 0,001 9 0,006 9 T.DIŞ TİCARET BANK KARMA FON -0,040 14 -0,009 15 -0,004 15
İMKB-100 (ISE-100) -0,028 12 -0,006 12 0,000 12
Average Fund -0,042 -0,009 -0,004
5. Conclusion
An index fund is comprised of securities that in the aggregate will produce a return replicating a designated securities index. The basic assumption behind index funds is that the market is efficient; that is, information is freely available for all investors and stocks are fairly priced. Therefore, investors cannot beat the market.
The results of this study suggest that investors may get satisfactory returns by investing in index funds compared to actively managed mutual funds. That is because actively managed mutual funds, on average cannot post returns over the benchmark index of ISE-100. This is to say that index funds based on ISE-100 may provide investors with desirable return without bearing high management fees and commissions.
Given that most investors in Turkey lack of necessary sophistication in terms of making investment decisions, investors may be better off if they invest in index funds based on broad market indexes instead of investing in actively managed funds. By preferring such an investment instruments, investors may receive reasonable returns while minimizing risks incurred and costs born.
However, while making such an investment choice, a consideration should be taken into account that ISE-100 Index has high risk compared to actively managed funds. Also, the fact that reel interest rates are considerably high in Turkey should be taken into account.
In sum, this study suggests that indexing strategy has a potential in Turkish capital market that investors can take advantage of. As interest rates lower and the capital markets stabilize in Turkey, index funds may be a promising investment alternative for investors. The performances of available index funds in the market will be a good guide for future investment decisions. Evaluating the performances of available index funds in the market may be the research subject of a further study.
ÖZET
Etkin piyasa hipotezini savunanlar, aktif portföy yönetiminin büyük ölçüde boşuna harcanan bir çaba olduğuna ve yapılan harcamaları haklı kılmayacağına inanmaktadırlar. Dolayısıyla bunlar, piyasayı yenmek için bir çaba göstermeyen pasif yatırım stratejisini savunmaktadırlar.Pasif portföy yönetiminde yaygın bir strateji endeksleme yöntemidir. Burada, piyasayı temsil eden kapsamlı bir hisse senedi veya tahvil endeksinin performansını izleyecek (taklit edecek) şekilde bir yatırım fonu (endeks fonu) oluşturulur ve aktif alım-satım işlemlerinden kaçınılarak piyasayla aynı getiri elde edilmeye çalışılır.
Yapılan çalışmada, seçilen A Tipi Yatırım Fonlarının ortalama olarak İMKB-100 Endeksinden daha düşük performans gösterdikleri ortaya çıkmış ve bu da, yatırımcıların aktif olarak yönetilen fonlar yerine endeks fonlarına yatırım yaparak ortalama daha fazla getiri elde edebileceklerini göstermiştir.
Türkiye’de yatırımcıların çoğunun yatırım kararı almada gerekli donanıma sahip olmadığı dikkate alındığında, yönetim maliyetleri düşük olan ve yatırımcısına makul getiri sağlayabilecek endeks fonları yatırımcılar için iyi bir alternatif yatırım aracı olabilir. Ancak, endeks fonlarına yatırım yaparken, Türk hisse senedi piyasasının oynaklığının fazla olduğu unutulmamalıdır.
Anahtar Kelimeler: Endeksleme, Endeks Fonları, Aktif ve Pasif Portföy Yönetimi.
43
REFERENCES
AIELLO, Scott and CHIEFFE, Natalie (1999), International index funds and the investment portfolio. Financial Services Review 8, 27–35.
ANNAERT, Jan; Van Den BROECK, Julien and VENNET, R. Vander (2003), Determinants of mutual fund underperformance: A Bayesian stochastic frontier approach. European Journal of Operational Research 151, 617– 632.
AYAYDIN, Aydın (1993), Yatırım Fonları Performans Değerlendirmesi. Cem Ofset, İstanbul.
BODIE, Zvi, KANE, Alex, and MARCUS, Alan J. (1993), Investments, R. D.Irwin Inc.
BOLAK, Mehmet (2001), Sermaye Piyasası Menkul Kıymetler ve Portföy
Analizi.Beta Basım A.Ş., İstanbul.
ELEBASH, Clarence C. (1993), Public Pensions: Big Investors In Stock Index Funds. Benefits Quarterly, Winter, v9, n1, 86-93.
ENNIS, Richard M. (1988), Is a Statewide Pension Fund a Person or a Cookie Jar? The Answer Has Implications for Investment Policy. Financial Analysts
Journal, Nov-Dec,v44, n6, 21-27.
FABOZZI, J. Frank (1999), Investment Management. Prentice-Hall, Inc. NJ, USA. GREEN, Reg (1993), Inside Index Funds. Best’s Review-Life/Health, June, v94,
n2, 88-90.
IPPOLITO, R. A. (1993), On Studies of Mutual Fund Performance, 1962-1991.
Financial Analysts Journal, Jan.-Feb., v49, n1, 42-50.
KARAN, M. Baha (2001), Yatırım Analizi ve Portföy Yönetimi. Gazi Kitabevi, Ankara.
MANESS, Terry S. and ZIETLOW, John T. (1993), Short-Term Financial
Management. St. Paul, MN, West publishing Company.
MILLER, Todd and MECKEL, S. Timothy (1999), Beating index funds with derivatives. Journal Portfolio Management, May, 75-88.
PARISH, John C. Jr. (1993), Sponsors, Participants Impacted by Corporate Asset Move To Defined Contribution., Pension World, v29, n1, January, 14-16.
SPK Tebliği (1998), Yatırım Fonlarına İlişkin Esaslar Tebliğinde Değişiklik