The Nexus of Environmental Quality with Renewable Consumption,
Immigration and Healthcare in the USA: Wavelet and Gradual Shift
Causality Approaches
Andrew Adewale Alola a,b a
Department of Economics and Finance, Istanbul Gelisim University, Turkey. b
South Ural State University, Russia Corresponding: [email protected]
Dervis Kirikkaleli c European University of Lefke
Faculty of Economic and Administrative Science Department of Banking and Finance
Lefke, Northern Cyprus TR-10 Mersin, Turkey Email: [email protected]
Mobile No: +90 548 8637770 0000-0001-5733-5045
Abstract
Given that the volume of carbon emissions in the United States is a significant share of the global greenhouse gas emissions, some salient factors are being currently examined so as to reverse the threat to global environmental sustainability. To this regard, the current study investigates the co-movement and long-term and short-term causal relationship between CO2 emission (a proxy for environmental quality) and renewable consumption, immigration, and healthcare by using the wavelet coherence approach which primarily provides information on dynamic correlations over time and for different time scales. The coherence approach allows the one-dimensional time data into the bi-dimensional time-frequency sphere between the variables. In addition to investigating the causal relationship between CO2 and renewable consumption, immigration and healthcare, this study also employs gradual shift causality and Toda-Yamamoto causality tests. With this, the study found a high variation for CO2 emission in the US at 8 scales (8 quarters) from 1999 to 2008. Additionally, there is significant feedback causality between CO2 emission and renewable consumption at different scales while positive correlation between the variables is observed in the short-run. Similarly, the result reveals that immigration significantly causes CO2 emission in the U.S from 2008 to 2010 and a two-way causality is detected between CO2 emission and healthcare at different frequencies and time period. Moreover, the Toda-Yamamoto causality and gradual shift causality tests provide supportive evidence to the outcomes of the wavelet coherence–based causality test in this study. Overall, the investigation offers significant policy directive especially toward addressing the potential adverse effects from the country‟s immigration and healthcare amendments.
Keywords: environmental quality; CO2 emissions; immigration; healthcare; wavelength
1. Introduction
As long as human activities are unavoidable, there is certainty of environmental concerns. Although climatic updates such as from the Atmospheric Infrared Sounder (AIS) and Orbiting Carbon Observatory-2 (OCO-2) have been consistently informative, the vulnerability of the global environment is arguably unabated. This is because the natural areas and the environmental capacity to support life (attaining environmental sustainability) have not ceased to be hampered by the undesirable levels of atmospheric gases, eutrophication potential, terrestrial acidification and ecotoxicity of the ecosystem. In recent times, environmental costs of living and ensuring a sustainable economy, social and geographical quality have continued to increase (Yang et al. 2019; Saleem et al. 2019; Ryu et al. 2019), hence compelling the attention of researchers, environmentalists and other stakeholders. Albeit still a subject of contention among some groups, the resulting evidence of these environmental issues has been largely associated with the climate change. In addition to other important sources of environmental contaminants, carbon dioxide (CO2) has remained a potent and active chemical component of the greenhouse gas (GHG) which is largely associated with the global warming (Hegerl and Cubasch 1996). According to the
National Aeronautics and Space Administration (NASA 2019), recent global evidence revealed
that there is an increasing and variation in the level of concentration of mid-tropospheric carbon dioxide in parts per million (PPM).
With the current global CO2 emissions measured as 410 PPM (about 110PPM higher than the highest level in centuries), developed economies like the United States (US) has since remained a major contributor to global environmental and atmospheric CO2 emissions. For instance, the British Petroleum (BP 2018) informs that the growth rate of CO2 emissions in North America (especially by the US) between 2007 and 2017 is -0.4%. Although the growth rate of CO2
emissions is observed to be negative (which is characteristic of the developed countries), the actual volume of CO2 emissions by the countries has remained significantly high. With the hokey-pokey gesture of the US, especially the recent policy strategy of the country on the Paris Agreement of 20151, it translates that there remain a tumultuous challenge of turning down the volume of heat (CO2 emissions) which is directly associated with the environmental and economic sustainability policies of the US. Hence, the strategy and mechanism of deploying appropriate climate change mitigation policies is crucial to both the US‟s economic and environmental sustainability (Alola 2019a &b). While energy and environmental policies (such as the clean power plan and the US climate alliance) are important parts of the country‟s environmental sustainability goals, social factors such as migration and healthcare are believed to pose a similar effect as economic determinants.
Indicatively, human mobility is expected to be consistently skewed as long as people remained vulnerable to the adverse effect of climate change; thus compelling movement toward where there is greater chance of livelihood. For instance, the International Organization for Migration (IOM 2019) report hints on the trigger effect of growing population movement within and across borders on the climate change. The report associates such trend of movement with the significant increase in weather intensity, rise in the sea-level, and other causative factors of environmental degradation. Specifically, the current US government has consistently and significantly maintained a hard stance on its immigration policy by citing economic reasons (Jotzo et al. 2018), but the environmental effects have not also been overlooked. By echoing the report of the Natural Resources Defense Council (NRDC 2019) that “climate change is already driving mass
1
Paris Agreement is United Nations Framework Convention on Climate Change (UNFCC) of 2015. More details relating to the Paris Agreement of 2015 are available at:
https://unfccc.int/process/conferences/pastconferences/paris-climate-change-conference-november-2015/paris-agreement.
migration around the globe”, recent reports by both The Guardian (2019) and New York Times emphasize the important role and the nexus of migration (specifically mass migration) and the environment.
Furthermore, while evidence of human health-environmental nexus remained an age-long intuition, there has been growing evidence of the link between the healthcare system and environmental sustainability. This is because the healthcare system is a function of the country‟s economy on one hand. On the other hand, the health care sector is believed to be a direct or indirect source of potential harm to public health through different dynamics. For instance, the significant fractions of national air pollution emissions such as the acidic rain (12% of national pollution), the GHG emissions (10% of national pollution), smog formation (10% of national pollution), criteria air pollutants (9% of national pollution), stratospheric ozone depletion (1% of national pollution), and carcinogenic and non-carcinogenic air toxics (1–2% of national pollution) are associated with the health care sector of the country (Eckelman and Sherman 2016).
Nevertheless, the nexus of environment with migration and the health care system of the US cannot be illustrated in isolation and especially in the current context without a reflection on the country‟s (cleaner) energy plan. Toward a sustainable environment and energy portfolio diversification, the US Department of Energy‟s National Renewable Energy Laboratory (NREL 2019) indicates that the country could generate about 80% of its electricity consumption from renewable energy by 2050. The report suggests that the abundance of the US‟ resources and technologies such as the wind turbines, solar photovoltaic (PV), concentrating solar power, geothermal, hydropower, and bio-power could sufficiently enhance the 80% renewable electricity target of 2050. Additionally, the International Renewable Energy Agency (IRENA
2015) projects a 27% share of renewable energy in the US total energy mix by 2030. In addition to mitigating probable health effects and CO2 emissions by 2030, the report (IRENA 2015) importantly hints that the US economy could save a significant 30 to 140 billion USD per year by 2030.
As the innovation of the present study, the study investigates the time-frequency dependency environmental quality vis-à-vis CO2 , immigration, and the healthcare of the United States over the period 1990:Q1-2018:Q2 in the United States has not yet been investigted in depth to the best of our knowledge. Since the wavelet coherence approach combines time and frequency domain causality approaches, the wavelet coherence approach allows us to explore the short-run and long-run linkage among the variablies in the United States. Thus the main innovation of the present study is to fill this gap in the literature. Therefore, this study is likely to open up new debate and the outcome of the empirical results offer significant implications for governors in the United States.
Considering the above motivations, the current study objectively deepened the investigation of the nexus of environmental quality vis-à-vis CO2 , immigration, and the healthcare of the US over the period 1990:Q1-2018:Q2. While previous studies have similarly illustrated the subject (nexus of environment-migration-health) by mostly considering the dynamic inferences (such as the short-run and long-run) (Alola 2019 a & b; Apergis et al. 2018), the current study will potentially contribute to the existing literature because; (1) it presents causal relationship of environmental sustainability, migration and healthcare by employing the novel wavelet coherence approach which significantly provides time-frequency variant information on dynamic correlations. Also, the current study employs the novelty of the gradual shift causality of Nazlioglu et al. (2015) as applied by Kalmaz and Kirikkaleli (2019) to further investigate the
internal dynamics of the relationship. The above named contributions significantly compliment the findings of Alola (2019 a & b).
In the next sections, the following structure has been employed: An overview of the existing and related literature is discussed in section 2. Materials, data description and methodology are presented in section 3, while the results are discussed in section 4. In section 5, concluding remarks which incorporate the policy implications and recommendation for future study are presented.
2. Related Studies: A Synopsis
While there is an existing robust literature on environmental studies, recent studies have further considered micro investigations of the context along methodologies, sectoral, and along other concept paths. For instance, Kalmaz and Kirikkaleli (2019) compliment the Autoregressive Distributed Lag (ARDL) approach by using a wavelet coherence approach in modelling CO2 emissions in the emerging market; whereas the study of Eckelman and Sherman (2016) considerably exploits the impact of the US health care sector on public health and largely the environment. Because of the potential interconnectivity of the health care sector with industrial activities, Eckelman and Sherman (2016) investigate these potential negative effects by employing the Economic Input-Output Life Cycle Assessment (EIOLCA) modelling with the aid of the National Health Expenditures (NHE) over the period of 2003 to 2013. The study found that the environmental impact of the US health system is associated with the significantly high expenditures, high energy wastage, and high pollution burden. Eckelman and Sherman (2016) noted that these negative effects are significantly associated with the fractions of national air
pollution emissions which arises from the country‟s health care sector either through the manufacturing or disposal of health-related equipment, and among others.
In addition, Alola (2019 a & b) both illustrates the relationship of the US health care and migration policies with carbon emissions by employing the dynamic ARDL approach. Both studies found a significant impact of migration policy of the country on the emission level of CO2 over the period of 1990:Q1-2018:Q2 by employing the indexes of the categorized Economic Policy Uncertainty index. Specifically, Alola (2019a) found that migration index exerts a positive impact on environmental degradation (increasing the level of CO2) especially in the short-run and long-run, thus corroborating the fact that the US is the largest emitter of CO2. The study additionally found significant evidence and positive impact of the country‟s trade policy on CO2 emissions especially in the long-run. Similarly, Alola (2019b) indicates that there is a significant and positive impact of migration on CO2 emissions in both the long-run and short-run. Moreover, strands of literature have examined the nexus of renewable energy and carbon emissions in the context of environmental sustainability for different cases (Alola & Alola, 2018; Ben Jebli & Hadhri, 2018; Emir & Bekun, 2018; Dong, Sun & Dong, 2018; Sarkodie & Adams, 2018; Sinha & Shahbaz, 2018; Alola et al., 2019; Balsalobre-Lorente et al., 2019; Bekun, Alola & Sarkodie, 2019). In a recent study, Alola et al., 2019 employs the dynamic ARDL approach to observe the role of renewable energy consumption, immigration and real income on the environmental sustainability target of the Europe‟s three largest states. Similarly, Balsalobre-Lorente et al (2019) examined the role of renewable electricity by incorporating economic growth and natural resources in the concept of Environmental Kuznets Curve (EKC) for five European Union (EU-5) countries (Germany, France, Italy, Spain, and the United Kingdom) over the period between 1985–2016. Both studies significantly found that renewable energy
consumption further mitigates environmental degradation in the sets of panel of the large economies examined. Importantly, results from the illustrated studies above corroborates the earlier carbon emissions-renewable energy nexus study by Menyah and Wolde-Rufael (2010) which incorporates nuclear energy and economic growth of the US.
Using the wavelet transform framework, Raza et al. (2016) aim to explore the relationship between tourism development and environmental degradation in the United States over the period of 1996 to 2015. They find that tourism development positively contributes to the CO2 emission in the United States. In addition, they observe unilateral causality running from tourism development to CO2 emission. Mutascu (2018) investigates the relationship between CO2 emissions and trade openness in France using wavelet approach. Their findings reveal that there is no time-frequency dependency between CO2 emissions and trade openness in the short run but in the long-run the trade openness in France causes the gas emissions over the period 1960–2013. The study of Bilgili et al. (2016) uses the United States dataset covering the period of 1984 to 2015 aims to investigate the co-movement between biomass energy consumption on CO2 emissions. Their finding reveals that the possible significant influence of biomass usage on the CO2 emissions. In addition, Ahmi et al. (2015) explores the co-movement between GDP, CO2 emissions and energy consumption using time-varying causality approach for the G7 countries excluding Germany. Their finding indicates that (i) in Italy and Japan, changes in economic growth significantly leads to changes in energy consumption and CO2 emissions; there is feedback causality between energy consumption and CO2 emissions in the United States; (iii) unidirectional causality running from energy consumption to economic growth in Canada and from energy consumption to co2 emissions in France. Using wavelet-windowed cross correlation approach, Jammazi et al. (2015) explored the nexus between co2 emissions, economic growth
and energy consumption in the six oil-exporting countries from the GCC (Gulf Cooperation Council) region over the period 1980–2012. The study validates both the EKC as well as the feed-back hypothesis in the GCC countries.
3. Data and Methodology
3.1 Data descriptionThe present study uses the quarterly dataset for CO2 emission (CO2) and renewable consumption (REN) variables from the US Energy Information Administration while the dataset of Migration Index (MIG) and Healthcare Index (HEA) for the country is gathered from the Economic Policy Uncertainty2. The time period of the time series variables used in the empirical estimations covers the period of 1990Q1-2018Q2. The economic policy uncertainty index is a weighted
average of three types of underlying components: (i) First, it measures newspaper coverage of
policy-linked economic uncertainty, (ii) Second, it mirrors the number of federal tax code
provisions set to expire, and (iii) Third, it reflects disagreement among economic predictors
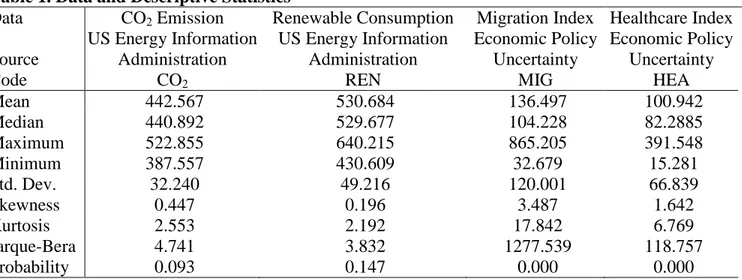
about government purchases and inflation. Table 1 presents the descriptive statistics and source
of the CO2, REN, MIG and HEA variables. As clearly seen in Table 1, the CO2 variable presents variation, ranging from 387 to 522. Furthermore, there is also variation in the REN, MIG, HEA variables, ranging from 430 to 640, from 32 to 865 and from 15 to 319, respectively. Table 1 also brings out information about the distribution of the variables by using Skewness, Kurtosis, and the Jarque-Bera techniques. The time series variables used in the tests are positively skewed. Whereas the distributions of the CO2 and REN variables have large tails (more peaked), the distribution of the MIG and HEA time series variables has small tails. Table 1 also presents that
2
the distribution of CO2, MIG variables, and HEA variables is normal, but the null hypothesis that REN has a normal distribution cannot be rejected with a χ2 = 3.832 (p-value = 0.147).
Table 1. Data and Descriptive Statistics
Data CO2 Emission Renewable Consumption Migration Index Healthcare Index Source US Energy Information Administration US Energy Information Administration Economic Policy Uncertainty Economic Policy Uncertainty
Code CO2 REN MIG HEA
Mean 442.567 530.684 136.497 100.942 Median 440.892 529.677 104.228 82.2885 Maximum 522.855 640.215 865.205 391.548 Minimum 387.557 430.609 32.679 15.281 Std. Dev. 32.240 49.216 120.001 66.839 Skewness 0.447 0.196 3.487 1.642 Kurtosis 2.553 2.192 17.842 6.769 Jarque-Bera 4.741 3.832 1277.539 118.757 Probability 0.093 0.147 0.000 0.000 3.2 Empirical methods
As an initial step, the order of integration of the CO2, REN, MIG and HEA variables is observed by Hylleberg, Engle, Granger and Yoo (1990) seasonal unit root tests (hereafter known as the HEGY test) and the Zivot-Andrews unit root test with a single structural break proposed by Zivot and Andrews (2002) before investigating the causal link between CO2 and REN, MIG and HEA using wavelet coherence, gradual shift causality and Toda-Yamamoto causality tests. Using the HEGY unit root test, the null hypothesis that the time series variable has a unit root at zero frequency (i.e. x, - Z,(l)) we simply perform a t-test on π1 equal to zero. To check a unit root for a bi-annual cycle root (i.e. x, - Z,,, (l)) a t-test on π2 equal to 0 is employed. Lastly, the joint F-test of π3=π4= 0 is tested to test for an annual cycle root (i.e. x, - Z,,,(l))3.
3
3.2.1 The wavelength approach
To obtain information about the time-frequency dependency between the CO2 and REN, MIG and HEA variables in the USA, the wavelet approach is used in the present study. The roots of the approach go back to Morlet Wavelet family which is developed by Goupillaud et al. (1984). It is well known that having non-stationary time series variables leads biased estimated outcomes if the traditional time domain causality approach is implemented. Furthermore, it is well known that time series variables in the fields of finance and economics are likely to experience a structural break(s), thus the outcomes of the traditional causality test with fixed parameters are likely to suffer (Pal and Mitra 2017). Contrary to time domain causality, “the key problem with a
standalone frequency domain approach, more specifically referred to as the Fourier transform,
is that by focusing solely on the frequency domain, the information from the time domain is
completely omitted” (Pal and Mitra 2017, p. 231). Hence, to eliminate these problems in the
estimations, wavelet coherence approach is used in this paper. The equation of a Wavelet - 𝔴 - is as follows; 𝔴( ) , p(t), t=1, 2, 3…., T.
Location (l) and frequency (g) are the main components of wavelet. Whereas to express a Wavelet`s particular location in time is a main mission of l parameter, f controls the distended Wavelet for localizing various frequencies. 𝔴l,g can initially be generated by converting 𝔴. The equation of this transformation is presented below:
𝔴 ( ) √ 𝔴 ( ) (1) The continuous wavelet is generated from 𝔴 as a function of l and k given time series data p(t) as follows:
The third equation below shows the redeveloped time series variable p(t) with the 𝔴 coefficient:
( ) ∫ *∫ | ( )| + (3)
The vulnerability of the times series is captured by the wavelet power spectrum (WPS). The equation of WPS is shown below:
( ) | ( )| (4)
To investigate the correlation between CO2 and REN, MIG and HEA variables in combined time-frequency based causalities, wavelet coherence technique is applied. The Cross Wavelet transform (CWT) of the time series is as follows;
( ) ( ) ̅̅̅̅̅̅̅̅̅̅ ( ) (5)
where Wp(l,g) and Wq(l,g) show the CWT of the CO2,REN, MIG and HEA variables, correspondingly. The squared Wavelet coherence is initially developed by Torrence and Compo (1998) and the equation of the squared Wavelet coherence is shown below:
( ) | ( ( ))|
( | ( )| ) ( | ( )| ) (6)
Whenever R2(l,g) gets close to 0 it suggests that there is no correlation among the time series variables but when R2(l,g) approaches 1, it indicates that there is a correlation among the variables at a particular scale, surrounded by a black line and depicted by a red color. However, the value of R2(k,f) does not provide any information about the sign of relationship among the variables. Thus, Torrence and Compo (1998) “postulated a means by which to detect the Wavelet coherence differences through indications of deferrals in the wavering of two time series” (Pal and Mitra 2017, p. 232-233). The wavelet coherence difference phase equation presents as follows;
( ) .
, ( (
, ( ( ))-/ (7)
where and denote an imaginary operator and a real part operator, respectively.
3.2.2 Granger causality and gradual shift causality tests
In addition to the wavelet coherence technique, Toda Yamamoto causality test of Toda and Yamamoto (1995) and gradual shift causality test of Nazlioglu et al. (2016) are employed to investigate the causal relationship between the CO2 and REN, MIG and HEA. Toda and Yamamoto (1995) modified the traditional Granger causality test by modified Wald test statistic (MWALT) to deal with bias and spurious models based on an augmented VAR. Moreover, Toda and Yamamoto causality test can be applied for the time series variables in different orders (zero, one, or two). Toda and Yamamoto causality test eliminates the need for co-integration tests. This study also uses newly developed Fourier Toda Yamamoto causality test proposed by Nazlioglu et al. (2016). The main innovation of this test against the Toda Yamamoto test is that the newly developed Fourier Toda Yamamoto causality test, which is also called “gradual shift causality test”, is able to account for structural shifts including gradual and smooth shifts in a causality analysis. In other words, the gradual shift causality test considers breaks using a Fourier approximation in a Granger causality analysis.
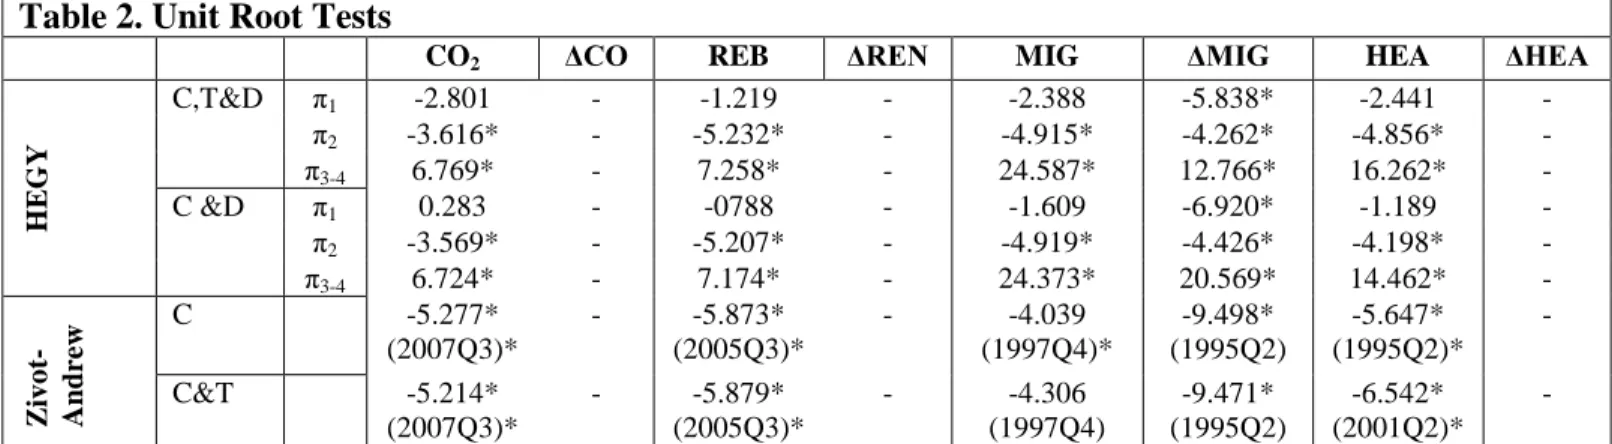
Table 2 presents the results of the HEGY test which reveals that the time series variables contain unit root at zero frequency since π1 = 0 cannot be rejected. However, the variables of CO2, REN, MIG and HEA contain no seasonal unit roots since the null hypotheses of π 2 = 0 and π 3 = π 4 = 0 can be rejected at 5% level. In other words, the variables appear stationary bi-annual frequency as well as an annual frequency. In addition, Table 2 reports the Zivot-Andrews unit root test with a single structural break for the time series variables with models with constant and
the models with constant and trend. The outcomes clearly reveal that while the integration of order of the CO2 REB, HEA variables seems I(0), in other words, they are stationary at levels, the order of the integration of the MIG variable is I(1), meaning that the variable is stationary at the first difference level.
Table 2. Unit Root Tests
CO2 ΔCO REB ΔREN MIG ΔMIG HEA ΔHEA
H E G Y C,T&D π1 -2.801 - -1.219 - -2.388 -5.838* -2.441 - π2 -3.616* - -5.232* - -4.915* -4.262* -4.856* - π3-4 6.769* - 7.258* - 24.587* 12.766* 16.262* - C &D π1 0.283 - -0788 - -1.609 -6.920* -1.189 - π2 -3.569* - -5.207* - -4.919* -4.426* -4.198* - π3-4 6.724* - 7.174* - 24.373* 20.569* 14.462* - Z iv o t-Andrew C -5.277* (2007Q3)* - -5.873* (2005Q3)* - -4.039 (1997Q4)* -9.498* (1995Q2) -5.647* (1995Q2)* - C&T -5.214* (2007Q3)* - -5.879* (2005Q3)* - -4.306 (1997Q4) -9.471* (1995Q2) -6.542* (2001Q2)* -
Note: C and C&T denote constant and constant and trend in the Zivot-Andrew unit root tests, respectively. C, T&D and C&D denote constant, trend and seasonal dummies and constant and seasonal dummies in HEGY test, correspondingly. Δ initial letter denotes the first difference of time series variables. * denote statistically significant at 0.05 level.
4. Results and discussion
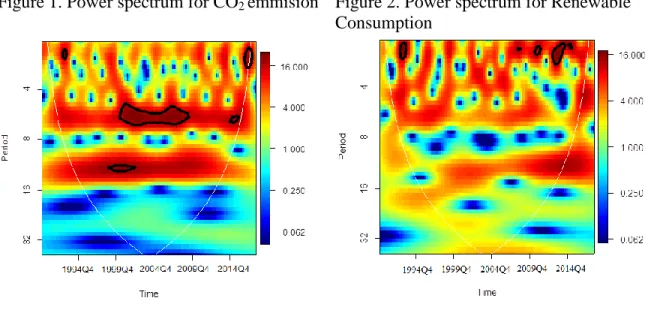
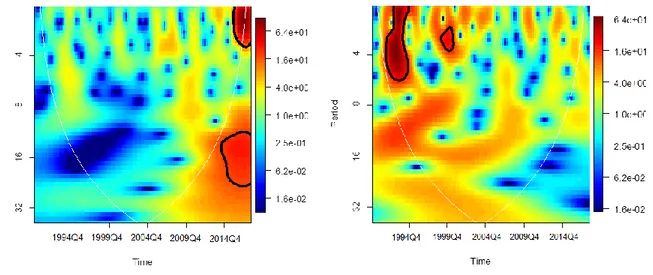
To capture the significant vulnerability of the time series variables used in the present paper, wavelet power spectrum approach is employed. In this study, a scale of 32 is selected since the dataset covers the period of 1990Q1 to 2018Q2 (114 quarterly observations). Figure 1-4 shows the power spectrum for the CO2, Renewable Consumption, immigration index and health care index, respectively. As clearly seen in Figure 1, at 8 period of scale, CO2 emission seems
significantly vulnerable between 1999 and 2009 since the thick black shape indicates a 5% significant level determined by Monte Carlo simulations. Evidently, the vulnerability of CO2 between this periods (1999-2009) is expectedly due to the build up to the series of intergovernmental climate discuss and arrangements that culminate into the latest 2015 Paris Agreement. For instance, the latest 2015 Paris Agreement was proceeded by the 1992 Kyoto Agreement and the comprehensive IPCC‟s Assessment Reports (the AR1-AR5) (United Nations Framework Convention on Climate Change 2016). In 1993, 2009, and 2013, renewable consumption was very vulnerable in the short-run which is potentially due to the dynamics in the energy policies of the government. Figure 3 shows that there is significant vulnerability between 2014 and 2018 at different frequencies, an obvious pointer to the country‟s immigration policy debacle (Alola 2019 a & b). Healthcare index seems only vulnerable at the period of 1992-1994 at 0-6 periods of scale, meaning that the debate and the eventual defeat of the US‟ health care reform leading to the country‟s 1992 general election potentially played a short-run effect
(Navarro 1995; Baker et al. 2006).
Figure 1. Power spectrum for CO2 emmision Figure 2. Power spectrum for Renewable Consumption
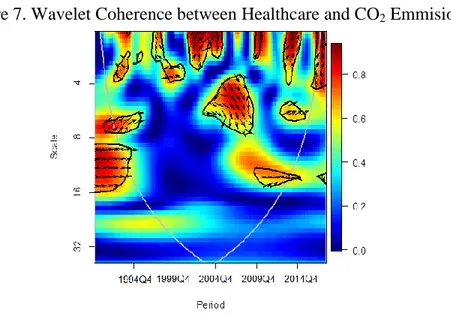
Figure 5-6-7 shows the findings from wavelet coherence (i) between Renewable Consumption and CO2 emmision;
(ii) between Immigration and CO2 emmision; (iii) between Healthcare and CO2 emmision, respectively. In the
Figure 5-6-7, the inside of the white cone-shaped line denotes the cone of influence while the thick black shape indicates a 5% significant level determined by Monte Carlo simulations. In addition, while colder colors (blue) indicate the lower interrelation between the time series variables, warmer colors (red) signify strong interrelation in the figures. When the arrows point to left (right), the time series variables are negatively (positively) and significantly correlated. The arrows pointing to up, right-up or left-down indicate that the second variable causes the first variable, while the arrows pointing at down, right-down or left-up show that the first variable causes the second variable.
As seen in Figure 1, the time series -Renewable Consumption and CO2 Emmision- are in phase in the short-run, indicating that there is positive and significant correlation among the time series variables, since energy demand is also increasing in line with renewable consumption. In addition, between 4 scale and 8 scale periods, Renewable Consumption causes CO2 Emmisions, while between 8 scale and 16 scale periods Renewable Consumption leading CO2 Emmision in the USA.
This results clearly reveal that there is feedback cuasality between Renewable Consumption and CO2 Emmision in the USA at different frequencies. This result could not be more expected considering the US‟ increasing expansion of shale gas production amid other energy policy changes (Steeves & Ouriques, 2016). As seen in the wavelet coherence outcomes, the weakest time-frequency dependence between estimated models is observed between Immigration and
CO2 Emmision. Figure 6 shows that only significant causality exists from immigration to CO2 emission in the U.S from 2008 to 2010. In addition, the findings also reveal that there is two-way causality between CO2 emission and Healthcare at different frequencies and time periods. Specifically, in the USA, the findings also reveal that there is two-way causality between CO2 emission and Healthcare at different frequencies and time periods. Specifically, in the USA, Healthcare significantly causes CO2 emission (i) between 1991 and 1996 at the medium term; (ii) between 2012 and 2014 in the short run. Moreover, Figure 7 also illustrates how CO2 emission is important for predicting Healthcare at 4 and 8 scale periods.
Figure 5. Wavelet Coherence between
Renewable Consumption and CO2 Emmision
Figure 6. Wavelet Coherence between Immigration and CO2 Emmision
Figure 7. Wavelet Coherence between Healthcare and CO2 Emmision
4.1 Robustness discussion
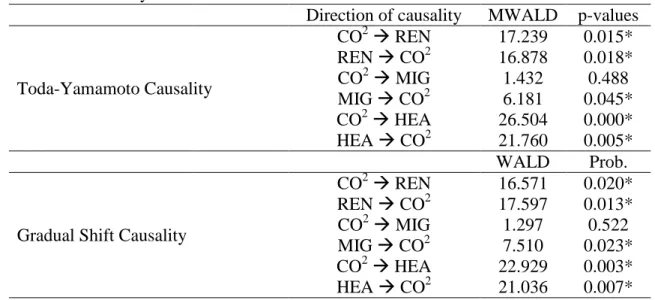
As robust tests for the findings of wavelet coherence approach, Toda-Yamamoto causality and gradual-shift causality tests are employed to explore the causal link between CO2 emission and renewable consumption, immigration and healthcare. The outcomes from these tests are reported in Table 3. As clearly seen, both tests confirm that there is feedback causality between CO2 emission and renewable consumption, implying that while CO2 emission is an important predictor for renewable consumption, renewable consumption causes CO2 emission in the USA
(Balsalobre-Lorente et al., 2018; Sarkodie & Adams, 2018; Shahbaz et al., 2019). The outcomes
also reveal that the null hypothesis that immigration does not cause CO2 emission can be rejected at 5% level. That is rational and clearly supports previous arguments of immigration-CO2 focus (Kolankiewicz and Camarota 2008; Alola 2019 a & b). Finally, the feedback causality between healthcare and CO2 emission at different frequencies also confirms the outcomes of Toda-Yamamoto causality and gradual-shift causality tests, since the null hypothesis that (i) CO2
emission does not cause healthcare and (ii) healthcare does not cause CO2 emission can be rejected at 5% level.
Table 3: Causality tests
Direction of causality MWALD p-values
Toda-Yamamoto Causality CO2 REN 17.239 0.015* REN CO2 16.878 0.018* CO2 MIG 1.432 0.488 MIG CO2 6.181 0.045* CO2 HEA 26.504 0.000* HEA CO2 21.760 0.005* WALD Prob.
Gradual Shift Causality
CO2 REN 16.571 0.020* REN CO2 17.597 0.013* CO2 MIG 1.297 0.522 MIG CO2 7.510 0.023* CO2 HEA 22.929 0.003* HEA CO2 21.036 0.007* Note: indicates the direction of causality. The optimal lag is selected using SIC. * denote statistically significant at 5% levels
5. Conclusion and Policy direction
Although numerous number of studies have investigated the impact and determinants of CO2 emission and renewable consumption in the developed and developing countries, the time-frequency dependency of CO2 emission in the perspectives of renewable consumption, immigration and healthcare is being employed here for the first time. The present paper attempt to fill this gap in the literature, in particular for the case of the US, where (i) the gross greenhouse gas emissions have always surged by an average of 1.3% since 1990 (United States Environmental Protection Agency, EPA, 2019) and as high as 3.1% increase in CO2 emissions in 2018 (International Energy Agency, IEA, 2019), (ii) other interdisciplinary factors vis-à-vis health and social challenges associated with immigration and healthcare are now added to the environmental persepective that have continued to be the porn for political gains/loss in the
United States, (iii) while lastly, the lack of commitment to the Climate Change Agreement such as the Paris Agreement 2015 (The White House, TWH, 2019) might be a potential setback to the country‟s carbon abatement policy. This study contributes by performing the recently developed and superior econometrics techniques, namely, „gradual shift causality (proposed by Nazlioglu et al. (2015)) and Toda-Yamamoto causality (proposed by Toda and Yamamoto (1995)) tests to capture the causal link between the variables. In addition, to capture the long-term and short-term causal link between the variables in the US, wavelet coherence approach is employed in this study. The approach simply provides information on dynamic correlations and causality over time and for different time scales. The findings of the study reveal that (i) there is a significant vulnerability between 1999 and 2008 for CO2 emission in the US; (ii) a two-way causal linkage observed between CO2 emission and renewable consumption at different scales, while CO2 emission and renewable consumption are in phase in the short-run; (iii) between 2008 and 2010, a unidirectional causality is detected from immigration to CO2 emission; (iv) there is feedback causality between CO2 emission and healthcare at different frequencies and time periods. It is worth to mention that the results of time domain causality tests provided supportive evidence for the outcomes of the wavelet coherence approach. Although the present study provides strong empirical evidence, further studies should be conducted for other developed countries especially with similar environmental, social, and economic related issues.
However, the current study is designed to proffer the following concrete policy directions for policymakers especially in environmental and socio-economic departments of governance, and toward driving the sustainable development goals (SDGs). Firstly, considering that natural gas consumption is vastly displacing coal consumption in the electric power sector in the US (United States Energy Information Administration 2019), not to mention the impact of renewable
sources, it is expected that such energy portfolio diversification mechanism should rather be further driven with strategic plans. In doing so, the country is not only attempting to meeting the energy demand but also providing afforedable and cleaner energy, thus driving toward attaining the SDGs goals. Secondly, since the decline in CO2 emissions in 2017 is reportedly due to the utilization of less carbon-intensive generation sources such as biofuels and other non-hydroelectric renewable energy sources (United States Energy Information Administration 2019), more investment in renewable energy technologies in the United States is a significant path of attaining efficient energy production. In so doing, policies such as tax or tariffs on renewable technologies could be further strengthened to favour the increased utilization and production of alternative sources of energy. Lastly, considering that the study found significant evidence of time-frequency causal relationship of the variables of interest, government policies should be sensitive and targeted toward producing a counter-balance mechanism especially that mitigate CO2 emissions. For instance, a more encompassing perspectives that incorporate the environmental challenges such as the climate change could be considered in drafting the country‟s immigration and healthcare policies. In this light, and toward the attaining the SDGs the policies of the government would be armed with the effective approache that is void of producing social, health, and environmental counter effects.
R
eference
Ajmi AN, Hammoudeh S, Nguyen DK, Sato JR. On the relationships between CO2 emissions, energy consumption and income: the importance of time variation. Energy Economics. 2015 May 1;49:629-38.
Alola AA. (2019a). The trilemma of trade, monetary and immigration policies in the United States: Accounting for environmental sustainability. Science of The Total Environment.
658:260-7.
Alola AA. (2019b). Carbon emissions and the trilemma of trade policy, migration policy and health care in the US. Carbon Management 15:1-0.
Alola AA, Alola UV. (2018). Agricultural land usage and tourism impact on renewable energy consumption among Coastline Mediterranean Countries. Energy & Environment. 29(8):1438-54.
Alola AA, Yalçiner K, Alola UV, Saint Akadiri S. (2019). The role of renewable energy, immigration and real income in environmental sustainability target. Evidence from Europe largest states. Science of The Total Environment. 674:307-15.
Baker DW, Sudano JJ, Durazo-Arvizu R, Feinglass J, Witt WP, Thompson J. (2016). Health insurance coverage and the risk of decline in overall health and death among the near elderly, 1992-2002. Medical care. 1:277-82.
Bekun FV, Alola AA, Sarkodie SA. (2019). Toward a sustainable environment: Nexus between CO2 emissions, resource rent, renewable and nonrenewable energy in 16-EU countries.
Science of The Total Environment. 657:1023-9.
Balsalobre-Lorente D, Shahbaz M, Roubaud D, Farhani S. (2018). How economic growth, renewable electricity and natural resources contribute to CO2 emissions? Energy Policy. 113:356-67.
Ben Jebli M, Hadhri W. (2018). The dynamic causal links between CO2 emissions from transport, real GDP, energy use and international tourism. International Journal of
Bilgili F, Öztürk İ, Koçak E, Bulut Ü, Pamuk Y, Muğaloğlu E, Bağlıtaş HH. The influence of biomass energy consumption on CO 2 emissions: a wavelet coherence approach. Environmental Science and Pollution Research. 2016 Oct 1;23(19):19043-61.
British Petroleum (BP, 2018). BP Statistical Review of World Energy.
https://www.bp.com/en/global/corporate/energy-economics/statistical-review-of-world-energy/downloads.html. (Retrieved 04 May 2019).
Dong K, Sun R, Dong X. (2018). CO 2 emissions, natural gas and renewables, economic growth:
Assessing the evidence from China. Science of the Total Environment. 640:293-302.
Eckelman MJ. Sherman, J. (2016). Environmental impacts of the US health care system and effects on public health. PloS one, 11(6), e0157014.
Emir F, Bekun FV. (2018). Energy intensity, carbon emissions, renewable energy, and economic
growth nexus: new insights from Romania. Energy & Environment.
0958305X18793108.
Goupillaud P, Grossmann A, Morlet J. (1984). Cycle-octave and related transforms in seismic signal analysis. Geoexploration. 23(1):85-102.
Hegerl GC, Cubasch U. Greenhouse gas induced climate change. Environmental Science and Pollution Research. 1996 Jun 1;3(2):99-102.
Hylleberg S, Engle RF, Granger CW, Yoo BS. (1990). Seasonal integration and cointegration.
Journal of econometrics. 44(1-2):215-38.
International Energy Agency (IEA, 2019). https://www.iea.org/geco/emissions/. (Retrieved 14 May 2019).
International Renewable Energy Agency (IRENA, 2015). Renewable Energy Prospects: United States of America. https://www.irena.org/publications/2015/Jan/Renewable-Energy-Prospects-United-States-of-America. (Retrieved 04 May 2019).
International Organization for Migration (IOM, 2019). https://www.iom.int/migration-and-climate-change-0. (Retrieved 04 May 2019).
Jammazi R, Aloui C. Environment degradation, economic growth and energy consumption nexus: A wavelet-windowed cross correlation approach. Physica A: Statistical Mechanics and Its Applications. 2015 Oct 15;436:110-25.
Jotzo F, Depledge J, Winkler H. (2018). US and international climate policy under President Trump.
Kalmaz DB, Kirikkaleli D. (2019). Modeling CO 2 emissions in an emerging market: empirical finding from ARDL-based bounds and wavelet coherence approaches. Environmental
Science and Pollution Research. 26(5):5210-20.
Kolankiewicz LJ, Camarota SA. (2008). Immigration to the United States and World-Wide Greenhouse Gas Emissions. Washington, DC: Center for Immigration Studies
Menyah K, Wolde-Rufael Y. (2010). CO2 emissions, nuclear energy, renewable energy and economic growth in the US. Energy Policy. 38(6):2911-5.
Mutascu M. A time-frequency analysis of trade openness and CO2 emissions in France. Energy policy. 2018 Apr 1;115:443-55.
National Aeronautics and Space Administration (NASA) 2019. https://climate.nasa.gov/vital-signs/carbon-dioxide/. (Retrieved 04 May 2019).
National Renewable Energy Laboratory (NREL, 2019). Renewable Electricity Futures Study.
Natural Resources Defense Council (NRDC, 2019). https://www.nrdc.org/onearth/climate-change-already-driving-mass-migration-around-globe. (Retrieved 04 May 2019).
Navarro V. The politics of health care reform in the United States, 1992–1994: A historical review. 1995. International Journal of Health Services. 25(2):185-201.
Nazlioglu S, Gormus NA, Soytas U. (2016). Oil prices and real estate investment trusts (REITs): Gradual-shift causality and volatility transmission analysis. Energy Economics. 60:168-75.
Pal D, Mitra SK. (2017). Time-frequency contained co-movement of crude oil and world food prices: A wavelet-based analysis. Energy Economics. 62:230-9.
Raza SA, Sharif A, Wong WK, Karim MZ. Tourism development and environmental degradation in the United States: Evidence from wavelet-based analysis. Current Issues in Tourism. 2017 Dec 10;20(16):1768-90.
Ryu J, Kim K, Oh M, Shin J. Why environmental and social benefits should be included in cost-benefit analysis of infrastructure? Environmental Science and Pollution Research. 2019 May 26:1-1.
Saleem H, Jiandong W, Aldakhil AM, Nassani AA, Abro MM, Zaman K, Khan A, Hassan ZB, Rameli MR. Socio-economic and environmental factors influenced the United Nations healthcare sustainable agenda: evidence from a panel of selected Asian and African countries. Environmental Science and Pollution Research. 2019 May 1;26(14):14435-60.
Sarkodie SA, Adams S. (2018). Renewable energy, nuclear energy, and environmental pollution: Accounting for political institutional quality in South Africa. Science of the total
environment. 643:1590-601.
Shahbaz M, Balsalobre-Lorente D, Sinha A. (2019). Foreign direct Investment–CO2 emissions nexus in Middle East and North African countries: Importance of biomass energy consumption. Journal of Cleaner Production. 217:603-14.
Steeves BB, Ouriques HR. (2016). Energy security: China and the United States and the divergence in renewable energy. Contexto Internacional. 38(2):643-62.
The Guardian. (2019). How Climate Change is pushing Central American migrants to the US.
https://www.theguardian.com/commentisfree/2019/apr/06/us-mexico-immigration-climate-change-migration.
The New York Times. (2019). Central American Farmers heads to the U.S., fleeing Climate
Change. https://www.nytimes.com/2019/04/13/world/americas/coffee-climate-change-migration.html. (Retrieved 14 May 2019).
The White House (TWH). (2017). Statement by President Trump on the Paris Climate Accord.
https://www.whitehouse.gov/briefings-statements/statement-president-trump-paris-climateaccord (Retrieved 14 May 2019).
Toda HY, Yamamoto T. (1995). Statistical inference in vector Autoregressions with possibly integrated processes. Journal of econometrics. 66(1-2):225-50.
United Nations Framework Convention on Climate Change (2016). Climate - Get the Big Picture. https://unfccc.int/resource/bigpicture/#content-the-paris-agreement. Accessed 20 August 2019
United States Environmental Protection Agency. (EPA, 2019).
https://www.epa.gov/ghgemissions/sources-greenhouse-gas-emissions. (Retrieved 14 May 2019).
Yang J, Chen ML, Fu CY, Chen XD. Environmental policy, tax, and the target of sustainable development. Environmental Science and Pollution Research. 2019 Apr 29:1-0.
Zivot E, Andrews DW. (2002). Further evidence on the great crash, the oil-price shock, and the unit-root hypothesis. Journal of Business & Economic Statistics. 20(1):25-44.