INCREASE IN UNEMPLOYMENT CONTINUES
Seyfettin Gürsel* Gökçe Uysal∗∗ ve Ayşenur Acar∗∗∗Abstract
Seasonally adjusted labor market data shows that non-agricultural unemployment increased from 11.6 percent in October 2012 to 11.8 percent in November 2012. Despite the strong increase in non-agricultural employment, stronger increase in non-agricultural labor force leads to an increase in non-agricultural unemployment. Slow but sustainable increasing trend in non-agricultural unemployment that we have been observing since February 2012 continues. Data released by Kariyer.net shows that the slow increase in unemployment might continue in the next period.
Labor market highlight
This month, our analysis on the structural characteristics of labor market focuses on the relationship between growth and employment in different sectors. The results show that this relationship is tight in manufacturing and service. We observe increases in labor productivity in both two sectors after the global economic crisis. On the other hand, employment in construction did not decline during the crisis despite the continuous fall in value added in construction. After the crisis, both value added and employment in construction increase in a parallel manner. In other words, the negative productivity shock that arose in the crisis seems to be permanent. This may be due to a measurement error in construction.
Increase in non-agricultural labor force has been over 1 million
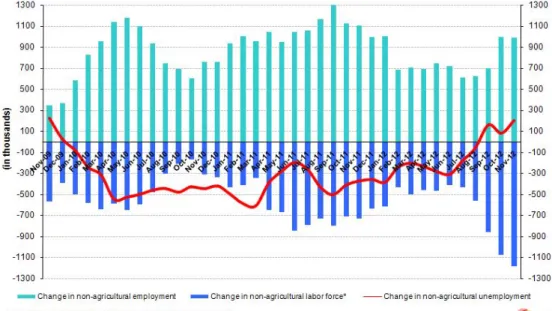
According to the data released by TurkSTAT, non-agricultural labor force increased by 1 million 188 thousand (5.8 percent), the non-agricultural employment increased by 987 thousand (5.4 percent) and non-agricultural
unemployment increased by 201 thousand to 2 million 533 thousand persons in the period of November 2012 on a year-on-year basis (Figure 1). Despite the strong increase in non-agricultural employment, an increase of over 1 million in the non-agricultural labor force leads to an increase in non-agricultural unemployment
Figure 1 Year-on-year changes in non-agricultural labor force, employment and unemployment
Source: TurkSTAT, Betam
* Prof. Dr. Seyfettin Gürsel, Betam, Director, [email protected]
∗∗ Yrd. Doç. Dr. Gökçe Uysal, Betam, Vice Director, [email protected] ∗∗∗ Ayşenur Acar, Betam, Research Assistant, [email protected]
Labor Market Outlook:
February 2013
Increasing trend in seasonally adjusted non-agricultural unemployment continues
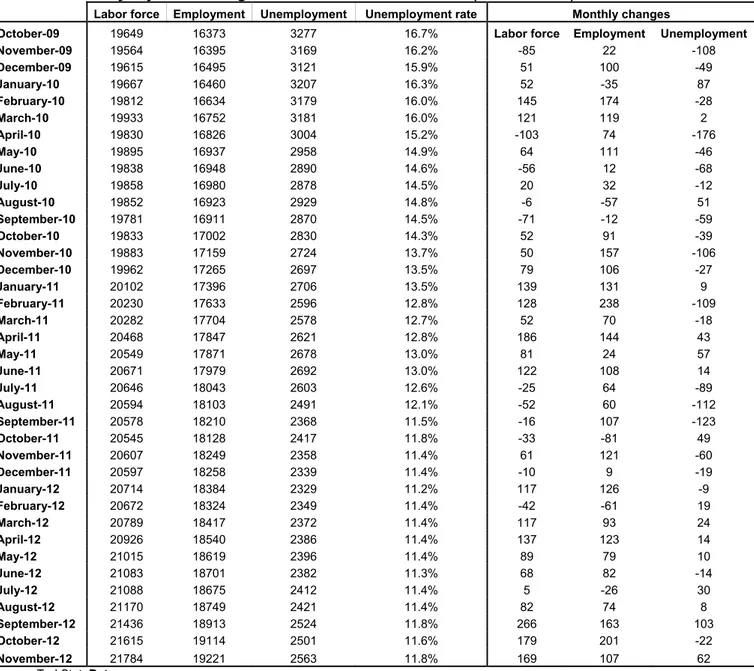
According to seasonally adjusted data, the non-agricultural labor force increased by 169 thousand to reach 21 million 784 thousand in the period of November 2012 compared to the period of October 2012 (Figure 2, Table 1). Non-agricultural employment increased by107 thousand to reach 19 million 221 thousand. Consequently, the number of persons employed in non-agricultural sectors decreased by 62 thousand and non-agricultural unemployment rate increased from 11.6 percent to 11.8 percent.
Figure 2 Seasonally adjusted non-agricultural labor force, employment and unemployment
Source: TurkStat, Betam
According to Kariyer.net data, increase in non-agricultural unemployment continues Application per vacancy calculated by using series released by Kariyer.net indicates that the increase non-agricultural unemployment rate will continue in the period of December 2012.1
Figure 1 Seasonally adjusted non-agricultural unemployment rate and application per vacancy
Source: Kariyer.net, TurkStat, Betam
1 Betam has been calculating application per vacancy using series released by Kariyer.net for a while. Seasonal and calendar adjustment
procedure is applied to application per vacancy series. A decrease in applications per vacancy may be caused by an increase in vacancies or by a decrease in the number of applications. An increase in vacancies signals economic growth while decreasing number of applications indicates a decrease in number of people looking for a job.
Increase in service employment continues
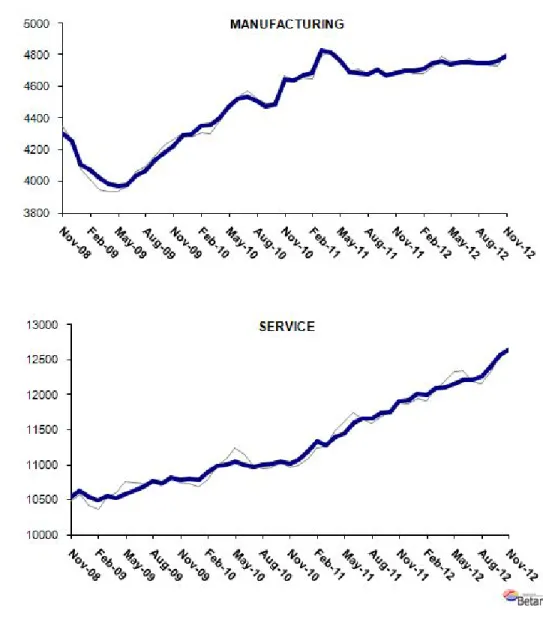
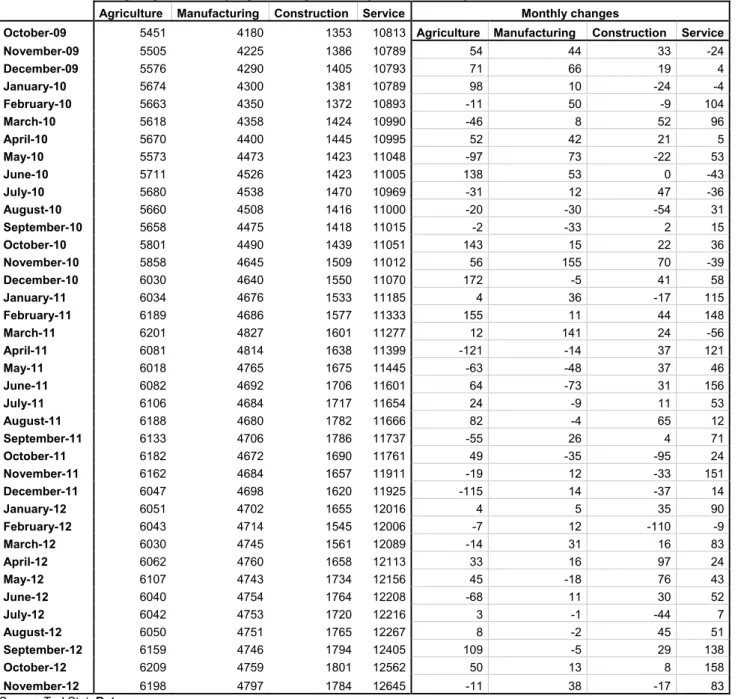
Seasonally adjusted data shows that the increase in service employment has been continuing in the period of November 2012 (Table 2, Figure 4).2 Manufacturing employment increased by 38 thousand, while construction employment decreased by 17 thousand in this period.
2 Seasonal adjustment procedure is applied to each sector of employment series separately. Hence the sum of these series may differ from the
Figure 2 Employment by sectors (in thousands)3
Source: TurkStat, Betam
LABOR MARKET HIGLIGHT
Decoupling between economic growth and employment
There is a relationship between economic growth and employment due to changes in the concentration of capital and in labor productivity. GDP growth (increase in value added) has been moving over employment growth with some exceptions. GDP growth is higher than employment growth when there are increases in the concentration of capital and/or labor productivity. Hence, value added per employee increases continuously, which governs the dynamics of growth. However, employment might not follow declines in GDP during crisis periods. If firms predict that contraction in demand and hence in production will not last long, i.e. if they predict that the crisis will be temporary; they may restrict the number of layoffs or even not lay off workers at all. Note that firing is costly due to factors such as severance pay, loss of experienced employees etc. Also, the firms may lower hours of work and wages to temper the costs of not being able to reduce employment following a decline in production.
The relationship between GDP growth and employment varies across sectors. In order to understand the sectoral relationships, we seasonally adjust the sectoral Gross Domestic Product series (calculated using the product approach) and let the first quarter of 2005 be the base quarter (100). We present indices and figures in Figure A and Table A.
As seen in Figure A, there is no clear relationship between growth and employment in agriculture due to the dominance of family farms in agricultural production. However, the relationship in manufacturing is tight. Both before and after the crisis, value added increased at a faster speed than employment, indicating an increase in labor productivity in manufacturing. During the crisis, employment fell following a decrease in value added.
Looking at the service sector, we observe an increase in labor productivity before the crisis, similar to the one in the manufacturing sector. During the crisis, value added in service decreases, while employment is stagnant. We think that this is extraordinary. The underlying reason could be that the added value of self-employed women, which increased during the crisis, are not reflected in national accounts. Other reasons need to be investigated. The value added index of the service sector has been consistently increasing since the first quarter of 2009. It
increased from 113.1 to 141.6 (25 percent), while the employment index of the service sector increased from 111.7 to 129.8 percent (an increase by 16 percent). This indicates that labor productivity increased, just like it did before the crisis.
Developments in construction sector are very different from other sectors and very surprising indeed. Normally, we would expect a similar relationship in construction to the one in manufacturing. Hiring costs for unskilled workers employed in the construction sector are relatively low. When there is an increase in demand, employment may not decrease at best. However, if there is an increase in demand, it is not economically normal that employment increases. Obviously, there was an anomaly in the construction sector during the 2008-09 crisis. Value added in construction decreased continuously from the 3th quarter of 2007 to the 3th quarter of 2009. During this period, the value added index of the construction sector decreased from 129.2 to 95.6 (25.3 percent). We would expect a large negative impact on employment especially given that the contraction lasted for two years. However, construction employment increases slightly (1.4 percent) in this period. Consequently, employment index in the construction sector hovers above the value added index since the first quarter of 2009. Following this period, the value added index increased by 29 percent, while the employment index increased by 28 percent from the fourth quarter of 2009 to the thirdof 2012. In other words, negative productivity shock that happened during the crisis seems to be permanent rather than temporary, which obviously raises red flags. Also, while value added in construction has been stagnant during the past couple periods, there are sudden increases and decreases in employment. Consequently, we think that there could be a measurement error in construction employment. Due to the small share of construction in overall employment (7 percent), this potential measurement error will not cause changes in the overall employment and unemployment figures. We still think that it would be a good idea for TUIK to look into employment series in construction more carefully.
Figure A Indices of sectoral growth and employment: 2005(1)-2012(3) (Seasonally adjusted, 2005(1)=100)
Source: Gross Domestic Product, Product Approach (Constant Prices Base 1998), Household Labor Force Survey ; TukStat, İndex Calculations; Betam
Table A Indices of sectoral growth and employment: 2005(1)-2012(3) (Seasonally adjusted, 2005(1)=100)
Source: Gross Domestic Product, by Product Approach (Constant Prices 1998 Base), Household Labor Force Survey ; TukStat, İndex Calculations; Betam
Table 1 Seasonally adjusted non-agricultural labor force indicators (in thousands)
Labor force Employment Unemployment Unemployment rate Monthly changes
October-09 19649 16373 3277 16.7% Labor force Employment Unemployment
November-09 19564 16395 3169 16.2% -85 22 -108 December-09 19615 16495 3121 15.9% 51 100 -49 January-10 19667 16460 3207 16.3% 52 -35 87 February-10 19812 16634 3179 16.0% 145 174 -28 March-10 19933 16752 3181 16.0% 121 119 2 April-10 19830 16826 3004 15.2% -103 74 -176 May-10 19895 16937 2958 14.9% 64 111 -46 June-10 19838 16948 2890 14.6% -56 12 -68 July-10 19858 16980 2878 14.5% 20 32 -12 August-10 19852 16923 2929 14.8% -6 -57 51 September-10 19781 16911 2870 14.5% -71 -12 -59 October-10 19833 17002 2830 14.3% 52 91 -39 November-10 19883 17159 2724 13.7% 50 157 -106 December-10 19962 17265 2697 13.5% 79 106 -27 January-11 20102 17396 2706 13.5% 139 131 9 February-11 20230 17633 2596 12.8% 128 238 -109 March-11 20282 17704 2578 12.7% 52 70 -18 April-11 20468 17847 2621 12.8% 186 144 43 May-11 20549 17871 2678 13.0% 81 24 57 June-11 20671 17979 2692 13.0% 122 108 14 July-11 20646 18043 2603 12.6% -25 64 -89 August-11 20594 18103 2491 12.1% -52 60 -112 September-11 20578 18210 2368 11.5% -16 107 -123 October-11 20545 18128 2417 11.8% -33 -81 49 November-11 20607 18249 2358 11.4% 61 121 -60 December-11 20597 18258 2339 11.4% -10 9 -19 January-12 20714 18384 2329 11.2% 117 126 -9 February-12 20672 18324 2349 11.4% -42 -61 19 March-12 20789 18417 2372 11.4% 117 93 24 April-12 20926 18540 2386 11.4% 137 123 14 May-12 21015 18619 2396 11.4% 89 79 10 June-12 21083 18701 2382 11.3% 68 82 -14 July-12 21088 18675 2412 11.4% 5 -26 30 August-12 21170 18749 2421 11.4% 82 74 8 September-12 21436 18913 2524 11.8% 266 163 103 October-12 21615 19114 2501 11.6% 179 201 -22 November-12 21784 19221 2563 11.8% 169 107 62
Table 2 Seasonally adjusted employment by sector (in thousands)
Agriculture Manufacturing Construction Service Monthly changes
October-09 5451 4180 1353 10813 Agriculture Manufacturing Construction Service
November-09 5505 4225 1386 10789 54 44 33 -24 December-09 5576 4290 1405 10793 71 66 19 4 January-10 5674 4300 1381 10789 98 10 -24 -4 February-10 5663 4350 1372 10893 -11 50 -9 104 March-10 5618 4358 1424 10990 -46 8 52 96 April-10 5670 4400 1445 10995 52 42 21 5 May-10 5573 4473 1423 11048 -97 73 -22 53 June-10 5711 4526 1423 11005 138 53 0 -43 July-10 5680 4538 1470 10969 -31 12 47 -36 August-10 5660 4508 1416 11000 -20 -30 -54 31 September-10 5658 4475 1418 11015 -2 -33 2 15 October-10 5801 4490 1439 11051 143 15 22 36 November-10 5858 4645 1509 11012 56 155 70 -39 December-10 6030 4640 1550 11070 172 -5 41 58 January-11 6034 4676 1533 11185 4 36 -17 115 February-11 6189 4686 1577 11333 155 11 44 148 March-11 6201 4827 1601 11277 12 141 24 -56 April-11 6081 4814 1638 11399 -121 -14 37 121 May-11 6018 4765 1675 11445 -63 -48 37 46 June-11 6082 4692 1706 11601 64 -73 31 156 July-11 6106 4684 1717 11654 24 -9 11 53 August-11 6188 4680 1782 11666 82 -4 65 12 September-11 6133 4706 1786 11737 -55 26 4 71 October-11 6182 4672 1690 11761 49 -35 -95 24 November-11 6162 4684 1657 11911 -19 12 -33 151 December-11 6047 4698 1620 11925 -115 14 -37 14 January-12 6051 4702 1655 12016 4 5 35 90 February-12 6043 4714 1545 12006 -7 12 -110 -9 March-12 6030 4745 1561 12089 -14 31 16 83 April-12 6062 4760 1658 12113 33 16 97 24 May-12 6107 4743 1734 12156 45 -18 76 43 June-12 6040 4754 1764 12208 -68 11 30 52 July-12 6042 4753 1720 12216 3 -1 -44 7 August-12 6050 4751 1765 12267 8 -2 45 51 September-12 6159 4746 1794 12405 109 -5 29 138 October-12 6209 4759 1801 12562 50 13 8 158 November-12 6198 4797 1784 12645 -11 38 -17 83