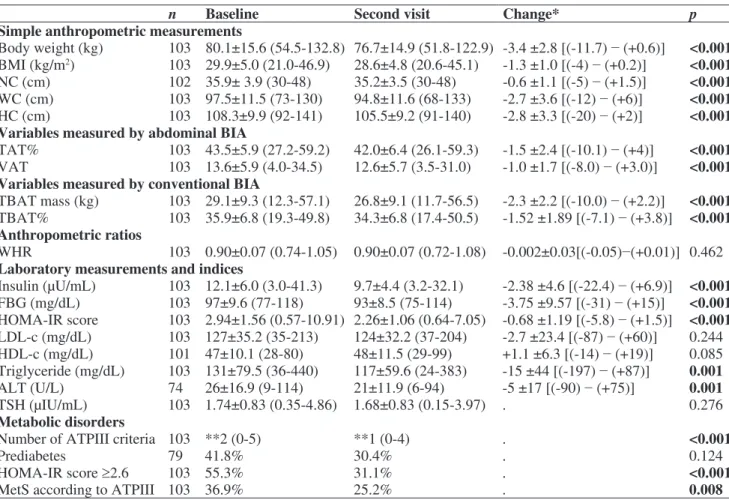
ABDOMINAL BIOELECTRIC IMPEDANCE FOR FOLLOW-UP OF DIETERS: A PROSPECTIVE STUDY
Tam metin
Şekil

Benzer Belgeler
We would like to thank the authors for their comments on our article entitled "An increase in epicardial adipose tissue is strong- ly associated with carotid intima-media
They have assessed the total EAT volume in patients with plaques in differ- ent coronary arteries and found out that patients with multi- vessel, left anterior descending and
(1) titled “Does epicardial adipose tissue volume provide information about the presence and localization of coronary artery disease?” published in the May 2015 issue of Anatol
Quantification of epicardial and peri- coronary fat using cardiac computed tomography; reproducibility and relation with obesity and metabolic syndrome in patients suspected
BMI Body mass index BP Blood pressure CRP C-reactive protein EAT Epicardial adipose tissue FFA Free fatty acids HDL High-density lipoprotein LDL Low-density lipoprotein LV
There was no relationship found between sleep quality and physical activity status of women workers without shift (p=0.861, p>0.05), but the number of non-shift worker women
In the present study, a strong positive correlation was determined between waist circumference and BMI in obese DM females, whereas moderate positive correlation
Preoperative view of a 22-year-old patient with gyneco- mastia who was treated by suction-assisted lipectomy combined with subcutaneous mastectomy (above; left and below; left); CT
