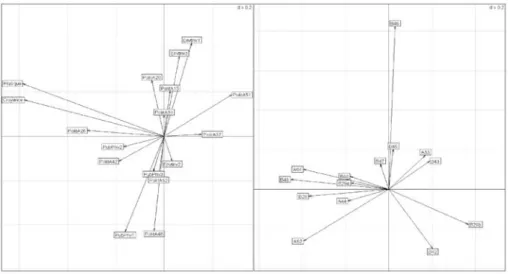
the x-axis). This factor can be called the ‘axis of confidence in science’. The second fac-tor (right side of the y-axis), instead, shows much more pragmatic and active attitudes (for instance being in favour of environment protection), which are opposed to more theoretic positions supporting democratic right and equilibrium between private and public. This axis can be named as ‘axis of theory and practice in politics’.
Looking the image on right side we can consider some simple correspondence. For instance, on the left side we find positions strongly related to creationism, while on the upper side there is a correspondence between updating biological knowledge and activism in politics.
Figure 5 Factorial plan of the co-inertia analysis between the groups of variables on evolution
and politics 4. CONCLUSION
The analysis of the Italian data confirms that conceptions supporting the theory of evolution or creationism are shaped along a wide range of positions in which reli-gious beliefs represent only one of many interacting components. Italian pre-service and in-service teachers believing in God tend to have a creationist position, but there is no correlation between religious beliefs and a precise knowledge on evolutionary processes: they are independent components. Moreover, supporters of the theory of evolution are not completely identifiable with the conception that human species emerged by chance, and on the opposite side, creationists do not all believe that hu-man species was the aim of evolution.
The system of values and beliefs represented in the Italian sample of in-service and pre-service teacher does not seem to be particularly influenced by specific knowledge on the evolution process and this represent a characteristics of the Italian results. This is shown in a first explorative analysis carried out within the Biohead project, which compare 12 countries, among which Italy [Munoz, Quessada, Clément]. In this analy-sis teachers who had a higher level of specific biological knowledge tend to be more
frequently supporters of the theory of evolution. The co-inertia analysis has shown that there is a relationship between involvement in politics and updated biological knowledge.
In the future a comparison of the questionnaire results with the analysis of text-books carried out within the Biohead project can draw further insight in the complex process of shaping conceptions as well as on the interactions of different components influencing this process.
This complexity allows us to reflect on the importance of making teachers aware of these interacting components both at personal level and within the classroom. BIBLIOGRAPHY
Clèment Pierre, Carvalho S. Graça, (2007). Biology, Health and Environmental Edu-cation for better Citizenship: teachers’ conceptions and textbook analysis in 19 countries. In: XIII World Congress of Comparative Education Societies, & AFEC, Sarajevo, Sept. 2007.
Clemènt, P., Hovart, S. (2000). Environmental Education: analysis of the didactic transposition nd of the conceptions of teachers. In: H. Bayerhuber & J. Mayer. State of the art of empirical research on environmental education. Münster: Wax-mann Verlag, p. 77-90.
Michael Greenacre (2007). Correspondence Analysis in Practice, Second Edition. Chap-man & Hall/CRC, Boca Raton, FL.
Munoz François, Laurent Charline (2007). National analyses of the Biohead-Citizen questionnaire. Methodological leaflet, October Available at: http://projectos.iec. uminho.pt/projeuropa/
Munoz François, Quessada Marie-Pierre, Clèment Pierre (2007). Des analyses statis-tique multivarièes pour traiter les donnèes issues de questionnaires: Conceptions d’enseignants et futurs ensegnants de douze pays sur l’Evolution. Available at: http://projectos.iec.uminho.pt/projeuropa/
PRE-SERVICE PHYSICAL SCIENCE STUDENTS’ INFLUENCE
OF SCIENCE, RELIGION AND INDIGENOUS KNOWLEDGE IN
THE TEACHING OF COSMOLOGY AT THE FET LEVEL
Nadaraj Govender & Herby GovindenUniversity of KwaZulu-Natal, Edgewood Campus Private Bag X03 Ashwood 3605 E-mail: [email protected]
t A
bstrActThis paper examines pre-service students’ conceptions of science, religion and culture with reference to the teaching of cosmology at the FET level in South Africa. The problems already encountered in the learning of new concepts in-troduced during the teaching of Astronomy are briefly referred to. Undoubt-edly, the teaching and learning of Cosmology by both students and learners will experience similar difficulties and pose new challenges in the light of dif-ferent cosmological worldviews of the communities in which they would serve. The transition from cultural, indigenous traditional viewpoints and religious beliefs to the world of science and cosmology poses particular challenges for final year teacher trainees entering classrooms with open-minded learners. An attempt is made to give a visual indication of how the three aspects of knowl-edge, namely science, religion and culture may be dealt with from both the teacher’s and learner’s viewpoint.
Key Words Cosmology, Science, Religion, Indigenous knowledge, Culture, pre-service, students’ conceptions
1. INTRODUCTION
The new National Curriculum Statement for the Physical Sciences (Grades 10 - 12) in South Africa includes Cosmology and Astronomy as contexts relevant to the teach-ing of concepts in Physics (DOE, 2003). As the traditional teachteach-ing of the Physical Sciences did not include these contexts, studies have shown that in-service Physical Science teachers are barely equipped to handle these contexts at the FET level (Gov-ender, 2004). Final-year pre-service Physical Science teachers were interviewed as to their experiences of Cosmology and Astronomy with reference to the evolution of the universe, as well as to the handling of issues which could give rise to controversies and debates in the science classroom as learners come from different religious and cultural backgrounds.
2. BACKGROUND
The inclusion of the theory of evolution and the introduction of astronomy and cos-mology into the school curriculum has been the subject of heated controversy mainly in some parts of the United States (AIP Bulletin of Science Policy, 2005). However, the National Curriculum Statement of SA makes no such exclusions. In fact, one of the principles underpinning the value of Indigenous Knowledge Systems makes far-reaching implications for the science curriculum in SA as indicated by the following statement, “The NCS is premised on the view that there are competing perspectives and worldviews from which to understand and make sense of phenomena. A cur-riculum based on this view requires that these different perspectives and worldviews be recognized in the curriculum… “(NCS, 2003). The teaching of Astronomy has already begun at the GET level (DOE, 2002; Govender, 2004) and also for university foundation students at the University of Witwatersrand who do a course in geograph-ical astronomy (Cameron, et al, 2005). These papers emphasize the problems encoun-tered in both teaching and learning the ‘new’ concepts. Undoubtedly, the teaching and learning of Cosmology will be fraught with similar problems (Townsend, 2002). Re-searchers in IKS and Science (Jegede, 1998; Ogunniyi, 2000) points out the difficulties faced especially by disadvantaged learners in coping with concepts introduced during the teaching of Western science. Jegede emphasizes that “the learner’ s understanding of any new meaning is strongly influenced and determined by prior knowledge that is in turn determined by cultural beliefs, traditions and customs governed by a world view” (Jegede, 1998, 160). Also in referring to African children, he continues “African children learn about their environment using prior knowledge situated within their non-Western world-view … (but) …prior knowledge situated within the African world-view becomes a handicap when a Western world-view is used as a framework for learning science” (Jegede, 1998, 161).
This implies that cultural differences form the basis of some of the problems in understanding scientific concepts. Phelan, Davidson & Cao (1991, p.228) define culture as the, ‘norms, values, beliefs, expectations and conventional actions of a group’. It can be assumed, therefore that religion and indigenous knowledge systems are cultural phenomena which may then be subsumed under ‘beliefs’. Researchers (Bryan & Atwater, 2002, p.821; Tobin & LaMaster, 1995; Jegede & Okebukola, 1991) has shown that knowing teachers’ beliefs and designing instruction and experiences to explicitly confront those beliefs facilitate “refinement of and/or transformation” of beliefs and practices. Recent inclusion of IKS (Manzini, 2000, p.31), showed that learners appreciate the teaching of IKS, there was improved participation and a lack of “symbolic violence” on the part of learners. The current development towards globilised science in all parts of the globe requires that consideration be given to how learners move between their everyday life-world and the world of science, how learners deal with cognitive conflicts between those two worlds, and what this means for effective teaching. In this regard, Jegede and Aikenhead (1999) reviews a cognitive explanation called “collateral learning theory”- how learners cope with incongruent worldviews mediated by “transcending cultural borders between their everyday culture and the culture of science”. The support that learners acquire when
they attempt to negotiate these cultural borders will influence their success at sci-ence. They propose a pedagogy in which teachers assume a role of culture broker or mediator in the classroom to achieve culturally sensitive curriculum and assess-ment.
3. DESIGN AND METHODOLOGY
This paper is based on part of a PhD student research presently underway in the School of Science, Mathematics and Technology Education on the Edgewood Cam-pus of UKZN. The study involved engaging four students for six months in a final method course in Physical Science in energetic debates and discussions around issues of nature of science, cosmology, culture, religion and indigenous practices. Students were exposed via internet to the history of astronomy and cosmology. Formal lectures on modern cosmology were presented with opportunities for questioning, modeling and discussion. Two professors (one in Physics and one in Chemistry) and one Doc-tor (in Physics Education) were present to engage fruitfully in classroom in-depth discussions.
4. DATA COLLECTION
Discussions and unstructured interviews with four pre-service Bachelor of Educa-tion (B.Ed) student teachers were tape-recorded during two-hour sessions during the period August to November 2005. For ethical reasons, the students in question will be referred to by their pseudonyms: William, (a Christian-German fundamentalist reli-gious background); Sipho (a Christian-culture African background), Suresh (a Hindu but not practising), John (a Christian-modern religious background). The data was analyzed using discourse analysis methods and categorized initially for each student and then arranged thematically.
In summary, the data revealed the following:
v The religious and cultural background of the interviewees.
v How this shapes their personal world-views on Cosmology?
v Their epistemological and ontological goals.
v Their views on the nature of science and the aims of science education.
v How their views influence their teaching of Cosmology?
v What are the issues fore grounded when they addressed issues in designing a
Learning Programme in Cosmology as a context in the Physical Science cur-riculum for the FET band?
Some extracts from the interviews about the evolution of the universe:
William: “I would say to start off with Cosmology as a child was fairly simple.
You know the Sun, Moon, stars are out there and so on…I’ve always been taught from a young age that God created the universe…”
“I do not believe that there has been any evolution of the universe. I be-lieve that the universe was created by God about 6 000 years ago. Many
people believe that this belief is unscientific but in actual fact there is much science behind this belief since after all God created the science we live by”.
Suresh: “My beliefs and perspectives on the evolution of the universe have been
largely affected by science. The idea that the universe began when there was a major explosion (the Big Bang) is plausible. However, I also realize that science cannot explain everything. Alongside science, I believe that there had to be a force/energy whether it is God or something else that had to initiate a reaction.”
Sipho: My belief is that God created the universe and everything in it. Something
or someone who does not obey the laws of the universe should have cre-ated the point where matter must come from. Initially my perception of the universe did not expand beyond the Solar System… I did not worry much about what is space and how the earth was related to it. … Actually I have learnt more about the universe in the last two months than I had all my life. My idea of the universe has changed and I would never be able to talk about it without mentioning other models like the Big Bang and the Inflation model.
John: I am a devout member of the Christian faith. I support the biblical
no-tion on the “evoluno-tion” of the universe. The Bible speaks of the creano-tion of universe as taking place over a period of six days at the beginning of time. When was this beginning, I do not know? …I believe that the universe was created the instant God gave the Word. This instantaneous eruption of light and energy… could have taken the form of a Big Bang… I cannot say for sure whether or not the universe is expanding… If the universe is expanding where the extra space has come from? If not, what lies outside the universe?
5. DISCUSSION AND FINDINGS
It emerged clearly that the four interviewees came from backgrounds different with respect to religion and other aspects of culture. While William and John are Chris-tians, William declared that the clung tenaciously to his faith as revealed in the Bible - that the sun, moon, stars, humankind, animals and plants were all created in six days and that happened 6000 years B.C.E. He was prepared to teach Cosmology and would show that textbooks gave the scientific views of creation which they had to learn about, but their personal views were also important.
John, on the other hand, appeared to be more open in his views - that God did cre-ate the universe but humankind was given the ability to discover how this occurred. He would point out in the class that science is a powerful method of discovering the world and how it came to exist. Learners’ own religious views should also be taken into account.
Sipho stated that he, too, is a Christian but that he came from a rural setting and absorbed the culture beliefs common to the Africans in the village where he grew up.
They were interested only in the Sun and the Moon and the influence these ‘heavenly bodies’ had over their day to day living. They simply recognized the stars but their presence was a mystery. The universe as a whole did not matter to them - it was not visible. He has learnt a lot about the scientific views of the evolution of the universe and would try his best to teach his learners that the universe is more than what they observe about the Solar System.
Suresh is a Hindu - influenced strongly by the way his family (particularly his father) practised their faith. His is liberal in outlook and believed that there is a Great Force, who is responsible for the whole of creation. But science has revealed much to him and he is doing his best to understand the nature of the whole universe - the stars, the galaxies and what he learns from reading about astronomy. He would regard that his role as a teacher would be a real challenge and that he would be tolerant about the views expressed by his learners.
The above discussion gives only the preliminary findings as the analysis of data from the interviews conducted is still under way. A model of how teachers could view their knowledge positions is proposed in the form of a cultural triangle implying a connection with the three components of science, religion and indigenous knowledge. The model was presented to 200 high school science teachers at a teachers conference, some expressed delight in mapping their positions of the cultural triangle. Others were baffled at introduction of religion in science classes and yet others viewed the cosmological view of the universe and Big Bang as contradictions to their view of religion and concept of God.
The model called - The “Cultural Triangle” (see Figure 1) - using science (S), indigenous knowledge (I) and religion (R) as three components of culture (SIR) pertinent to the teaching of cosmology - is presented as a possible visual indicator of how a teachers’ personal views may be ‘equilibrated’ in dealing with cosmological issues in the classroom. Suresh is almost position in the middle and towards science suggesting that he his views are more scientific with knowledge of other aspects. Such an adjustment may be necessary as learners come from various cultural backgrounds. The implications are for teacher education and science teachers’ understandings of the competing power relations of ideologies in science education. In areas in the top triangle, science dominates, left triangle- indigenous knowledge dominates and right of triangle- religion dominates. Areas of the middle of the inner triangle indicate that science, indigenous knowledge and religion equilibrate. From the cultural triangle (Figure 1), William is strongly religious and scientific, Sipho is more balanced with indigenous emphasis, Suresh is balanced with strong scientific emphasis and John is towards the scientific and religious end. The ideal would be Suresh who is most likely to engage learners in open debates without indoctrinating his personal views or manipulating their worldviews to match his. Teachers who lack a particular area of knowledge should realize this from plotting their cultural positions in Figure 1 and consider development modules or self-study in these areas of knowledge. The internet is such a vast source of such information.
Figure 1 The Cultural Triangle
6. IMPLICATIONS
The above triangle can be used to plot teachers, students and learners cultural posi-tions with regard to their cosmological views. As science teachers our goal is to get learners to or near the inner triangle and more towards science end where all three views reach equilibrium.
7. REFERENCES
Bryan, L.A. & Atwater, M.M. (2002) Teacher beliefs and cultural models: A challenge
for science teacher preparation programs Science Teacher Education Volume 86
(6), 821 – 839.
Department of Education 2002. Revised National Curriculum Statement. Grades R-9 (Schools), Natural Sciences. Pretoria: Government Printer. Gazette No.; 23406. Vol 443, May 2002.
Department of Education 2003. National Curriculum Statement Grades 10-12 (Schools), Physical Sciences. Pretoria: Government Printer. Gazette: 2003 Govender, N. (2004). Physical Science educators’ perceptions of the inclusion of
as-tronomy and their conceptions in asas-tronomy with regard to the new FET Physical Sciences curriculum in S.A. Poster presentation at ICPE/SAIP Internal Physics Education Conference held at University of KwaZulu-Natal, Durban, South Af-rica. On the 5-8 July. 2004.
Jegede, O.J and Okebukola, P.A.O. (1991). The effect of instruction on socio-cultural beliefs hindering the learning of science. Journal of Research in Science Teaching, Vol 28 (3), 275-285.
Jegede,O.J. & Aikenhead, G.S. (1999) - Transcending Cultural Borders: implications for science teaching. Research in Science & Technological Education, Vol. 17, No. 1, 1999, 45-66.
Manzini, S (2000). Learners’ attitudes towards the teaching of indigenous African sci-ence as part of the school scisci-ence curriculum. Journal of Southern African As-sociation for Research in Mathematics, Technology and Science Education, Vol 4 (1), 19-32.
Ogunniyi, B.G. (2000). Teachers’ and pupils’ scientific and indigenous knowledge of natural phenomena. Journal of Southern African Association for Research in Mathematics, Technology and Science Education, Vol 4 (1), 70-77.
Phelan, P. Davidson, A.L. & Hanh Thanh Cao, T H. (1991). Students’ Multiple Worlds: Negotiating the Boundaries of Family, Peer, and School Cultures. Anthropology &
Education Quarterly, Vol. 22 (3), 224-250.
Tobin, K & LaMaster, SU. (1995). Relationships Between Metaphors, Beliefs, and Ac-tions in a Context of Science Curriculum Change. Journal of Research in Science Teaching, 32 (3) 225-42.
Townsend, G. (2002). Culturally relevant college-level astronomy courses for non-sci-ence majors. Electronic Journal of Scinon-sci-ence, 6 (4), [Online]. Available: http://unr. edu/homepage/crowther/ejse (Accessed 20/11/2003).
8. ACKNOWLEDGEMENTS
USE ROOT CAUSE ANALYSIS TEACHING STRATEGY TO
TRAIN PRIMARY PRE-SERVICE SCIENCE TEACHERS
Chow-Chin, Lu, Chun-Wei, Tsai, Jon-Chao Hong
National Taipei University of Education 134 He-Ping E. Rd., Sec. 2, Taipei, Taiwan, R. O. C.
E-mail: <[email protected]>
t A
bstrActThis study examined the Root Cause Analysis (RCA) Teaching Strategy on pre-service primary science teachers and instinct pre-pre-service teachers to apply RCA Teaching Strategy to science curriculums. RCA Teaching Strategy is to coordi-nates 5Why Method and Fishbone Diagram. The participants included 18 pre-service primary science teachers and the training courses for 4 hours a week and lasted for 18 weeks. The result shows that pre-service primary science teachers are gradually familiar with RCA Teaching Strategy and can apply it to science curriculums from Microteaching Classroom Observation and Teaching-Portfoli-os. For example, in “The Influence of Heat on Materials” unit, fifth grade students observed the balloon on the PET bottle soaked in water swelled. Students would brainstorm all causes of balloon swelled with 5Why Method, and draw Fishbone Diagram together. Finally, they found the root cause with Root Cause Analysis.
Key Words Root Causes Analysis Teaching Strategy, Primary Pre-service Science Teachers, Microteaching.
1. INTRODUCTION
1.1 Rationale and Importance of this study
When United Nations Educational Scientific and Cultural Organization (1966) rep-resented the “Recommendation Concerning the Status of Teachers”, it mentioned, “Teaching should be seen as a professional career, a type of public service, and it also needed the professional knowledge and specific ability of teachers.” Research about the teaching ability of professional teachers, Shulman (1986) stated the view of peda-gogical content knowledge (PCK), including pedapeda-gogical content and teaching meth-ods. He mentioned if a professional teacher owns the teaching ability, s/he would know how to transfer his or her understanding into the knowledge students realize. Allen and Ryan (1969) mentioned a training mode for improving teachers’ teach-ing ability- Microteachteach-ing, which is applied to the professional development trainteach-ing of pre-service and in-service teachers. It provides them practice surroundings where reduce complicated factors in classrooms and increase a lot of feedback after teach-ing. Benton-Kupper (2001) stated pre-service teachers think that Microteaching was a perfect chance to attain pedagogical knowledge and skills, and there were more and
more evidences show that it was an effective method to promote teaching skills of pre-service teachers. Researchers further discovered that if we implement Microte-aching in the science teMicrote-aching of primary schools, accompanied the primary students’ learning performances, teachers would solve tough problems of teaching through the reflection of using the teaching strategy.
1.2 Research Objectives
The study will educate pre-service teachers using “Root Cause Analysis (RCA) teach-ing strategy” in science curriculums. Through discussion of Microteachteach-ing with RCA teaching strategy and teaching in fifth grade of primary school, pre-service primary science teachers would promote their PCK ability. The research objectives are:
1. How is pre-service primary science teachers’ application of RCA teaching strategy through Microteaching?
2. How is the relationship between primary students’ learning effects in “The In-fluence of Heat on Materials” unit and pre-service primary science teachers’ professional development?
2. LITERATURE OF REVIEW
2.1 Theory and Practice of Microteaching
Allen and Ryan (1969) proposed Microteaching was a specific mode of teacher train-ing. The characteristic of Microteaching is to divide teaching techniques into small sections such as asking questions, reinforcement, and repeat, and it is a goal to only realize a small amount of sections when training. There are four steps of Microte-aching: 1. Practicers are told certain techniques. 2. It is held the teaching of certain techniques in 5~20 minutes. 3. The instructor and practicers discuss the advantages and disadvantages when Microteaching. 4. Practicers teach again based on feedback of discussion (Allen,1967; Borg, Kelley, Langer, &Gall,1970).
To the view of Microteaching for pre-service teachers, Benton-Kupper (2001) summed up as follows: 1. It helps to confirm the advantages and disadvantages of teaching. 2. It provides chances to communicate with each other. 3. Watching re-cording would revise teaching techniques. 5. Practicers would produce intelligible thoughts when Microteaching. 6. Through kinds of Microteaching, practicers would learn many teaching strategies and thoughts.
2.2 The Ability of Pedagogical Content Knowledge (PCK) of Science Teachers Shulman (1986) indicated PCK in accordance with the shortcomings that pedagogi-cal knowledge and content knowledge were separated in America. Compared peda-gogical knowledge of expert teachers with novice teachers, Shulman (1987) proposed seven categories of the teacher knowledge base: 1. Content knowledge. 2. General pedagogical knowledge, with special reference to those broad principles and strategies of classroom management and organization that appear to transcend subject matter. 3. Curriculum knowledge, with particular grasp of the materials and programs that serve as ”tools of the trade” for teachers. 4. Pedagogical content knowledge, that
spe-cial amalgam of content and pedagogy that is uniquely the province of teachers, their own special form of professional understanding. 5. Knowledge of learners and their characteristics. 6. Knowledge of educational contexts, ranging from the workings of the group or classroom, the governance and financing of school districts, to the char-acter of communities and culture. 7. Knowledge of educational ends, purposes and values, and their philosophical and historical grounds.
Hong (2006) stated when we “confirm the reason” during problem solving process, we try to analyze by native, reliability, and consequence. In addition, the analysis method of consequence is 5Why Method. 5Why is proposed earliest by Taichi Ohno in Toyota Motor Company. In the company, they had used 5Why to deal with problems by ask-ing “why” consistently (Yang, 2006). Lu, Hong and Tseng (2007) had designed inquiry-based learning curriculums through 5Why Scaffolding Guided Questioning. However, they found that students had difficulty to analyze the root causes of problems. It resulted from not finding a auxiliary means for students to display all possible causes.
2.3 Theory and Practice of Root Cause Analysis (RCA) Teaching Strategy
The objective of RCA is to identify “root cause(s)” so that these latent failures may eliminated or modified and future occurrences of similar problems or mishaps may be prevented (National Aeronautics and Space Administration [NASA], 2003). Some fire-fighting is carried out in order to handle and recover immediately. Since this ex-peditious approach deals with the patching up symptoms quickly, the problem seems temporarily solved. Over time, the problem is likely to recur, thereby eliminating or reducing the anomalous impact. The critical importance of is this prevention of re-curring failures (Envision Software, 2003).
Hong (2006) stated when we “confirm the reason” during problem solving process, we try to analyze by native, reliability, and consequence. In addition, the analysis method of consequence is 5Why Method. 5Why is proposed earliest by Taichi Ohno in Toyota Motor Company. In the company, they had used 5Why to deal with problems by ask-ing “why” consistently (Yang, 2006). Lu, Hong and Tseng (2007) had designed inquiry-based learning curriculums through 5Why Scaffolding Guided Questioning. However, they found that students had difficulty to analyze the root causes of problems. It resulted from not finding a auxiliary means for students to display all possible causes. To solve the problem like this, The Quality Assurance Project (2006) proposed that Cause-and-effect diagrams can reflect either causes that block the way to the desired state or helpful factors needed to reach the desired state, which named “Fishbone Diagram”. The Fish-bone Diagram helps teams to brainstorm about possible causes of a problem.
Above all, this study will develop pre-service teachers’ application of RCA teach-ing strategy by Microteachteach-ing. And it emphasized that how re-service teachers attain PCK, curriculum knowledge, and knowledge of learner.
3. RESEARCH DESIGN
3.1 Research design and procedure
At first, we had pre-service teachers RCA teaching strategy training, including the theory and practice of RCA, 5Why teaching, Fishbone Diagram using, lesson plans
and learning sheets editing, and Microteaching. After that, we actualized Microteach-ing of “The Influence of Heat on Materials” unit, and the courses were altogether for 9 weeks. Finally, pre-service teachers taught in practice at a primary school in Taipei County. We analyzed the relationship between primary students’ learning effects in “The Influence of Heat on Materials” unit and RCA teaching strategy of pre-service teachers.
3.2 Research Tools 3.2.1 Fishbone Diagram
We used “Fishbone Diagram” to assist learners finding the root causes of problems. The steps are: 1. The team agree on the problem or the undesired state and write specifically on the right of the paper, and draw a backbone from left to right side. 2. The team can gather data and brainstorm first about likely causes and fill them on the correct branches or sub-branches. 3. Keep asking "Why?" and "Why else?" for each cause until a potential root cause has been identified, maybe 4M (men, mechanism, materials, and methods) included. 4. Check the logic of the chain of causes and en-sure that the answers to the "Why" questions are plausible explanations. 5. Generate solving strategy, and write it on the right side under the problem (NASA, 2003; The Quality Assurance Project, 2006).
3.2.2 Observation Records of Microteaching
The Observation Records of Microteaching was edited by Hong and Lu (2007) and includes conceptual communication and supportive communication. Conceptual communication includes RCA application, experiments demonstration, and teach-ing contents; supportive communication includes language expression, teachteach-ing aids, and learning sheets. It summed to 18 items and was approved from 3 professors of National University majored in science education of in content validity.
3.3 Participants
In this study, there are 18 primary pre-service science teachers of third grade at De-partment of Natural Science Education in a university of education in Northern Tai-wan. They divided into six groups by themselves, and each group has three persons. Primary pre-service science teachers had own the ability of critical thinking and the knowledge of General Biology, General Physics, and General Chemistry.
3.4 Data Collection
Table 1 shows that the purposes and training curriculum of collecting each qualitative item. We collected data from Fishbone Diagram, Observation Records of Microte-aching, and learning portfolio, and feedback list of teaching in practice. Then we did interpretive analysis and triangulation to summarize the results.
Table 1 The Purposes and Occasions of Qualitative Data in Training Courses
Data Collections Purposes Occasions
Fishbone Diagrams Help teams to brainstorm about possible causes of a problem, and could be an auxiliary means of RCA teaching strategy.
1. Theory and practice curriculums 2. Microteaching 3. Teaching in practice in a primary school Observation Records of Microteaching
Observe per-service teachers’ promotion of conceptual communication and supportive communication
Microteaching
learning portfolio Observe the reflection, thinking, and critique after teaching training.
1. Theory and practice curriculums 2. Microteaching
3. Teaching in practice in a primary school feedback list of teaching
in practice
Pre-service teachers discuss the effectiveness with instructor and peers after teaching in practice.
Teaching in practice in a primary school
4. RESULTS AND DISCUSSION
4.1 The effectiveness of using RCA Teaching Strategy through Microteaching 4.1.1 The learning effects of theory curriculums
In RCA Teaching Strategy course training, three teaching sessions and improvement of pre-service teachers and learning-portfolios are shown in Table 2.
Table 2 RCA Teaching Strategy of Learning-Portfolios First Learning-Portfolios Second Learning-Portfolios Third Learning-Portfolios Acquire RCA concept
7 persons (39%) 16 persons (89%) 14 persons (78%) Partially acquire 4 persons (22%) 2 persons (11%) 4 persons (22%) Not acquire RCA concept 7 persons (39%) 0 persons (0%) 0 persons (0%) Total 18 persons (100%) 18 persons (100%) 18 persons (100%)
Table 2 shows that for pre-service teachers to flexibly apply the teaching method, three teaching sessions were conducted. After that, they understand to design RCA teaching strategy. Result shows that finally 78% of pre-service teachers understood the spirit of “RCA teaching strategy” and were able to apply it in their teaching. 4.1.2 Applying RCA Teaching Strategy to primary science curriculum
Table 3 Evidence of student thinking and RCA ability RCA Teaching Strategy
Learning Portfolio
RCA Teaching Strategy Classroom Discussion S (majority): It is applicable in science
teaching because the question and answer method best arouses students’ curiosity, and the motive to learn. Students will practice to think with structuralized logics and the thinking modes also help cultivate students’ feasible thoughts.
S13: In RCA teaching, do we must represent
the results that are also interesting to students?
T: Yes, the widespread application of RCA
is in medical area, and it is usually used in accidental results in hospitals. When transferring it to apply in the teaching, we can also show the result first to attract students’ concern, and then do RCA. 4.2 The relationship analysis between primary students’ learning and
pre-service teachers’ professional development of PCK
4.2.1 Primary students’ learning effects in “The Influence of Heat on Materials” unit Through RCA
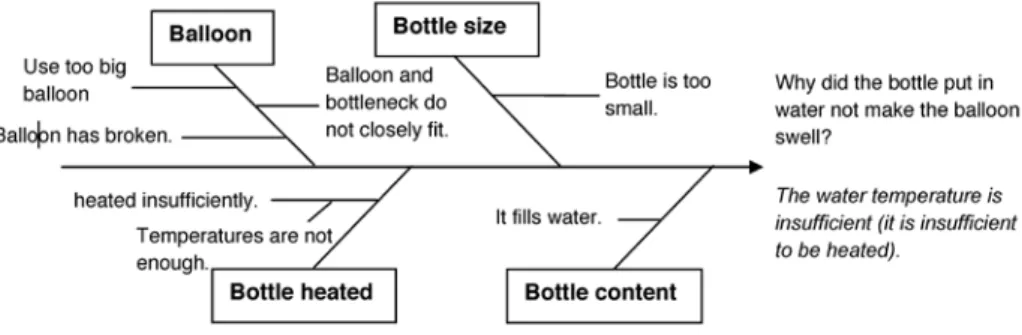
We viewed Primary students’ learning effects in “The Influence of Heat on Materials” unit Through Fishbone Diagram. We took the problem “Why did the balloon not swell when putting PET bottle in water?” for an example.
1. When student groups discussed the reasons with Fishbone Diagram, we found that certain of groups focused on the causes from balloons, and others focused on the size of PET bottle, the content of the bottle, or being heated of the bottle. Students could not consider each kind of aspects with great detail.
2. Teachers pasted the Fishbone Diagrams of those six groups, and students dis-cussed more after seeing others’ representations. Each group paid attention to the detail they didn’t come out before.
3. Next, the class drew a complete Fishbone Diagram together under teacher’s guidance. It shows in Figure. 1.
Figure 1 A Complete Fishbone Diagram under Teacher’s Guidance
4. Finally, students use “Falisificationism” to determine the root cause. It is the water temperature that the bottle could not make the balloon swell.
4.2.2 Primary pre-service science teachers’ professional development in PCK 4.2.2.1 Pedagogical content knowledge
When teaching in practice in a primary school, we found that teachers should guide students applying RCA to solve problems step by step although they were already fifth grade students. In 5Why asking, students would get used to teacher’s questioning way. At first, students answered teacher’s questions, and then students gradually asked questions and discussed each other. In instructing Fishbone Diagram, teacher gave group students a white paper so that they drew the Fishbone Diagram by themselves. However, students felt difficult and indecisive. In this situation, teacher tried to take problems of daily life for example. Teacher drew a backbone; guided students propose cause categories and filled them on the correct branches or sub-branches. After that, students considered every likely cause of each category. Finally, students could can-vass and draw the Fishbone Diagram on their own, also find the root cause. So teach-ers’ action research in Microteaching, we revised the steps as follows:
1. At first, teacher takes a problem of daily life for demonstration about how to apply Fishbone Diagram. Next, teacher draws the backbone and blanks which students should fill, and guide group students discuss step by step, filling the answers in those blanks.
2. After practicing several times, students will be familiar with Fishbone Dia-grams.
4.2.2.2 Curriculum knowledge
From Observation Records of Microteaching, pre-science teachers ignored the us-ing details of experimental materials and experimental skills. It resulted in failures or rough experiments, and teachers began to realize it through discussion in classroom and senior teachers’ demonstration. Next, from learning portfolios, we found that pre-service teachers gradually chose the experimental materials suitable for students’ levels and explained the details of using according to students’ ability of experimental skills.
4.2.2.3 knowledge of learner
Through evaluating students’ Fishbone Diagrams, pre-service teachers didn’t notice the illogical parts in their Fishbone Diagrams. After group discussion, brainstorming, and other pre-service teachers’ opinions, he/she had help students to focus on the reasonable and logical causes. The class listed all possible causes, and drew a complete Fishbone Diagram. Meanwhile, they thought about all likely causes by falsification so that students would develop their ability of causal thinking.
5. CONCLUSION AND RECOMMENDATION 5.1 Conclusion
After three teaching sessions of the theory curriculums were conducted, pre-ser-vice teachers could realize the characteristics of RCA teaching strategy and apply the teaching strategy to primary science curriculums. In students’ learning effects
through RCA, we found that some groups couldn’t think the whole causes thorough-ly. Students finally complete the Fishbone Diagram under teacher’s guidance. And in pre-service teacher’s professional development after teaching in practice in a pri-mary school, they have known that teachers should guide students applying RCA to solve problems step by step although they were already fifth grade students, and they learned to choose the experimental materials suitable for students’ levels and explain the details of using according to students’ ability of experimental skills.
In finding root cause process, students have learned to not believe those direct causes easily. This strategy can improve the shortcomings of only solving the single incident, tackling a problem on the surface but not at the root. It would train students to hold doubtful attitude of anything being seen at the moment, so it reduces the op-portunity to judge the reasons by mistake. Also, students know that what data they missed before and what aspects they should reinforce in order that they can think completely. However, using RCA teaching strategy in class, teachers can only analyze and discuss to the single problem which should not be too complicated.
5.2 Implication
RCA teaching strategy is a method of finding out the root causes, and it develops stu-dents’ habits of thinking all likely causes. On the one hand, teachers could apply the teaching strategy to other suitable units in science curriculums. In other hand, when selecting topics, teachers should consider that the cause kinds will not be too broad. Once the topics are too complicated, too many causes would let students out of focus. So, when teachers use RCA teaching strategy, they should think twice about choosing suitable problems for students.
6. REFERENCES
Allen, D., & Ryan, K. (1969). Microteaching. Readin, Massachusetts: Addison-Wes-ley.
Allen, D. (1967). Preface. In D. Allen (Ed.), Micro-teaching: A description. Palo Alto, CA: Standford University.
Benton-Kupper, J. (2001). The microteaching experience: Student perspectives. Edu-cation, 121(4), 830-835.
Borg, W. R., Kelly, M. L., Langer, P., & Gall, M. (1970). The Minicourse: A microteach-ing Approach to Teacher Trainmicroteach-ing. Macmillan, London.
Envision Software, Inc. (2007). Root Cause Analysis. Retrieved September 27, 2007, from http://www.envisionsoftware.com/Management/Root_Cause_Analysis.ht-mlRoot Cause Analysis
Hong, J. C. (2006). A Study of Idea Searching as the Knowledge Creation Approach-es on ChinApproach-ese Eight Trigrams (Pa Gua). The 2006 ISPIM Conference in Athens, Greece on 11-14, June.
Lu, C. C., Hong, J. C., & Tseng, Y. C. (2007, May 28-30). The effectiveness of inquiry-based learning by scaffolding students to ask “5 Why” questions. Paper presented at Redesigning pedagogy 2007Conference, SCI 388, in National Institute of Edu-cation, Singapore.
National Aeronautics and Space Administration (NASA), Office of Safety & Mission Assurance. (2003, July).Root Cause Analysis Overview. Retrieved March 15, 2004, from http://www.hq.nasa.gov/office/codeq/rca/rootcauseppt.pdf
Shulman, L. S. (1986). Those who understand: Knowing growth in teaching. Educa-tional Researcher, 15(2), 4-14.
Shulman, L. S. (1987). Knowledge and teaching: Foundations of the new reform. Har-vard Educational Review, 57(l), 1-22.
The Quality Assurance Project (2006). Methods & tools, QA resources, cause-and-ef-fect analysis. Retrieved August 8, 2007, from http://www.qaproject.org/methods/ resc&e.html
UNESCO (1966). Recommendation Concerning the Status of Teachers. Record of the conference. UNESCO Statistic Report.
Yang, Y. F. (2006). Looks at the Domestic Enterprise From Toyota Motor Company.5Why. Retrieved August 29, 2006, from http://www.51made.com/ zzxxh_show.asp?zid=638
7. ACKNOWLEDGEMENTS
We appreciated the funding supported from National Science Council, Taiwan, R.O.C. (NSC 95- 2511-S-152-003-MY3).
RELATIONSHIP BETWEEN TEST ANXIETY AND ACADAMIC
ACHIEVEMENT: IMPACT ON HIGHER EDUCATION
Rizwan Akram Rana
Associate Professor Institute of Education and Research, University of the Punjab, Lahore, Pakistan
E-mail: [email protected]
t A
bstrActThe major purpose of the study was to explore the relationship between test anxiety and academic achievement of students at post graduate. A sample of 414 students was randomly selected from seven different science departments in a public sector university in Lahore, Pakistan. Pearson correlation and re-gression analysis were run for data analysis. It was found that there is a sig-nificant negative relationship exists between test anxiety scores and students’ achievement scores. So is concluded that test anxiety is one the factor which is responsible for students’ underachievement and low performance.
Key Words Test anxiety, Students’ achievement, Higher education 1. INTRODUCTION
Higher education is viewed as a source of great potential for the socioeconomic and cultural development of the country. George (2006) discussed that “the last decade of the 20th century saw greater emphasis than ever before placed on higher education. In both developed and developing nations, higher education was believed to be the key to the continuing growth of national economies”. Research literature indicates that colleges and universities can be extremely effective economic and social accelera-tors for both individuals and entire societies (Maoyuan, 2007; Zarycki, 2007; Leef, 2006;). Isani & Virk (2005) stated that through quality higher education, the nation can be transformed into a developed nation within the life of a single generation.
Tests and examinations at all stages of education and especially, at higher educa-tion level have been considered an important and powerful tool for decision making in our competitive society, with peoples of all ages being evaluated with respect to their achievement, skills and abilities. The era in which we live, is an era of test-con-scious age in which the lives of many people are not only greatly influenced, but are also determined by their test performance. Test and examinations stress is thought to prevent some individuals from reaching their academic potential (Keogh, et al., 2004). In general, experts in this field are agreed that that most students in institutions of higher education conceive examination situations as threatening, and experienc-ing an increase in test anxiety (TA), which is, in fact, their transitory emotional state
(Spielberger, 1985) during (or just before the commencing of) tests, particularly in the natural science disciplines (Zoller & Ben-Chaim, 1989). As a result of this factor, test anxiety has become most upsetting and disorderly factor for students. It is one of the variables that most commonly accounted for students’ underachievement and low performances at different levels of their educational life and has been shown to affect students’ ability to profit from instruction. Several research studies indicated a significant but inverse relationship between test anxiety and students achievement (Putwain, 2007; Meijer, & Oostdam, 2007; Harrison, et al., 2006; Chapell et al., 2005; Cassady & Johnson, 2002; Diaz, 2001; Hanckock, 2001; Richards et al., 2000; Mclner-ney & McInerMclner-ney,& Marsh, 1997; Hagtvet & Benson, 1997; Goska & Ackerman, 1996; Mwamenda, 1994; Birenbaum & Nasser, 1994; Fincham, Hokoda, & Sandars, Jr., 1989; Humbree, 1988).
Berk & Nanda (2006), Chapell et al. (2005), Cassady & Johnson (2002), Diaz (2001), Hanckock (2001), Pintrich & Schunk (1996), Williams (1994) and several other re-searches (Humbree, 1988; Morris, Davis, & Hutchings, 1981; Depreeuw, 1984) have typically conceived of test anxiety as a bidimensional construct, with an affective and cognitive components. The affective dimension (emotionality) refers to behavioural or physical reactions to testing situations, such as fear, nervousness, and physical dis-comfort. These research studies indicated that high levels of emotionality dimensions of test anxiety are typical evident through physiological responses experienced during evaluative situations. The cognitive dimension (worry) refers to cognitive concerns about performance, such as worry about the testing situation or negative performance expectations. Bandlos, Yates, & Thorndike-Christ (1995), Keogh et al., (2004), Wil-liams (1991), and Humbree (1981) discussed that cognitive aspect of test anxiety is the factor has been found to be significantly associated with declines in performance for adolescents and postsecondary students.
Several researchers explored the gender differences with respect to test anxiety and found that females have higher levels of overall test anxiety than males (Chapell et al., 2005; Cassady & Johnson, 2002; Bandalos et al., 1995; Mwamwenda, 1994). One explanation for the gender differences in test anxiety is that males and females experience similar levels of test worry, but females have higher levels of emotionality (Cassady & Johnson, 2002). Zeidner (1990) on the basis of his research concluded that difference in males and females levels of test anxiety is due to gender difference in scholastic ability. Keeping in view the above discussion, the present study was con-ducted to achieve the following objectives.
2. OBjECTIVE OF THE STUDY The study was aimed to:
1. Determine the relationship between the Test Anxiety total scale scores and aca-demic achievement scores of students in different science subjects.
2. Determine the relationship between the Test Anxiety Emotional scale scores and academic achievement scores of students in different science subjects. 3. Determine the relationship between the Test Anxiety Worry scale scores and
3. HYPOTHESES OF THE STUDY Hypotheses of the study were:
HO1: There is no significant relationship between students achievement score and
test anxiety total scale scores.
HO2: There is no significant relationship between students’ achievement scores
and test anxiety emotional scale scores.
HO3: There is no significant relationship between students’ achievement scores
and test anxiety worry scale scores. 4. RESEARCH METHODOLOGY
A description of research methodology is described below. 4.1. Sample
The sample of the study was comprised of 414 randomly selected post graduate stu-dents (Male = 116, Female = 298) from seven different departments of a public sector university in Lahore, Pakistan. The detail is given below in table 1.
Table 1 Detail of sample of the study
S. No. Department Number of Students
Male Female 1. Mathematics 16 54 2. Physics 36 26 3. Statistics 22 80 4. Geology 24 02 5. Zoology 0 69 6. Environmental Sciences 8 20 7. Science Education 10 47 Total 116 298 4.2. Research Instrument
To measure the test anxiety of the students studying at post graduate level, Test Anxi-ety Inventory (TAI) developed by Spielberger (1980) was used. This scale comprised of 20 Likert Scale type items. The scale is further divided into two subscales: Worry Scale (8 items) and Emotional Scale (8 items). The Cronbach Alpha for total scale was 0.868 whereas, the reliability of emotional scale items was 0.767 and worry scale items was 0.720.
To collect information about demographic variables, Demographic Variables In-formation Proforma was developed by the researcher. It comprised of inIn-formation re-garding student’s gender, department, semester and their achievement scores (Achie-ment scores were verified by the officials of concerned depart(Achie-ments).
4.3. Analysis and Interpretation of Data
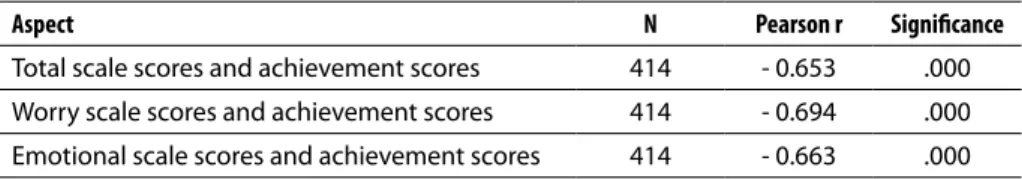
Data were collected personally from each student and analyzed by using SPSS-15 Software Package. The results of Pearson Correlation indicate that hypotheses of the study were rejected at p≤ 0.05 level of significance. Table 2 shows the results.
Table 2 Relationship between students’ achievement scores and scores on test anxiety scale
(Total scale, Worry Scale and Emotional scale)
Aspect N Pearson r Significance
Total scale scores and achievement scores 414 - 0.653 .000 Worry scale scores and achievement scores 414 - 0.694 .000 Emotional scale scores and achievement scores 414 - 0.663 .000
It is evident from table 2 that there is strong negative and significant relationship ex-ists between students’ achievement scores and Total scale scores and also on subscales scores. The strong values of correlation coefficient lead to further analysis of data, so it was decided to run Regression analysis to explore cause effect relationship between achievement scores and test anxiety scale scores. The result is given in table 3. Table 3 Regression analysis
Model β t-value Significance Model R square
Total anxiety scale scores -.251 -. 6.700 .000
0.535
Worry scale scores -.697 - 4.160 .000
Emotional scale scores -.140 -. 890 .374
Table 3 shows that 53% variance was explained by the regression model which shows that test anxiety effects students achievement. It is further evident from table worry scales scores are the major contributor with respect to difference in students’ achievement scores.
5. CONCLUSION AND DISCUSSION
On the basis of results of Pearson r and regression analysis, it is concluded that test anxiety is one of the cause for underachievement and low performances in different science subjects at post graduate level. These results are consistent with the findings of Chapell et al. (2005); Cassady & Johnson (2002) and Birenbaum & Nasser (1994) by indicating that cognitive dimension (worry) of test anxiety was far more influential on students’ achievement than emotionality. The outcome of this study calls for some intervention strategies on the part of faculty members to overcome/reduces academic stress and test anxiety among students of higher educational institutions. Erbe (2007), Berk & Nanda (2006), Stober (2004), Haris & Coy (2003), Foster, Paulk, & Dastoor (1999), Kondo (1996), and Serok (1991) discussed various measures and strategies which can be applied by faculty members to reduce test anxiety among their students. These are described in the form of list: (i) Task orientation and preparation; (ii)
Posi-tive thinking; (iii) Seeking social support; (iv) Avoidance; (v) Relaxation training; (vi) Coaching/ Guided imagery; (vii) Self instructional training; (viii) Establishing pur-pose; (ix) Affirmation; (x) Modalities; (xi) Positive Anchors; (xii) Mental simulations; (xiii) Use of humor; (xiv) Preparation of cheat sheet; and (xv) Study skills training.
To summarize this discussion, it is concluded that we live in a test-taking society and when students are anxious pre and during tests, test anxiety has significant and effective impact on their performance. To effectively manage test anxiety, students can be helped by teachers, parents and educational administrators by use of cognitive, affective and behavioral strategies. It is further suggested that the students should be fully informed about the nature of courses, duration of semester, and level of commit-ment for successful completion of course by the faculty and administration of depart-ments. The students with higher test anxiety must be identified and treated in order to increase their academic achievement.
6. REFERENCES
Bandalos, D.L., Yates, K., & Thorndike-Christ, T. (1995). Effect of math self-concept, perceived self-efficacy, and attribution for failure and success on test anxiety.
Jour-nal of EducatioJour-nal Psychology, 11, 351-360.
Berk, R.A. & Nanda, J. (2006). A randomized trial of humor effects on test anxiety and test performance. Humor: International Journal of Human Research, 19 (4), 425-454.
Berk, R.A. (2000). Does humor in course tests reduce anxiety and improve perfor-mance? College Teaching, 48 (4), 151-58.
Birenbaum, M., & Nasser, F. (1994). On the relationship between test anxiety and test performance. Measurement and Evaluation in Counselling and Development,
27(1), 293-301.
Cassady, J.C., & Johnson, R.E. (2002). Cognitive test anxiety and academic perfor-mance. Contemporary Educational Psychology, 27, 270-295.
Chapell, M.S., Blanding, Z.B., Takahashi, M., Silverstein, M.E., Newman, B., Gubi, A., & mccann, N. (2005). Test anxiety and academic performance in undergraduate and graduate students. Journal of Educational Psychology, 97 (2), 268-274.
Erbe, B. (2007). Reducing test anxiety while increasing learning. College Teaching, 55 (3), 96-97.
Foster, S. K., Paulk, A., & Dastoor, B. R. (1999). Can we really teach test-taking skills?
New Horizons in Adult Education, 13 (1), 4-12.
George, E.S. (2006). Positioning higher education for the knowledge based economy.
Higher Education, 52 (4), 589-610.
Goska, R.E., & Ackerman, P.L. (1996). The aptitude-treatment interaction approach to transfer within training. Journal of Educational Psychology, 88 (2), 249-260. Fincham, F.D., Hokoda, A., & Sanders, R. Jr. (1989). Learned helplessness, test anxiety,
and academic achievement: A longitudinal analysis. Child Development, 60, 138-145.
Hagtvet, k.A., & Benson, J. (1997). The motives to avoid failure and test anxiety re-sponses: Empirical support for integration of two research traditions. Anxiety,
Stress and Coping, 10, 35-57.
Hancock, D.R. (2001). Effect of test anxiety and evaluative threats on students’ achieve-ment and motivation. The Journal of Educational Research, 94 (5), 284-290. Haris, H. L., & Coy, D. R. (2003). Helping students cope with test anxiety. ERIC
Di-gest. (ERIC Document Reproduction Service No. ED 479355). Retrieved June 25,
20008 from a World Wide Web: http://www.ericdigest.org/2005-2/anxity.html Harrison, L.A., Stevens, C.M., Monty, A.N., & Coakley, C.A. (2006). The
consequenc-es of stereotype threat on the academic performance of white and non-white lower income college students. Social Psychology of Education, 9, 341-357.
Hembree, R. (1988). Correlates, causes, effects, and treatment of test anxiety. Review
of Educational Research, 58 (1), 47-77.
Hopko, D.R., Crittendon, J.A., Grant, E., & Wilson, S.A. (2005). The impact of anxiety on performance IQ. Anxiety, Stress and Coping, 18(1), 17-35.
Isani, UAG., & Virk, M.L. (2005). Higher education in Pakistan. Islamabad: National Book Foundation.
Kondo, D. S. (1996). Strategies for coping with test anxiety. Anxiety, Stress and Coping,
10, 203-215.
Leef, G.C. (2006). The overselling of higher education. Academic Questions, 19 (2), 17-34.
Maoyuan, P. (2007). We must start up scientific research in higher education: My humble opinion on the establishment of higher education as a discipline. Chinese
Education and Society, 40 (3), 27-44.
Meijer, J., & Oostdam, R. (2007). Test anxiety and intelligence testing: A closer exami-nation of the stage-fright hypothesis and influence of stressful instruction.
Anxi-ety, Stress and Coping, 20 (1), 77-91.
Morris, L.W., Davis, M.A., & Hutchings, C.J. (1981). Cognitive and emotional compo-nents of anxiety: Literature review and a revised worry-emotionality scale. Journal
of Educational Psychology, 73, 541-555.
Mwamwenda, T.S. (1994). Gender differences in scores on test anxiety and academic achievement among South African University graduate students. South African Journal of Psychology, 24 (4),
Orpen, C. (1996). The interactive effects of social support and test anxiety on students academic performance. College Student Journal, 116, (30), 464-465.
Pintrich, P.R., & Schunk, D. (1996). Motivation in education: Theory, research, and
ap-plications. Upper Saddle River, NJ: Erlbaum.
Putwain, D. (2007). Researching academic stress and anxiety in students: some meth-odological considerations. British Educational Research Journal, 33(2), 207-219. Richards, A., French, C.C., Keogh, E., & Carter, C. (2000). Test anxiety, inferential
Serok, S. (1991). The application of Gestalt methods for the reduction of test anxiety in students. Assessment and Evaluation in Higher Education, 16 (2), 157-64. Spangler, G., Pekrun, R., Kramer, K., & Hofmann, H. (2002). Students’ emotions,
psy-chological reactions, and coping in academic examinations. Anxiety, Stress and
Coping, 15 (4), 413-432.
Spielberger, C. (1985). Assessment of state and trait anxiety: Conceptual and method-ological issues. The Southern Psychologist, 2, 6-16.
Spielberger, C. (1980). Test anxiety inventory: Preliminary professional manual. Palo Alto, CA: Consulting Psychologist Press.
Stober, J. (2004). Dimensions of test anxiety: Relations to ways of coping with pre-exam anxiety and uncertainty. Anxiety, Stress and Coping, 17 (3), 213-226.
Veenman, M.V.J., Kerseboom, L., Imthorn, C. (2000). Test anxiety and meta-cognitive skilfulness: Availability versus production deficiencies. Anxiety, Stress and Coping,
13 (4), 391-412.
Williams, J.E. (1994). Anxiety measurement: Construct validity and test performance.
Measurement & Evaluation in Counseling & Development, 27 (1),
Zarycki, T. (2007). Cultural capital and the accessibility of higher education. Russian
Education and Society, 49 (7), 41-72.
Zeidner, M. (1990). Does test anxiety bias scholastic aptitude test performance by gender and sociocultural group? Journal of Personality Assessment, 55, 145-160. Zoller, U., & Ben-Chaim, D. (1989). Interaction between examination type, anxiety
state, and academic achievement in college science: an action-oriented research.
Journal of Research in Science Teaching, 26(1), 65-77. ACKNOWLEDGEMENT
I would like to thank Higher Education Commission (HEC), Government of Pakistan for providing full support and funding to conduct this research study.
QUALITATIVE TOOL FOR ASSESSING STUDENTS’
ARGUMENTATION SKILLS
IN NINTH-GRADE SCIENCE CLASSES
Anne Laius, Maili Petersen, Miia RannikmäeUniversity of Tartu
[email protected], [email protected], [email protected]
t A
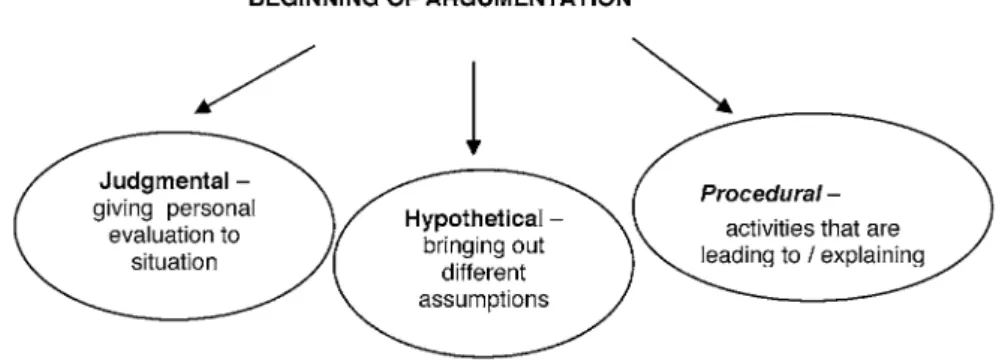
bstrActThe current research investigates the influence of social issue-based teaching in science classes on ninth-grade students’ reasoning and argumentation skills. This paper reports on a methodological approach to the analysis of argumen-tation skills in Estonian primary school science classes developed as part of teachers’ in-service courses. The sample was formed from 151 ninth-grade students from six schools. For analysing students’ argumentation skills and reasoning patterns, a real-life situation was created with ties to scientific and social concepts. The results revealed that it is possible to define three differ-ent patterns of studdiffer-ents’ argumdiffer-entation according to the way of beginning the argumentation. Also other characteristics have differential value: the number, quality and creative component of arguments. The research revealed that stu-dents have problems recognising the scientific nature when facing a socio-sci-entific problem and the students’ use of scisocio-sci-entific language is quite poor and the majority of students prefer to use everyday language.
Key Words argumentation, socio-scientific issues 1. INTRODUCTION
A primary objective for science education is to acquire knowledge that has applica-bility to socio-scientific problems. Sadler et al. (2006) have argued that if scientific literacy represents the ultimate aim of science education, then scientific literacy must entail the ability to thoughtfully negotiate socio-scientific issues (SSI). The term “so-cio-scientific issues” has come to represent controversial social issues with concep-tual, procedural, or technological ties to science. SSI are typically contentious and ill-structured, which implies that they are open-ended problems subject to multiple perspectives and solutions. Socio-scientific issues have become important in science education because they occupy a central role in the promotion of scientific literacy (Sadler & Donnelly, 2006). The processes through which individuals access, negotiate and attempt to resolve SSI has been referred to as informal reasoning (Zohar & Nemet, 2002; Sadler, 2004).
In a broader context, informal reasoning describes how people think about open-ended, ill-structured problems, which are typically contentious and subject to
multi-ple perspectives and solutions (Means & Voss, 1996). SSI represents precisely the kind of ill-structured, complex and controversial issues to which informal reasoning can be applied. Argumentation, as a construct, has been characterized by a multiplicity of descriptions including oppositional interchanges, verbal expression of conflict reso-lution, consensus building, justification of controversial positions, social reasoning, and persuasion (Voss & Van Dyke, 2001). There is an obvious association between informal reasoning and argumentation. Informal reasoning represents the cognitive and affective processes undertaken by an individual as s/he considers ill-structured problems; whereas, argumentation represents the social negotiation of ill-structured problems. Argumentation is, at least in part, the expression of informal reasoning (Driver et al., 2000).
Over the past few decades numerous studies have focused on the analysis of argu-mentation discourse in educational contexts (Driver et al., 2000; Duschl & Osborne, 2002; Kelly & Takao, 2002; Schwarz et al., 2003; Katzav & Reed, 2004). Drawing on
sociological and philosophical studies of science, science educators have begun to view argumentation as a central scientific practice, which students should learn (San-doval & Millwood, 2005). Socio-scientific problems are common in everyday life and to solve them one needs to use scientific knowledge to reason.
There have been several studies within science education on characteristics of stu-dents “argumentation patterns of socio-scientific issues, most of them focusing on the role of scientific knowledge in the students” argumentation (Yang & Anderson, 2003; Sadler & Zeidler, 2004; 2005a,b; Kolstø, 2006).
The goal of this research was to develop a qualitative assessment tool for evalua-tion of students’ reasoning and argumentaevalua-tion skills. Considering this goal, the fol-lowing research questions have been put forward:
1. Does the manner, in which a student begins an argumentation, influence the quality of the argumentation?
2. What characteristics can be effectively used to describe the argumentation skills of students?
3. How does the use of language impact on the quality of argumentation? 4. Do the argumentation skills differ between boys and girls?
This paper reports a qualitative study on students’ argumentation on a socio-sci-entific issue about the smell of smoke. The focus of the study is on the different char-acteristics of reasoning that could be used to describe qualitatively students’ argumen-tation skills in the socio-scientific real-life situation.
2. METHODOLOGY 2.1. Sample
The sample for the current research was formed from 151 (73 boys and 78 girls) nine-grade students in 6 different Estonian primary and secondary schools. The schools were chosen based on science teachers (biology and/or chemistry) who participated in a schoolteachers’ in-service course “The Development of Students’ Critical and Cre-ative Thinking Skills through Real-life Socio-scientific Situations” in the 2005/2006
school year. The instrument assessing the quality of argumentation skills was fulfilled during chemistry lessons. Schools did not assess responses.
2.2. Instrument
To analyse students’ argumentation skills a real-life situation was created with ties to scientific (absorption, smell and olfactory organs, senses etc) and social (smoking as risk behaviour and ethics) concepts. The situation is given below:
Two boys were late for their class. They were chewing bubble gum. One of the boys smelt of smoke. The teacher suspected the boys had been smoking and wanted them to leave the class, as the smell of smoke is not healthful to the other students. The boys argued that they had been in a café eating French fries and that the smell of smoke comes from there. Their classmates tried to protect them and convinced teacher to allow them to join the lesson.
All students were given the task to write their reasons whether the boys were tell-ing the truth if not, and what the boys might have been dotell-ing. The class asked to reason was why one of the boys smelt of smoke yet the other was not.
Science teachers validated this instrument during the in-service course. 34 nine-grade students’ in one randomly chosen secondary school piloted the instrument. 3. RESULTS AND DISCUSSION
To analyse the students’ argumentation skills, a series of characteristics were identi-fied after reading students answers. Those characteristics were considered for finding the patterns of students’ reasoning skills.
The following 5 characteristics were determined:
1.1. Total number of arguments given by students as quantitative measure Table 1 indicates the number of arguments put forward by boys and girls, as well as overall. The number of arguments was taken as indicative of a level and this is also recorded in column 2 of table 1. As seen from Table 1, the majority of students (60%) are at the lowest quantitative level of reasoning. The quantitative level of boys’ argu-mentation is lower than girls’ as almost two thirds of boys (66%) belong to the lowest level (I) of argumentation whereas almost half of girls (46%) belong to the II and III level of argumentation.
Table 1 Number of arguments put forward by students
Number of arguments Level Total number (%) of students Girls Boys
0 – 2 arguments I 90 (60%) 42 (54%) 48 (66%) 3 – 4 arguments II 41 (27%) 25 (32%) 16 (22%)
5 or more arguments III 20
(13%)
11 (14%)
9 (12%)
1.2. Points were awarded depending on the quality of the argument.
According to Table 2, only less than one third of students can reason well with suf-ficient argumentation and without mistakes of logic.
Table 2 Quality of arguments
Description Level
Total number (%) of
students Girls Boys
Presence of contradictions and/or mistakes in logic and/or very poor argumentation (for example 1 or 2 statements but nothing is reasoned) I 26 (17%) 8 (10%) 18 (25%) Presence of some contradictions in
argumentation and/or some mistakes in logic II
81 (54%) 46 (60%) 35 (48 %) Adjoint and well reasoned text with sufficient
argumentation III 44 (29%) 24 (30%) 20 (27%) 1.3. Creative component – the level is depending on how many different
ver-sions students were able to come up with
As seen from Table 3, only less than a quarter of students are creative and the number of boys who are on the lowest level of creative component of argumentation is consid-erably bigger than the number of girls.
Table 3 Creative component of arguments
Description Level
Total number (%) of
students Girls Boys
One version (for example: Kalle was
smoking but Rein was not) I
74 (49%) 32 (41%) 42 (57%) Two different versions (for example: Kalle
was smoking but Rein was not, Rein and Kalle both were smoking)
II 42 (28%) 26 (33%) 16 (22%) Three or more different versions (for
example: Kalle was smoking but Rein was not, Rein and Kalle both were smoking, Kalle was smoking but Rein was not etc.)
III 35 (23%) 20 (26%) 15 (21 %)
1.4. The use of language
The use of language shows scientific component of students’ argumentation. The Ta-ble 4 reveals that the majority of students (63%) use everyday language and only 5% of students use scientific language while arguing over a socio-scientific issue.