Tar. Bil. Der.
Dergi web sayfası: www.agri.ankara.edu.tr/dergi
Journal homepage: www.agri.ankara.edu.tr/journal
Effects of Long-Term Continuous Cropping of Sunflower on K Forms
in Calcareous Soils of Western Azerbaijan Province Iran
Behnam DOVLATIa, Abbas SAMADIa, Shahin OUSTANb
a
Urmia University, College of Agriculture, Soil Science Department, Urmia, 57135, I. R. IRAN b
Tabriz University, College of Agriculture, Soil Science Department, Tabriz, 5166616471, I. R. IRAN
ARTICLE INFO
Research Article Crop Production
Corresponding author: Behnam DOVLATI, e-mail: [email protected], Tel: +98(441) 277 50 35 Received: 12 January 2009, Received in revised form: 24 May 2010, Accepted: 28 May 2010
ABSTRACT
Potassium forms and clay mineral composition of soils under sunflower cropping were compared to those adjacent virgin soils. For this purpose forty surface soil samples belonging to 10 soil series in Western Azerbaijan province, Iran were selected to determine the changes in K forms and K adsorption behaviour of the cultivated soils after long-term cropping. The samples were analyzed for soil physical and chemical properties, mineralogy of clay fraction, different forms of K, and K adsorption characteristics. The soils studied were alkaline and calcareous. Illite, illite-smectite and chlorite- kaolinite were the dominant clay minerals in Typic Xerocrepts, Typic Xerofluventsand Fluventic Xerocrepts, respectively. No changes in K-bearing minerals (illite) were detected due to cropping and K depletion. Soil solution K (So-K) constituted 1.65% of exchangeable K (Ex-K) and 4.35 % of non-exchangeable (NEx-K) for the cultivated soils and 2.54 % of Ex-K and 4.35 % of NEx-K for the adjacent virgin land. Significant declines in Ex-K content from 464 to 241 mg kg-1 (48 %, on average), from 488 to 264 mg kg-1 (46%, on average),
were observed for Fluventic Xerocrepts and Typic Xerofluvents(P ≤ 0.01) soil series, respectively. Significant changes in the NEx-K content were observed after long-term cropping of sunflowers in Fluventic Xerocrepts (P≤0.05) but no changes in Typic Xerofluventsand Typic Xerocrepts of the soils. A highly significant positive relationship (r2 = 0.70, P≤0.01) was observed between NEx-K and illite contents, indicating that this form of K is
mainly released from the frayed edges of illite. Paired t-test revealed that in Fluventic Xerocrepts and Typic xerofluvents, K adsorption significantly was increased (P≤0.01) and exchangeable K was decreased as a result of exhausting cropping of sunflower.
Keywords: Sunflower; K forms; K sorption; Clay mineralogy; Continuous cropping
Đran’ın Batı Azerbaycan Bölgesi Kireçli Topraklarında Sürekli Ayçiçeği
Yetiştirilmesinin Potasyum Formlarına Etkisi
ESER BĐLGĐSĐ
Araştırma Makalesi Bitkisel Üretim
Sorumlu Yazar: Behnam DOVLATI, e-posta: [email protected], Tel: +98(441) 277 50 35 Geliş tarihi: 12 Ocak 2009, Düzeltmelerin gelişi: 24 Mayıs 2010, Kabul: 28 Mayıs 2010
ÖZET
T
A
R
IM
B
İL
İM
LE
R
İ
D
E
R
G
İS
İ
J
O
U
R
N
A
L
O
F
A
G
R
IC
U
LT
U
R
A
L
S
C
IE
N
C
E
S
16 ( 20 10 ) 71 -8 2
belirlenmiştir. Toprak örneklerinin fiziksel ve kimyasal özellikleri, kil fraksiyonunun minerolojisi, potasyumun farklı formları ve adsorpsiyon özellikleri analiz edilmiştir. Topraklar alkalin ve kireçli yapıdadır. Tipik Xerocrepts, Tipik Xerofluvents ve Fluventic Xerocrepts olan topraklarda sırasıyla dominant kil tipleri, illit, illit-smektit ve klorit-kaolinit olarak saptanmıştır. K-içeren minerallerde (illit) ürün yetiştirme ve K azalmasından dolayı bir değişim belirlenmemiştir. Đşlenen toprakların toprak çözeltisinde bulunan K’un (So-K) % 1.65’i değişebilir K (Ex-K) ve %4.35’i değişmeyen K (NEx-K) K’dan oluşurken, işlenmeyen bitişik topraklarda ise %2.54’ü değişebilir K (Ex-K) ve 4.35’i değişmeyen K (NEx-K) K’dan oluşmaktadır. Fluventic Xerocrepts, Typic Xerofluvents(P≤0.01) toprak serilerinde sırasıyla değişebilir K kapsamlarında 464' den 241 mg kg-1’a (ort.% 48), 488’den 264 mg kg-1’a (ort.%46), ye önemli azalmalar olduğu gözlenmiştir. Uzun yıllar ayçiçeği tarımı yapılan toprakların Fluventic Xerocrepts serisinde ki değişemeyen K kapsamında önemli değişim (P≤0.05) olmuştur, hâlbuki diğer serilerde herhangi bir değişim belirlenmemiştir. Değişemeyen K (NEx-K) ve illit kapsamları arasında, önemli pozitif bir ilişki (r2 = 0.70, P≤0.01) belirlenmiştir ve bu K formunu çoğunlukla illitin yıpranmış kenarlarından salındığını gösterir.
Eşleştirilmiş t-testi ile Fluventic Xerocrepts ve Typic xerofluvents’lerde sürekli ayçiçeği tarımının K adsorpsiyonunu önemli derecede arttırdığı değişebilir K miktarını ise azalttığı ortaya konmuştur (P≤0.01).
Anahtar sözcükler: Ayçiçeği; K formları; K sorpsiyonu; Kil mineralojisi; Sürekli işleme
© Ankara Üniversitesi Ziraat Fakültesi
1. Introduction
Successive cropping of potassium-demanding crops like sunflower (Helianthus annus) leads to depletion of soil potassium (K) and change the distribution of K forms. Changes in non-exchangeable K of soils under intensive cropping have been observed in many cases irrespective of the available K status and dominant minerals of soils. Some workers have shown that intensive cropping for a long period reduces the exchangeable K to a minimum level in which the release of non-exchangeable potassium starts (Sachdeva & Khera 1980). Application of K fertilizers increases and subsequent cultivation decreases the amount of exchangeable K. Little change in exchangeable K content of the surface layer (0-15 cm), of a sandy loam in Punjab, India, under a wheat /maize rotation for 10 years (64 kg K
ha-1 yr-1 applied), was also observed by Sharma et
al. (1984). In contrast, the application of 33.6 kg K
ha-1 yr-1 for 47 years to a silt loam soil under winter
wheat resulted in a 58% increase in exchangeable K
content compared to the control (142 mg kg-1)
(Banks et al 1976).
Soil solution K (So-K), exchangeable K (Ex-K), and non exchangeable K (NEx-K) forms are related to soil properties including surface area, mineralogy, surface charge density and degree of interlayering of clay minerals (Shaviv et al 1985). The So-K and Ex-K phases are regarded as readily available forms of K. The NEx-K form is generally
considered to be slowly available form of K occurring in illitic clays and other 2:1 types of integrated minerals (Wood & DeTurk 1940).
Intensive sunflower cropping without proper replacement of nutrients absorbed from the soil especially K, led to a marked depletion of soil K resources, and in turn became a yield-limiting factor in some areas of Iran (Jalali 2005). According to Jalali and Zarabi (2006) the soils in most arid and semiarid regions contain large quantities of exchangeable and non-exchangeable K. The exchangeable K of these soils may be significantly depleted due to the intensive crop production systems. The continued K export without supply will tend to deplete soil potassium. This may take 3 to 10 years, depending on K storage (Kayser & Isselstein 2005). Since plant growth is not directly limited by the amounts of exchangeable K, therefore it should be necessary to elucidate this phenomenon on the basis of equilibrium studies in order to test the immediate power of soils to supply K to plants. This approach needs the use of equilibrium Quantity-Intensity (Q/I) concept as a good tool to provide sufficient data regarding K dynamics in calcareous soils of north-west of Iran under sunflower cropping. Various attempts have been made to characterize
the relationshipbetween intensity and capacity of
soil K or soil K buffering characteristics. This
relationship implies that the ability of a soil system to maintain a certain concentration of a cation in
solution is determined by the total amount of the cation present in readily available forms (exchangeable and soluble) and the intensity by which it is released into the soil solution (Leroux & Sumner 1968). The linear portion of the curve has been ascribed to nonspecific sites for K (Beckett 1964), while the curved portion has been attributed to specific sites with high K affinity (LeRoux & Sumner 1968). The nonspecific sites have been attributed to planar surfaces (Lee 1973), whereas the specific sites have been ascribed to edges of clay crystals and to wedge sites of weathered mica (Rich & Black 1964). Crops with a high dry matter production such as beets have a high K-demand and affect distribution of K forms, K adsorption, and the availability of K to plants. Limited information is available, however, on the effect of continuous cropping on the relative distribution and amounts of K forms, K adsorption, and mineralogy of clay fractions for calcareous soils of Western Azerbaijan Province, Iran.
The aims of the present study were: (1) to determine the content, forms, and distribution of K in cultivated soils and adjoining virgin lands in relation to clay mineralogy composition and other properties; (2) to compared the adsorption of K onto cultivated soil as virgin soils: (3) to investigate the long-term effects of cultivation on the K status of sunflowers-growing calcareous soils.
2. Materials and Methods
2.1. Soils and climate
This study compares the K status of topsoils from sunflower farmlands and the adjacent uncultivated (virgin) areas in western Azarbaijan, Iran. Most of the cultivated areas have been cropped under sunflower-wheat rotations and received irregular application of K fertilizers for at least 50-80 years. The adjacent virgin areas are under vegetation including shrubs and various native grasses. The area studied predominantly presents a semi-arid
climate with mean annual rainfall of 280 mm year-1
and mean minimum and maximum temperatures of -4°C in winter and 37°C in summer. Parent materials in study area originated mainly from calcareous rocks and concerned to the quaternary geology period.
Forty soil samples (20 cultivated and 20 virgin soils), (0-30 cm) belonging to 10 soil series were collected from the major sunflower growing soils and the adjacent virgin lands. Typic Fluventic
Xerocrepts, Typic Xerocrepts and Typic
Xerofluventsare the major soil sub group types found in this area. Typic Fluventic Xerocrepts and Typic Xerocrepts were classified under Inceptisols and Typic Xerofluventswas put under entisols order according to USDA Soil Taxonomy (Soil Survey 1999).
The soil samples were air dried and ground to pass through a 2 mm-sieve before use. pH was
determined using 1:5 soil to 0.01 M CaCl2
suspension by a glass electrode and EC was determined in saturated extracts of the soils (Blakemore et al 1981). Particle size distribution was determined by the sedimentation procedure using the pipette method (Gee & Bauder 1986). Total soil carbonates expressed as calcium carbonate equivalent (CCE) were determined by a rapid titration method (Rayment & Higginson 1992). Organic carbon was determined by wet digestion (Nelson & Sommer 1996). Cation exchange capacity (CEC) of the soils was determined by the 1 M NaOAc (pH 8.2) methods.
2.2. Soil mineralogy analysis
Soil mineralogy analysis by x-ray diffraction was performed on the < 2mm clay fraction. Prior to separation of soil particles, subsamples of the soils were treated with 1 M NaOAc (pH 5) to removal of
carbonates and with 30% H2O2 to remove organic
matter (Kunze 1965) and finally with Na-dithionite-citrate-bicarbonate to removal of Fe oxides (Mehra & Jackson 1960). Sand was separated from silt and clay by wet sieving and clay was separated from silt by centrifugation and decantation. After saturation
of the specimens with Mg+2 (with and without
glycerol salvation) and K+ (with and without
heating at 550°C) X-ray diffractograms were obtained by a computer-controlled Shimatzo XRD-6000 instrument employing a CuKα radiation source. Semi-quantitative percentages of clay minerals were calculated using diffractogram peak areas and standard weighting factors of Biscaye (1965) as follows: four times for the illite peak area, two times for the kaolinite + chlorite peak area, and
one times for the smectite peak area and then normalized to 100%. Random powder diffraction patterns were obtained after packing the powdered samples into aluminum holders and scanning them from 3 to 60° 2θ. A step size of 0.02° 2θ and scan speed of 1° 2θ were used for all the samples.
2.3. K forms and K exchangeable isotherms
Soil solution K (So-K) was determined by shaking 5 g air-dried soil in 25ml distilled water overnight, followed by centrifugation and filtration. Plant available K (exchangeable + water soluble) was measured by shaking 10 g soil in 100 ml 1M ammonium acetate (buffered at pH 7) for 30 minutes in an end-over-end shaker, followed by centrifugation, filtration and K determination using flame photometer (Knudsen et al 1982). The exchangeable K (Ex-K) was calculated by subtracting the amounts soil solution K from the
NH4AOc-extractable K values. The HNO3
extractable K was determined by boiling 2.5 g soil
with 25 ml 1M HNO3 for 10 minutes and analyzing
the extracted K using flame photometer (Knudsen et al. 1982). Non-exchangeable K (NEx-K) was
calculated by subtracting the amounts of NH4
AOc-extractable K from the HNO3-extractable K values.
K-index was calculated with equation of K-index
(%) =(Kav (cmol+/kg)*100)/CEC (cmol+/kg) (Mutscher
1995). Potassium sorption studies were performed by shaking soil samples (2.5 g) with solutions of
0.01mM CaCl2 (25ml) containing different amounts
of K (0 to 80 mg l-1).The samples were equilibrated
on an end-over-end shaker for 24 hours, followed by centrifugation, filtration and K determination using flame photometer.
3. Results and Discussion
3.1. Characteristics of soils
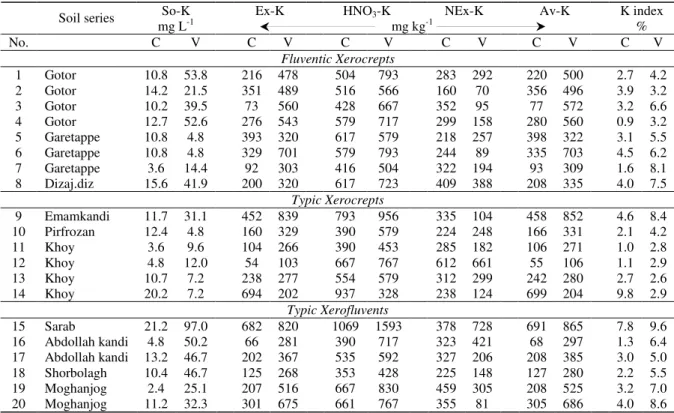
Selected properties of soils studied are presented in Table 1. The soils are calcareous and alkaline. The CCE content ranged from 4.4 to 19% with a mean of 14% for the cultivated soils and between 3.9 and 23% with a mean of 13% for the adjacent virgin soils. The pH values varied from 7.5 to 8.2 for the cultivated soils and between 7.7 and 8.3 for the virgin soils. The electrical conductivity (EC) ranged
from 0.3 to 2.3 dS m-1 for the cultivated soils and
between 0.52 and 9.01 dS m-1 for the virgin soils.
Soil organic carbon (SOC) varied from 0.09 to 1.13% (0.6%, on average) for the cultivated soils and between 0.31 and 1.6 % (0.71%, on average) for the virgin lands. The soil texture varied form sandy loam to clay. The CEC ranged from 12 to 28
cmolc kg-1 (21 cmolc kg-1, on average) for the
cultivated soils and between 9 and 28 (21 cmolckg
-1, on average) for the virgin soils. The Gotur soil
series belonging to the Fluventic Xerocrept soil type had the highest clay content and CEC (Table 1). Regression analysis showed that for the soils investigated, CEC depends more on the soil clay content (r = 0.75, P < 0.001) than on OC content (r = 0.51, P < 0.05).
Continuous intensity cropping was related to changes in soil properties particularly SOC and CEC. A pronounced decline in SOC content (30%) was detected in the Typic Xerofluventsand to a less extent in Typic Xerocrepts, and Fluventic Xerocrepts soil types although it was not statistically significant (Table 2). Data from long-term cropping system experiments have repeatedly shown that continuous cultivation declines soil OC and degrades soil quality compared to conditions with native vegetation, regardless of cropping system (Scholes & Breemen 1997). When continuous cultivation is combined with removal of most crop residues after harvest, this decline may be high. The low clay content of soil may be an important factor in decomposing soil organic matter. The presence of a close relationship between soil OC and clay content (P<0.01) indicated that the clay particles protect soil organic matter from decomposition (Van veen & Paul 1979).
The semi-quantitative estimates of relative clay-mineral percentages revealed that the predominant minerals in the clay fraction are illite in Typic Xerofluvents(Moghanjog soil series) and Typic xerocrept (Khoy) and smectite in Typic Xerofluvents(Shorbolag) and chlorite - Kaolinite in Fluventic Xerocrepts (Gotur, Garataphe) (Table 3). Partial swelling found in glycerol-treated samples belonging to the Typic Xerocrepts, Typic Xerofluventsand Typic Xerocrepts soil types and collapse of the related peak to approximately 10 Å in K-saturated and heated (to 550°C) samples
Table 1-Physical and chemical properties of the selected soils
Çizelge 1-Seçilen toprakların fiziksel ve kimyasal özellikleri
CEC Sand Clay SP CCE SOC pH cmolckg-1 % 0.01M CaCl2 Soil series V C V C V C V C V C V C V C No. Fluventic Xerocrepts 21 20 28 25 37 40 43 50 17 17 0.43 0.34 7.8 8.2 Gotor 1 25 26 10 15 55 52 50 52 13 14 0.69 0.89 8.1 8.0 Gotor 2 27 27 18 10 37 42 49 52 11 15 1.37 0.77 7.7 7.9 Gotor 3 25 26 20 15 35 50 46 49 14 15 0.75 0.70 7.9 7.6 Gotor 4 23 23 39 35 18 21 31 39 23 19 0.38 0.57 8.3 7.9 Garetappe 5 20 20 45 50 20 17 34 36 18 19 0.61 0.51 7.9 8.0 Garetappe 6 18 18 70 80 12 5 31 34 9.0 7.5 0.46 0.09 8.0 7.8 Garetappe 7 19 18 60 20 20 15 32 32 13 10 0.69 0.46 8.1 8.0 Dizaj.diz 8 Typic Xerocrepts 26 25 30 18 40 45 43 50 12 15 0.99 1.13 8.0 8.0 Emamkandi 9 20 20 53 53 10 15 41 42 12 13 0.84 0.69 7.7 7.5 Pirfrozan 10 25 28 20 7.9 42 45 47 53 18 19 0.99 0.81 7.8 7.9 Khoy 11 9.3 13 60 55 12 15 29 29 3.9 4.4 0.31 0.41 7.7 7.7 Khoy 12 28 23 35 33 32 32 39 39 10 13 0.57 0.61 7.9 7.9 Khoy 13 18 18 67 68 8.3 7.1 27 27 5 10 0.39 0.67 7.9 7.7 Khoy 14 Typic Xerofluvents 20 23 40 53 22 17 33 43 15 15 0.52 0.97 8.1 8.0 Sarab 15 12 14 53 45 20 27 32 33 18 18 0.63 0.21 7.8 8.2 Abdollah kandi 16 20 18 43 38 20 20 37 41 18 18 0.69 0.55 7.9 8.0 Abdollah kandi 17 19 15 38 65 32 10 37 27 14 14 0.94 0.31 7.7 7.8 Shorbolagh 18 23 17 45 33 27 35 45 37 10 10 1.55 0.60 8.0 8.1 Moghanjog 19 13 20 70 40 7 22 26 34 15 15 0.39 0.69 7.9 8.0 Moghanjog 20
CCE: calcium carbonate equivalent, SOC: soil organic carbon, sp: saturation percentage, CEC: cation exchange capacity Table 2-Mean ± standard deviation (SD) values of selected soil properties and K forms
Çizelge 2-Toprak özellikleri ve K formları analiz sonuçları ortalamaları ve standart sapmaları
Variable Fluventic Xerocrepts Typic Xerocrepts Typic Xerofluvents V C Change
% Paired t-test V C Change % Paired t-test V C Change % Paired t-test pH (0.01M CaCl2) 7.97±0.2 7.9±0.18 0.90 0.691 7.8±0.14 7.77±0.2 0.4 0.326 7.89±0.14 8.0±0.15 -1.4 0.269 SOC (%) 0.67±0.32 0.54±0.25 19 0.241 0.68±0.3 0.72±0.24 -5.9 0.607 0.79±0.42 0.55±0.27 30 0.088 CCE (%) 14.4±4.3 14.5±4.1 -0.7 0.693 9.98±4.98 12.3±5.0 -23 0.017 13.1±2.6 15.1±2.5 -15 0.092 SP (%) 39.5±8.4 42.8±8.6 -8.4 0.016 37.7±8.1 40.1±10.4 -6.4 0.099 35.1±6.5 35.9±5.8 -2.3 0.321 Clay (%) 28.2±15.6 30.1±17.8 -6.7 0.429 24±15.7 26.2±16.4 -10 0.079 21.3±8.5 21.7±8.6 -2.2 0.867 Sand (%) 36.5±21.3 37.3±27.8 -2.2 0.717 44.4±18.3 39.2±23.4 12 0.089 48.4±12 46±11.8 5.2 0.314 CEC(cmolc kg-1) 22.4±3.3 20.9±5.5 6.7 0.157 21.1±6.9 21.3±5.2 -0.9 0. 867 17.9±4.4 17.6±3.3 1.8 0.663 EC (dS m-1) 4.5±3.2 1.38±0.75 69 0.016 0.77±0.27 0.72±0.10 6.5 0.687 4.8±2.6 1.3±0.49 74 0.012 So-K (mg l-1) 29.2±20.3 11.1±3.6 62 0.033 12±9.7 10.6±6 12 0.784 49.7±25.2 10.5±6.6 79 0.005 KHNO3 (mg kg-1) 668±108 532±79.4 20 0.0095 610±224 622±220 -2 0.929 821±404 613±259 25 0.038 NEx-K (mg kg-1) 193±113 286±78.4 -48 0.032 270±206 334±142 -24 0.193 315±235 345±77 -9.4 0.756 Av-K (mg kg-1) 475 ±142 246±119 48 0.0071 341±262 288±246 15.5 0.689 506±233 268±222 47 0.003 Ex-K (mg kg-1) 464±144 241±119 48 0.0071 336±262 284±246 15.5 0.689 488±235 264±223 46 0.002 K-index (%) 5.4±1.86 2.93±1.2 46 0.0099 3.9±2.2 3.49±3.33 11 0.804 6.8±1.8 3.5±2.3 48 0.002 PBCK(cmol kg-1)/ (mol l-1) 0.5 32±8.2 34.3±31.9 -7.2 0.842 37.5±9.9 50.7±40.1 -35 0.541 21.1±6.37 31.4±10.2 -49 0.021
a Differences with P≥0.05 are not significantly different according to paired t-test results. V: virgin, C: Cultivate soil, PBCK: Potential
Buffering Capacity, K-index (%)= Kav (cmol+/kg)*100/CEC cmol+/kg , CCE: calcium carbonate equivalent, SOC: soil organic carbon, sp: saturation
percentage, CEC: cation exchange capacity, So-K: soil solution K, Ex-K: soil exchangeable K, NEx-K: non exchangeable K, Av-K: available K
indicated that the smectite was randomly interstratified with vermiculite, which is quite common in soil smetites (Figure 1). Similar observations were also made by other workers (Bedrossian & Singh 2004). The random powder diffraction patterns of whole samples showed the presence of quartz in all of the samples. Calcite and alkaline feldspars were the other minerals that frequently occurred in most samples. Peaks for chlorite, illite, and kaolinite were also observed in the random powder XRD pattern (not shown here). The quartz content decreased considerably in the clay fraction.
3.2. Contents of K forms
Mean ± standard deviation (SD) values of various K forms for the soil series of three major soil types are presented in Table 2. In general, the Typic Xerofluventsand Fluventic Xerocrept soil types had larger amounts of soluble K, exchangeable K, and non-exchangeable K compared with the Typic Xerocrepts (Table 2). This could be attributed to the presence of high amount of mica-K mineral which on weathering releases and contributes to various forms of soil potassium as evident from the semi-quantitative clay mineralogical studies (Table 3) (Hebsur & Satyanarayana 2002).
3.3 Soil solution K (So-K)
Soil solution K is available immediately to the plant and the concentration is affected by soil weathering, cropping history, past fertilizer use, but the amount present is insufficient to meet crop requirement. Concentration of K in solution of the investigated
soils ranged from 2.4 to 21 mg l-1 with a mean
value of 11 mg l-1 for the cultivated soils and
between 4.8 and 97 mg l-1 with a mean value of 30
mg l-1 for the adjacent virgin land. According to the
results Typic Xerofluventscontain the highest amount of So-K (Table 4).The soil solution data for the soils studied are comparable with those from south Australia (Pal et al. 1999) where the range
was 5.1- 17.2 mg l-1 for the cultivated soils.
Gawander et al (2002) found that the range of So-K for soils of sugar cane growing area in Fiji was
2.34-62 mg l-1 (with a mean value of 12.1 mg l-1),
which is also comparable with those for the studied cultivated soils. On average, So-K constituted 1.6
% of Ex-K and 1.35 % of NEx-K for the cultivated soils and 2.5 % of Ex-K and 4.4 % of NEx-K for the adjacent virgin land.
Long-term cultivation resulted in changes in So-K contents. In general, there was a decline in So-So-K with cultivation in all soil types except Typic Xerocrepts (Table 2). A significant decline
(P<0.05) in So-K content from 29.2 to 11.1 mg l-1
(62%) was detected in the soil type of fluventic xerocreprts and significant decline (P<0.01) in
So-K content from 49.7 to 10.5 mg l-1 (79%) was
detected in the soil type of typic xerofluvents. As expected, So-K showed similar trends to those of Ex-K, i.e., cultivated soils had lower levels of So-K than virgin land for the Veritic calcixerepts soil type.
3.4. Available K (Av-K)
Available K plays a very important role in the growth of plants because exchangeable and solution K are only sources of potassium which are readily available to plants. Values of Av-K ranged from 55
to 699 mg kg-1 with mean value of 265 mg kg-1 for
the cultivated soils and between 106 and 865 mg
kg-1 with mean value of 444 mg kg-1 for the
adjacent virgin land. According to the new soil test interpretation classes for K, all of the cultivated soils are grouped in very high category (>201 mg
kg-1 K). The optimum category of this interpretation
is 131 to 170 mg kg-1 K measured with ammonium
acetate for 0 to 15 cm of the soil (Mallarino et al 2003).
Exchangeable potassium is often used as indicator of soil K status and the likelihood of a response to K fertilizer because of the close relationship between crop response and the amount of Ex-K in soil. Concentration of Ex-K varied greatly between the cultivated soils and the virgin lands (Table 4). Ex-K contents ranged from 54 to
694 mg kg-1 with a mean value of 261 mg kg-1 for
the cultivated soils and between 103 and 902 mg
kg-1 with a mean value of 434 mg Kg-1 for the
adjacent virgin lands. These values are comparable with those found for sunflower growing soils in eastern Anatolia, Turkey (Cimarin et al 2004). The Fluventic Xerocrepts, Typic Xerocrepts and Typic xeroflovents soil types had the high amount of exchangeable K.
Table 3-Percent distribution of minerals in clay fraction of the selected cultivated soils
Çizelge 3-Ekim yapılan toprakların kil mineralleri yüzde dağılımları
No. Soil series % Illite % Chlorite+Kaolinite % Smectite
2 Gotur 22 71 7 3 Gotur 17 73 10 4 Gotur 18 67 15 Fluventic Xerocrepts 7 Garataphe 25 44 31 12 Khoy 36 47 17 Typic Xerocrepts 10 Pirfruzan 18 68 14 18 Shorbolag 24 28 47
Typic Xerofluvents 19 Moghanjog 45 47 8
Fluventic Xerocrepts Khoy series
2 Theta (degree)
Typic Xerofluvents Shorbolag series
Fluventic Xerocrepts Garatape series
2 Theta (degree) Typic XerocreptsPirfruzan series
in
te
n
s
it
y
(
C
P
C
)
in te n s it y ( C P C ) 10.02A0 I (001) 5.03A0 I (002) 14.1A0 Ch (001) dc
b a 18.1A0 Sm (001) 18.1A0 Sm (001) 7.1A0 Ch(002)+Ka(001) 14.1A0 Ch (001) 18.1A0 Sm (001) 7.1A0 Ch(002)+Ka(001) dc
b a dc
b a dc
b aFigure 1-The X-ray diffractograms correspond to the following treatments: a) Mg saturation at 25°C; b) Mg saturation and glyscerol salvation; c) K saturation at 25°C; d) K saturation at 550°C for the studied major soil types under sunflower cultivation. Ch, chlorite; Ka, kaolinite; I, illite; Sm, smectite
Table 4-Potassium saturated index and K contents of the various K forms for soil series of three major types
Çizelge 4-Üç faklı toprak alt grubunda K formlarının K içerikleri ve potasyum doymuşluk indeksi
K index Av-K NEx-K HNO3-K Ex-K So-K % mg kg-1 mg L-1 Soil series V C V C V C V C V C V C No. Fluventic Xerocrepts 4.2 2.7 500 220 292 283 793 504 478 216 53.8 10.8 Gotor 1 3.2 3.9 496 356 70 160 566 516 489 351 21.5 14.2 Gotor 2 6.6 3.2 572 77 95 352 667 428 560 73 39.5 10.2 Gotor 3 3.2 0.9 560 280 158 299 717 579 543 276 52.6 12.7 Gotor 4 5.5 3.1 322 398 257 218 579 617 320 393 4.8 10.8 Garetappe 5 6.2 4.5 703 335 89 244 793 579 701 329 4.8 10.8 Garetappe 6 8.1 1.6 309 93 194 322 504 416 303 92 14.4 3.6 Garetappe 7 7.5 4.0 335 208 388 409 723 617 320 200 41.9 15.6 Dizaj.diz 8 Typic Xerocrepts 8.4 4.6 852 458 104 335 956 793 839 452 31.1 11.7 Emamkandi 9 4.2 2.1 331 166 248 224 579 390 329 160 4.8 12.4 Pirfrozan 10 2.8 1.0 271 106 182 285 453 390 266 104 9.6 3.6 Khoy 11 2.9 1.1 106 55 661 612 767 667 103 54 12.0 4.8 Khoy 12 2.6 2.7 280 242 299 312 579 554 277 238 7.2 10.7 Khoy 13 2.9 9.8 204 699 124 238 328 937 202 694 7.2 20.2 Khoy 14 Typic Xerofluvents 9.6 7.8 865 691 728 378 1593 1069 820 682 97.0 21.2 Sarab 15 6.4 1.3 297 68 421 323 717 390 281 66 50.2 4.8 Abdollah kandi 16 5.0 3.0 385 208 206 327 592 535 367 202 46.7 13.2 Abdollah kandi 17 5.5 2.2 280 127 148 225 428 353 268 125 46.7 10.4 Shorbolagh 18 7.0 3.2 525 208 305 459 830 667 516 207 25.1 2.4 Moghanjog 19 8.6 4.0 686 305 81 355 767 661 675 301 32.3 11.2 Moghanjog 20
V: virgin, C: cultivated soil, So-K: soil solution K, Ex-K: soil exchangeable K, NEx-K: non exchangeable K, Av-K: available K Conversion of nature lands to cultivated soils and
continuous cultivation resulted in changes in Ex-K contents. In general, there was a decline in Ex-K content with cultivation in all soil types (Table 2). A pronounced significant decline (P < 0.01) in
Ex-K content from 464 to 241 mg kg-1 (48 %) in
Fluventic Xerocrepts and from 488 to 264 mg kg-1
(46%) in Typic Xerofluventswas detected. However, there was a non-significant (P = 0.69)
decline in Ex-K content (336 to 284 mg kg-1) of
Typic Xerocrepts caused by cultivation.
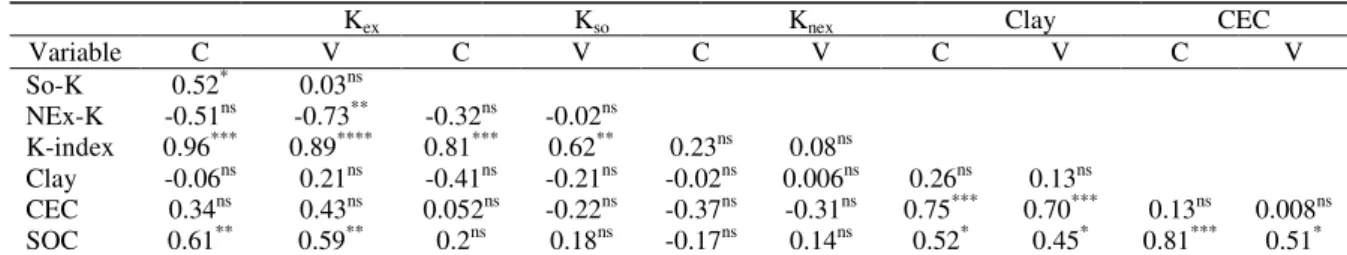
Correlation coefficients (r) for the linear relationships between soil properties and K forms are given in Table 5. There were positive significant relationships between Ex-K and soil OC content in the cultivated and adjacent soils (P <0.01), but there were no significant relationships between Ex-K and clay content in the cultivated and adjacent soils. These results are comparable with those found for
sugar beet growing soils in eastern Anatolia, Turkey (Mesut et al 2004) indicating that as the amount of exchange complex increases, Ex-K content increases. This is a well-known fact in the literature (Pal et al 1999). The trend could be corroborated with mineralogy, which is rich in K-bearing minerals like mica and feldspars in course fractions and illite in clay fractions. Significant relationship between Ex-K and other K forms suggests that K forms are present in dynamic equilibrium (Sharma et al 2006).
3.5. Non-exchangeable K (NEx-K)
Native fixed K and recently fixed K could be grouped together to make up the pool of non-exchangeable inorganic K in the soil (Liu et al 1997). K fixation and release are determined by the amount of lattice clay (illite, vermiculite, and other K-rich minerals) in the soil as well as such factors
Table 5-Correlation coefficients (r) for linear relationship between K forms and soil properties
Çizelge 5-Toprak özellikleri ve K formları arasındaki linear korelasyon katsayıları
*, **, ***, significant at P < 0.05 P < 0.01 and P<0.001 respectively, ns: non-significant, Kex: soil exchangeable K, Kso: soil solution K, Knex: non exchangeable K, Kav: available K
as past additions of fertilizer and manure K, depletion of soil K due to crop removal and soil pH. The effect of weathering processes on potassium feldspars results in the release of a small amount of lattice K into the soil solution. NEx-K is in equilibrium with Ex-K and So-K as an important reservoir of potassium. Because of this equilibrium, some potassium applied as fertilizer can be temporarily converted to the non-exchangeable form. Non-exchangeable K ranged from 160 to 612
mg kg-1 with a mean value of 318 mg kg-1 for the
cultivated soils and between 70 and 728 mg kg-1
with a mean value of 253 mg kg-1 for the virgin
adjacent lands. The NEx-K values in our study are higher than the values reported by Pal et al (1999) for Western Australia soils and Gawander et al (2002) for sugarcane growing soils from Figi, but are lower than the values reported by Bedrossian &
Singh (2004) for cotton growing soils (819 mg kg-1)
from northern New South Wales, Australia. The soil types of Khoy and Moghanjogh series,
contained much NEx-K, (612 and 459 mg kg-1,
respectively) probably because they have high contents of illite, (36 and 45%, respectively) the reverse was true for the soil types of Typic
Xerocrepts (with a mean value of 166 mg kg-1 for
NEx-K) containing low illite (18%) (Table 3). A highly significant positive relationship was observed between the values of NEx-K and illite
contents (r2 = 0.70, P < 0.01) (Figure 2), indicating
that this form of K is mainly released from the frayed edges of illite. These results are consistent with earlier published works (Bedrossian & Singh 2004).
Long-term continuous sunflower cultivation did not result in changes in NEx-K contents in the soils
were studied except Fluventic Xerocrepts sub groups (48%) (P < 0.05) (Table 2). The lack of significant changes in the NEx-K form indicates that sunflower has met its K requirement mainly from available form (Ex-K + So-K forms) during long-term cropping. Fergus & Martin (1972) show that, providing of depletion Ex-K more than 80% to release NEx-k in soil solution.
3.6. K sorption isotherms
Potassium sorption isotherms for the studied soil types under continuous sunflower cropping and the adjacent virgin lands are presented in Figure 3. The soils differed in their K-sorption behavior. In general, sorption K increased in the all soil series. Equilibrium K concentration (EKC) in soil solution of the soils (i.e., no net sorption or desorption)
ranged from 0.02 to 54.7 mg l-1 for the cultivated
soils and between 24 and 203 mg l-1 for the adjacent
virgin lands.
The K power buffer capacity (PBCK), is defined
as the capacity of soils to resist change in the K
concentration in soil solution. The content of PBCK
for the cultivated and virgin soils has shown in
Table 2. In general, the higher PBCK are for the
soils containing large amounts of clay and smectite and indicative of the continuing availability of adequate K over a long period of cropping, whereas a low power buffering indicates the need for frequent fertilisation (Pal et al 1999).
Paired t-test revealed that continuous sunflower cultivation increased significantly (P < 0.01) K depletion in Fluventic Xerocrepts (Gotur series No. 3) and Typic Xerofluvents (Abdollahkandi series No. 17) (Table 2, Figure 3), where exchangeable K was decreased as a result of intensive cultivation
CEC Clay Knex Kso Kex V C V C V C V C V C Variable 0.03ns 0.52* So-K -0.02ns -0.32ns -0.73** -0.51ns NEx-K 0.08ns 0.23ns 0.62** 0.81*** 0.89**** 0.96*** K-index 0.13ns 0.26ns 0.006ns -0.02ns -0.21ns -0.41ns 0.21ns -0.06ns Clay 0.008ns 0.13ns 0.70*** 0.75*** -0.31ns -0.37ns -0.22ns 0.052ns 0.43ns 0.34ns CEC 0.51* 0.81*** 0.45* 0.52* 0.14ns -0.17ns 0.18ns 0.2ns 0.59** 0.61** SOC
(Gawander et al 2002). Similar results has been reported that the original exchangeable K content
(54 mg kg-1) of six surface soils (0-15 cm) in
Alabama under a 2-yr cotton (Gossypium hirsutum L. )/vetch (Vicia villosa L.)/corn (Zea mays L.) rotation, receiving no fertilizer K, decreased 26% over a 50-yr period, whereas application of 112 kg
K ha-1 yr-1 over a 21-yr period, increased
exchangeable K an average of 240% (Cope 1981 ). So in these soils with increase initial concentration of K, increase quantity sorption. For Typic
Xerocrepts (Khoy series No 14), EX-K was
increased due to a partial build up of exchangeable K probably as a consequence of application of fertilizer and or manure.
y = 11.74x + 27.8 R2 = 0.70** 0 100 200 300 400 500 600 700 0 10 20 30 40 50 Illite (%) N E x-K (m gK g-1)
Figure 2-Relationship between the values of NEx-K and illite contents. (**, significant at P < 0.01)
Şekil 2-Đllit içerikleri ve NEx-K değerleri arasındaki
ilişkiler (**, P < 0.01 önemli)
Figure 3-K sorption isotherms for the cultivated and virgin major soil types
Şekil 3-Ekim yapılan ve yapılmayan bazı toprak tiplerinin K adsorpsiyon izotermleri
Typic Xerofluwents (Abdollah kandi series No.17)
y = 4.367x - 69.66 R² = 0.916*** y = 2.706x - 291.3 R² = 0.958*** -300 -200 -100 0 100 200 0 20 40 60 80 100 Equibilium K Concentratiob (mg/l) K a ds or pt io n m g kg -1 Cultivated soil Virgin soil Fluventic Xerocrets
(Gotur series No.3)
y = 10.31x - 37.87 R² = 0.989*** y = 4.656x - 488.8 R² = 0.959*** -400 -200 0 200 400 600 0 20 40 60 80 100 Equibilium K Concentration (mg/l) K a d so rp ti on m g k g -1 Cultivated soil Virgin soil Typic Xerocrepts (Khoy series No.11)
y = 12.54x - 139.0 R² = 0.979*** y = 4.122x - 99.49 R² = 0.979*** -100 0 100 200 300 400 500 0 20 40 60 80 Equibilium K Concentration (mg/l) K a ds or pt io n m g kg -1 Cultivated soil Virgin soil Typic Xerocrepts (Pirforuzan series No.10)
y = 3.406x - 31.11 R² = 0.955*** y = 4.496x - 183.2 R² = 0.960*** -150 -100 -50 0 50 100 150 200 0 20 40 60 80 Equibilium K Concentration (mg/l) K a ds or pt io n m g kg -1 Cultivated soil Virgin soil
4. Conclusion
Most of the soils studied contain medium to high plant-available K and other forms of K due to their high contents of K-bearing minerals. Despite continuous cultivation and K removal by sunflower as a high K-demanding crop, no transformations of micaeous minerals could be detected by XRD in the investigated soils. A highly significant positive relationship was observed between the value of non-exchangeable K and illite content indicating that this form of K is mainly released from the frayed edges of illite. Although conversion of virgins to cultivated soils and subsequent continuous cropping resulted in pronounce a significant decline (46%) in the exchangeable K contents, the potassium potential of the soils, regarding both non-exchangeable and exchangeable K, is sufficient for the current agricultural practices. Paired t-test revealed that continuous cropping increased significantly K adsorption in most of the soils studied.
References
Banks P A, Santelmann P W & Tucker B B (1976). Influence of long-term soil fertility treatments on weed species in winter wheat. Agronomy Journal 68: 825-827
Beckett P H T (1964). Studies on soil potassium. II. The immediate Q/I relation of labile potassium in the soil.
Journal Soil Science 15: 9-23
Bedrossian S & Singh B (2004). Potassium adsorption characteristics and potassium forms in soils of New South Wales soils in relation to early senescence in cotton. Australian Journal of Soil Research 42: 747-753
Biscaye P E (1965). Mineralogy and sedimentation of recent deep sea clay in the Atlantic Ocean and adjacent seas and oceans. Geo Science World Bulletin GSAB 76:803–832
Blakemore L C, Searle P L & Daly B K (1981). Methods of Chemical Analysis of Soils. New Zealand Soil Bureau Scientific Report 10A (Revised), Wellington Cimarin K M, Akca E, Şenol M, Buyuk G & Kapur S
(2004). Potassium potential of the soils of the Gevas region in Eastern Anatolia. Turkish Journal of
Agriculture and Forestry 28: 259-266
Cope J T (1981). Effects of 50 years of fertilization with phosphorus and potassium on soil test levels and
yields at six locations. Alluvial-derived soils of Western Iowa. Soil Science Society of America
Journal 45: 342-347
Fergus I F & Martin A E (1972). Studies on potassium. IV. Interspecific differences in the uptake of non-exchangeable potassium. Australian Journal of Soil
Research 12 (2): 147-158
Gawander J S, Gangaiya P & Morrison R J (2002). Potassium studies on some sugarcane growing soils in Fiji. South Pacific Journal of Natural Science 20: 15-21
Gee G W & Bauder J W (1986). Particle-sized analysis In: A Klute, et al (Eds.), methods of soil analysis. Part 1: Physical and mineralogical methods. 2nd edn, pp. 383–411. (SSSA, ASA: Madison, WI)
Hebsur N S & Satyanarayana T (2002). Potassium status and clay mineralogical composition some sugarcane soils of North Karataka. 17th WCSS, 14-21 August
2002, Thailand. 361-365
Jalali M (2005). Release kinetics of non-exchangeable potassium in calcareous soils. Communications in
Soil Science and Plant Analysis 36: 1903–1917
Jalali M & Zarabi M (2006). Kinetics of nonexchangeable-potassium release and plant response in some calcareous soils. Journal of Plant
Nutrition and Soil Science 169: 194–204
Kayser M & Isselstein J (2005). Potassium cycling and losses in grassland systems: a review. Grass Forage
Science 60: 213–224
Knudsen D, Peterson G A & Pratt P F (1982). Lithium, sodium and potassium. In: A L Page & et al (Eds.), Methods of Soil Analysis. Chemical and Microbiological Properties 2nd edn, American Society of Agronomy Madison Wi. Agronomy 9: 403-429
Kunze G W (1965). Pretreatment for mineralogical analysis. In: C. A. Black (Eds.), Methods of soil Analysis. American Society of Agronomy Madison Wi. Agronomy 9: 210-221
Lee R (1973). The K/Ca Q/I relation and preferential adsorption sites for potassium. New Zealand Soil Bureau Scientific Report II
LeRoux J & Sumner M E (1968). Labile potassium in soils: I. Factors affecting the quantity-intensity (Q/I) parameters. Soil Science 106: 35-41
Liu Y J, Laird D A & Barak P (1997). Release and fixation of ammonium and potassium under long-term fertility management. Soil Science Societies
Mallarino A P, Wittry D J & Barbagelata P A (2003). New soil test interpretation classes for potassium.
Better Crops 87: 12-14
Mehra O P & Jackson M L (1960). Iron oxide removal from soils and clays by a dithionite–citrate system buffered with sodium bicarbonate. Clays and Clay
Minerals 7: 317–327
Mesut Ç K, Erhan A, Şenol M, Büyük G & Kapur S (2004). Potassium potential of the soils of the Gevaş region in Eastern Anatolia. Turkish Journal
Agricultural Forestry 28: 259-266
Mutscher H (1995). Measurement and assessment of soil potassium. IPI Research Topics No. 4 (revised version), International Potash Institute Basel, Switzerland, 102 pp
Nelson D W & Sommers L E (1996). Total carbon, organic carbon, and organic matter. In: D.L. Sparks et al (Eds.), Methods of soil analysis. Part 3: chemical methods. Book Series No. 5. pp. 961–1010. (SSSA, ASA: Madison, WI)
Pal Y, Wong M T F & Gilkes K J (1999). The forms of potassium and potassium adsorption in some virgin soils from South-Western Australia. Australian
Journal Soil Research 37: 695-709
Rayment G E & Higginson F R (1992). Oxalate-extractable Fe and Al. In “Australian laboratory Handbook of Soil and Water chemical Methods”. Inkata Press, Melbourne
Rich C I & Black W R (1964). Potassium exchange as affected by cation size, pH, and mineral structure.
Soil Science Societies American Journal 97:384-390
Sachdeva C B & Khera M S (1980). Utilization of potassium from non-exchangeable sources in soil under intensive wheat-bajra cropping system.
Fertilizer News 25 (6): 6-10
Scholes R J & Van Breemen N (1997). The effect of global change on tropical ecosystems. Geoderma 79: 9-24
Sharma K N, Singh B, Rana D S, Kapur M L & Sodhi J S (1984). Changes in soil fertility status as influenced by continuous cropping and fertilizer applications.
Journal of Agricultural Science 102: 215–218
Sharma B D, Mukhopadhya S S & Sawhney J S(2006). Distribution of potassium fractions in relation to landforms in a Himalayan catena. Archive of
Agronomy and Soil Science 52: 469-476
Shaviv A, Mohsin M, Pratt P F & Mattigod S V (1985). Potassium fixation characteristics of five southern California soils. Soil Science Societies American
Journal 49:1105-1109
Soil Survey (1999). Soil Taxonomy, A Basic System of Soil Classification for Making and Interpreting Soil Surveys. USDA-NRCS, Agriculture Handbook No. 436. U.S. Government Printing Office. p. 870 Van Veen J A & Paul E A (1979). Conversion of
biovolume measurements of soil organisms grown under various moisture tensions, to biomass and their nutrient content. Applied and Environmental
Microbiology 37: 686-692
Wood L K & DeTurk E E (1940). The absorption of potassium in soils in non-exchangeable forms. Soil