Contents lists available at ScienceDirect
Ecological Indicators
journal homepage: www.elsevier.com/locate/ecolind
Geographical information systems based ecological risk analysis of metal
accumulation in sediments of İkizcetepeler Dam Lake (Turkey)
☆
Şakir Fural
a,⁎, Serkan Kükrer
b, İsa Cürebal
ca Kırşehir Ahi Evran University, Faculty of Arts and Sciences, Department of Geography, Turkey b Ardahan University, Faculty of Humanities and Literature, Department of Geography, Turkey c Balıkesir University, Faculty of Arts and Sciences, Department of Geography, Turkey
A R T I C L E I N F O Keywords: Metal pollution Environmental degradation Aquatic ecosystems Pollution dynamics Ecological risk A B S T R A C T
This study analyzed the spatial distribution, potential ecological risks and possible sources of metal con-centrations, organic carbon, chlorophyll degradation products and CaCO3 content from surface sediment sam-ples in İkizcetepeler Dam Lake using ecological-toxicological indices, multivariate statistical analysis, and geographical information systems (GIS) software. One core sample and 32 surface sediments were taken from the Dam Lake, while seven lithologic samples were taken from various points in the basin. To identify anthropogenic influences in the Dam Lake from the before dam was constructed period to the present day, the enrichment factor (EF), contamination factor (CF), geoaccumulation index (Igeo), toxic risk index (TRI) and pollution load index (PLI) indices were calculated based on lithologic background values. Modified ecological risk (mER) and modified potential ecological risk (mPER) were calculated separately according to core sample and lithologic background values. Therefore, ecological risk during Anthropocene was determined using core sample values. Results pointed to significant enrichment of Ni (6.93), moderate enrichment of As (3.88), Cr (2.86), Mn (2.54), Hg (2.34), and Cd (2.04) and low level enrichment of Pb (1.20), Cu (1.15), Zn (1.08), and Fe (0.80). Ecological risk was listed as Hg (94) > Cd (61) > As (38) > Ni (35) > Cu (5.98) > Cr (5.72) > Pb (5.68) > Zn (1.07) according to lithologic background values and as Hg (59) > Cd (29) > As (9) > Ni (8) > Cu (7) > Pb (5) > Cr (2.97) > Zn (1.42) according to core background values. A significant level of ecological risk was determined for Hg (94), medium level ecological risk for Cd (61), and close to moderate level ecological risk for As (38) and Ni (35). The risk was low for all the other metals. According to the core sample background values, ecological risk was at the lowest limit of the most significant level for Hg (81), moderate for Cd (50) and low for other metals. Overall, this indicates a low (123) and moderate (201) potential ecological risk in İkizcetepeler Dam Lake based on core and lithologic background values, respectively.
1. Introduction
Metals are natural components of the earth's crust and important elements in the metabolism of biota (e.g., Cu, Zn and Fe). However, some metals create ecological risks due to their domestic use and in-dustrial production (Uwah et al., 2013; Tagliaferro, et al., 2018) Eco-logical risk analysis is one of the best methods to detect the potential issue of metal pollution and its impacts on ecosystem, in particular on wetlands. Ecological risk analyses can be easily incorporated in deci-sion-making processes for detecting environmental issues and mana-ging ecosystem health. The transportation of metals to aquatic ecosys-tems may occur from either natural factors such as lithologic structure
or anthropogenic disturbances. One of the most important goal when conducting ecological risk studies in lake sediments is to distinguish the natural and anthropogenic sources of metals and to determine the ex-tent of the ecological risk.
Ecological risk indices provide robust and reliable result such as enrichment factor (EF), contamination factor (CF), ecological risk factor (mER), geoaccumulation index (Igeo), potential ecological risk (mPER), and pollution load index (PLI). EF, CF, and Igeo test the presence of anthropogenic effects, while the toxic effects and risk assessment of metals are determined with the TRI, mER, mPER, and PLI. Recent studies have drawn attention to the danger of metal pollution in lakes (Eid et al., 2012; Tao et al., 2012; Kükrer et al., 2015), dams (Loska and
https://doi.org/10.1016/j.ecolind.2020.106784
Received 8 May 2020; Received in revised form 24 July 2020; Accepted 29 July 2020
☆This study was extracted from part of Şakir Fural’s PhD thesis entitled “Ecological Risk Analysis of İkizcetepeler Dam Lake Sediments (Balıkesir – Turkey)” completed at Department of Geography in Graduate School of Balıkesir University.
⁎Corresponding author.
E-mail address: [email protected] (Ş. Fural).
Available online 13 August 2020
1470-160X/ © 2020 Elsevier Ltd. All rights reserved.
Wiechuła, 2003; Peraza et al., 2015; Kükrer and Mutlu, 2019), bays, lagoon and gulfs (Karakaya, 2011; Kükrer et al., 2020; Pehlivan, 2017; Cunningham, et al., 2019), streams (Brekhovskikh et al., 2002; Wang et al., 2018; Yao et al., 2019; Ustaoğlu and Tepe, 2019; Ustaoğlu et al., 2020; Ustaoğlu and Islam, 2020) river deltas (Engin, 2012; Zhang et al., 2016; Jorfi et al., 2017) and national parks (Sawicka and Rakowska, 1993; Yang et al., 2014). Since metals are not degraded by microbial and chemical processes, they cannot be purified in many treatment systems available with today's technology. This causes concern that anthropogenic metals may accumulate in the living cells of natural environments and pose a threat to the ecosystem health (Eid et al., 2012). Considering their severe toxic effects on the public and en-vironmental health, the serious public scrutiny and concerns about ecological risks are justified (Tsakovski, et al., 2012).
According to the Ramsar report of Global Wetland Outlook 2018, 87% of wetlands in the world have disappeared in the last 300 years due to anthropogenic effects, while 35% disappeared between 1970 and 2018. As of 2007, while approximately one fifth of the world popula-tion (1.2 billion people) has no access to clean water, this ratio is ex-pected to increase to 2/3 by 2025 (FAO, 2007). İkizcetepeler Dam Lake meets the drinking water, agricultural irrigation water and recreational fishing needs of the Balıkesir city centre, which had a population of 338.936 in 2018. Any ecological risk that may arise in the Dam Lake will directly affect people via the water network and in addition to causing health problems it will cause significant economic losses in agricultural irrigation and fishing (Ustaoğlu et al., 2020).
This study aimed to analyze the spatial distribution, potential eco-logical risks and possible sources of metals content in İkizcetepeler Dam Lake sediments using various ecological indices, multivariate statistical analyses, and geographic information systems software (GIS).
1.1. Materials and method 1.1.1. Study area
İkizcetepeler Dam Lake is located within the province borders of Balıkesir province in the south part of Marmara region (Fig. 1).
Constructed in 1991 to meet the drinking and utility water needs of the city, the dam covers an area of 7.92 km2 at normal water level. The 478.9 km2 dam basin consists of four sub-basins: Kille stream, Koca stream, Çınarlı stream (Taşköy stream) and Bağırsak stream.
1.1.2. Collection of sediment and rock samples
Sediment samples were taken from 32 locations whose coordinates were predetermined in a field study conducted at the Dam Lake in 2018 (Fig. 1). While determining the sampling points, the dam area was di-vided into 32 equal parcels, each covering an area of 0.25 km2, so that each sampling point represented an area with the same measurement. The core sampling point was determined according to the sedimentary quality of the grab samples during the field study, while a core sample was taken from sampling point 18. Surface sediment samples were taken using a Van Veen Grab Sampler, and the core sample was taken with a Kajak Sediment Core Sampler. Rock samples were taken from seven points in the basin around the lake to determine lithologic background values. The two different background values from the rock and core samples were obtained (Table 2).
Fig. 1. Map of study area and sampling locations. Table 1
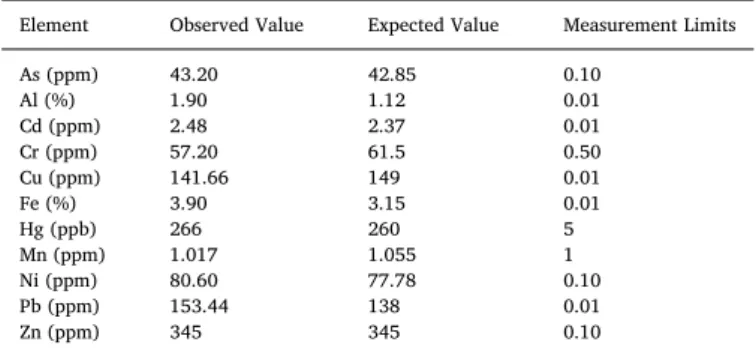
Quality control results of ICP MS measurements using standard reference sample.
Element Observed Value Expected Value Measurement Limits
As (ppm) 43.20 42.85 0.10 Al (%) 1.90 1.12 0.01 Cd (ppm) 2.48 2.37 0.01 Cr (ppm) 57.20 61.5 0.50 Cu (ppm) 141.66 149 0.01 Fe (%) 3.90 3.15 0.01 Hg (ppb) 266 260 5 Mn (ppm) 1.017 1.055 1 Ni (ppm) 80.60 77.78 0.10 Pb (ppm) 153.44 138 0.01 Zn (ppm) 345 345 0.10
1.1.3. Analytical procedures
Surface sediment and core samples, divided into 5 cm slices, were placed in petri dishes, dried at 60 °C for 24 h and crushed in a mortar as powder. OC analyses were performed using the Walkley Black Titration Method (Gaudette et al., 1974), and CaCO3 analyses were performed using a Scheibler Calcimeter (Schlichting and Blume, 1966). Metal analyses were conducted using an ICP-MS device in Bureau Veritas Analytical Labs, Canada. Reference material, duplicate measurements and blind sample measurements were performed to test the validity and reliability of the metal analyses (Table 1). Analysis of CDP was carried out by applying the acetone extraction method to wet sediment sam-ples, followed by the spectrophotometric method (Lorenzen, 1971). EF, CF and Igeo were used to detect metal deposits of anthropogenic origin. The EF was calculated this formula:
= EF Cn sample CAl sample Bn Background B Al Backgrond /
where Cn is as before; CAl is the aluminum concentration, Bn back-ground metal, BAl is background Al. The obtained results were eval-uated as follows: EF < 2 deficiency to minimal enrichment, EF = 2–5 moderate enrichment, EF = 5–20 significant enrichment, EF = 20–40 very high enrichment and EF > 40 extremely high enrichment (Sutherland, 2000).
CF was calculated this formula:
=
CF Metal concentration
Metal background value
The obtained results were evaluated as follows: CF < 1 low con-tamination, 1 ≤ CF < 3 moderate concon-tamination, 3 ≤ CF < 6 high contamination, and CF > 6 very high contamination (Hakanson, 1980).
Igeo is an ecological risk index that evaluates the level of pollution caused by metals and whether the source is based on natural or an-thropogenic effects. Igeo calculations were performed according to the Müller Method (Müller, 1969). Thus:
= Igeo Cm Bm log ( 1.5) 2
where Cm is corresponds to the amount of metal measured; and Bm is corresponds to the continental crust value of the metal. The data ob-tained were evaluated as follows: Igeo ≤ 0 uncontaminated, 0 < Igeo < 1 uncontaminated to moderately contaminated, 1 < Igeo < 2 moderately contaminated, 2 < Igeo < 3 moderately contaminated to strongly contaminated, 3 < Igeo < 4 strongly con-taminated, 4 < Igeo < 5 strongly contaminated to extremely con-taminated, Igeo ≥ 5 extremely contaminated (Müller, 1969).
PLI was used to calculate the quality of the sediments based on their metal values (Tomlinson et al., 1980) as follows:
PLI = (CF1 × CF2 × ….…...CFn)1/n
CF represents the contamination factor and n represents the number of elements used. The normal PLI value in the sediment was determined to be 0, and this value indicates that there is no pollution, but the risk of pollution will rise if the value of 1 is exceeded (Suresh et al., 2011).
TRI was used to determine the toxic effects of metals. In the for-mula, TRI is the toxic risk index of a single metal, Ci shows the metal concentration in the sediment sample, and n is the number of metals
(Zhang et al., 2016). TEL is the threshold effect level, and PEL is the probable effect level (Macdonald et al., 1997).
= +
TRI ( /C TEL) ( /C PEL) )
2
i i i
2 2
The sum of the individual TRIi values for the metals yields the in-tegrated TRI thus:
= = = TRI TRI i n i 1
TRI data were evaluated as follows: TRI ≤ 5 no toxic risk, 5 < TRI ≤ 10 low toxic risk, 10 < TRI ≤ 15 moderate toxic risk, 15 < TRI ≤ 20 considerable toxic risk, and TRI > 20 very high toxic risk.
The mPER index was used to determine the ecological risk level of the metals. In this context, individual mER and integrated modified ecological risk analysis (mPER) were performed for each metal. CF is generally used in ecological risk and potential ecological risk calcula-tions (Hakanson, 1980). However, since there is no geochemical nor-malization with Al or Fe in CF calculations, errors from grain size are not minimized. Therefore, mER using EF in ecological risk calculations was developed (Brady et al., 2015).
mER was calculated thus:
mER = EF × Tri
In this formula, EF is the enrichment factor and Tri is the toxic risk coefficient of the metal. The results were evaluated as follows: mEr < 40 low potential ecological risk, 40 ≤ mEr < 80 moderate potential ecological risk, 80 ≤ mEr < 160 significant potential eco-logical risk, 160 ≤ mEr < 320 high potential ecoeco-logical risk, and mEr ≥ 320 very high potential ecological risk (Hakanson, 1980).
In the study, mPER was calculated using the following formula:
mPER = ∑ mER
mPER is the sum of the mER values of metals. The results were evaluated as follows: mPER < 150 low ecological risk, 150 ≤ mPER < 300 moderate ecological risk, 300 ≤ mPER < 600 significant ecological risk, mPER ≥ 600 very high ecological risk (Hakanson, 1980).
2. Results and discussion
2.1. Spatial distribution of metals in Dam Lake base
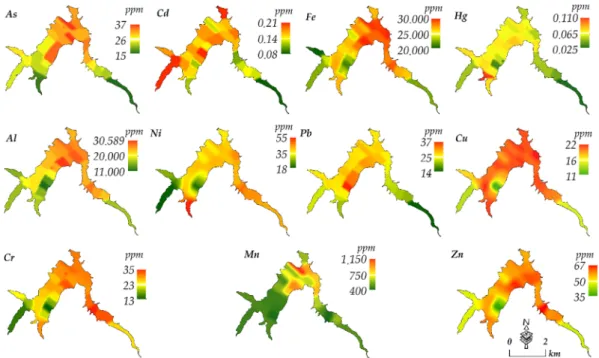
Metal concentration in the İkizcetepeler Dam Lake base changes under the influence of streams. Depending on natural and anthro-pogenic effects in their basins, streams discharge different types and concentrations of metals into the dam (Fig. 2). Aluminum was detected in maximum concentration (30.000 ppm) at the sampling points in the Kille stream estuary and the middle part of the dam and in minimum concentration (11.000 ppm) in the estuaries of other streams. Arsenic was detected at maximum level (37 ppm) at the sampling points in the middle part of the dam, and at minimum level (15 ppm) in the estuaries of Kille stream and Bağırsak stream. Copper was found to peak at (22 ppm) in the inner parts and estuaries of Kille stream and Bağırsak stream and to plunge to 10 ppm level in the estuaries of Koca stream and Çınarlı stream (Taşköy stream). Mercury reached its maximum of
Table 2
Background (B.) values (ppm) of metals obtained from rocks and core sample slices.
Metal Cu Pb Zn Ni Mn Fe As Cd Cr Al Hg
Lithologic B. 10.42 25.52 30.00 4.36 158.43 22.557 6.16 0.06 5.81 9.771 0.02
0.110 ppm in the estuary of Bağırsak stream and its minimum of 0.025 ppm in the estuaries of Kille stream and Koca stream and also in the estuary of Çınarlı stream (0.055 ppm). Zinc was found to peak at 67 ppm in the estuaries of Kille stream and Bağırsak stream. It was in the range of 48–63 ppm in the estuaries of Koca stream and Çınarlı stream and also in inner areas. Iron was found to vary between 26.000 and 30.000 ppm in the estuaries of Kille stream and Bağırsak between 20.000 and 22.000 ppm in the estuaries of Kille stream and Bağırsak stream, and between 24.000 and 30.000 ppm in the inner areas (Fig. 2). Cadmium peaked at 0.21 ppm in the estuaries of Koca stream and Çı-narlı stream while it was at minimum level (0.008 ppm) in the estuaries of Kille stream and Bağırsak stream. Maximum and minimum Cr was 35 ppm in the estuaries of Kille stream and Bağırsak stream and 12 ppm in the estuary of Koca stream respectively.
Around the sampling point 19, with a water resource, Pb reached its maximum of 37 ppm and its minimum of 14 ppm in the estuaries of Koca stream, Kille stream and Bağırsak stream. Manganese plummeted to 400 ppm in the estuaries of all streams and throughout the inner parts of picked at 1.140 ppm in the estuary of Kireçli stream. The minimum and maximum Ni was estimated at 17 ppm in the estuaries of Koca stream and Çınarlı stream and at 55 ppm in the estuary of Bağırsak stream respectively. Metal concentrations of some wetlands including this study are compared in Table 3.
2.2. Spatial distribution of organic carbon (OC), chlorophyll degradation
products (CDP) and calcium carbonate (CaCO3) in the Dam Lake base
Marine and freshwater ecosystems accommodate 20% of the global TOC pool (Siegenthaler and Sarmiento, 1993). While OC concentration at natural levels is not harmful to the ecosystem, anthropogenic inputs from domestic and industrial usage causes organic matter pollution (Xu, et al., 2019). Organic materials play an important role in the trans-portation of metals (Tomlinson et al., 1980; Yang et al., 2014). There-fore, it is important to determine the spatial distribution of OC in order to understand the metal transport processes. OC concentration in İkiz-cetepeler Dam Lake generally increases in the estuaries of streams. OC was detected at a maximum level (3%) at the sampling points in the estuaries of Koca stream, Kille stream and Çınarlı stream and at a minimum level (0.5%) in the estuary of Bağırsak stream and throughout its inner parts (Fig. 3a). According to various other lakes in the current
literature, the OC concentration in the İkizcetepeler Dam Lake is at normal levels (Table 4). CDP provides information about the vegetal production processes in the Dam Lake (Cabrita et al., 2018). CDP ranged from 150 µg/g in the estuary of Kille stream 50–75 µg/g in the estuary of Çınarlı stream and Koca stream and to 0.25 µg/g in the es-tuary of Bağırsak stream (Fig. 3b). These values demonstrate that the CDP was discharged into the dam by streams other than Bağırsak stream and disperse to the inner parts (Fig. 3b). CaCO3 is an important indicator in determining the transportation processes of metals (Shetye et al., 2009). CaCO3 concentration was around 12% in the estuary of Çınarlı stream, in the range of 6–8% in the estuaries of Kille stream and Koca stream, and at its minimum 2% in the estuary of Bağırsak stream. According to spatial analysis, CaCO3 was discharged by Çınarlı stream, Koca stream, and Kille stream (Fig. 3c).
2.3. Spatial distribution of enrichment factor (EF) in Dam Lake base
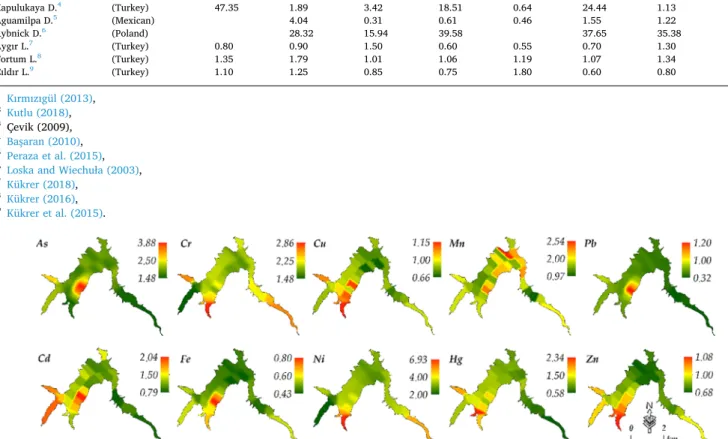
Based on the lithologic background values, EF was of the following order: Ni > As > Cr > Mn > Hg > Cd > Pb > Cu > Zn > Fe. In the İkizcetepeler Dam Lake, enrichment was detected as significant for Ni, as moderate for As, Cr, Mn, Hg and Cd and as low for Pb, Cu, Zn and Fe. According to field studies and spatial analysis of the lake basin, the likely source of Ni enrichment is a mining quarry located on the border between Koca stream and Bağırsak stream. The main anthro-pogenic sources of moderately enriched As around the sampling point 19 were chemical fertilizers, geothermal sources and fossil fuel use (Atabey, 2009). There are large agricultural areas near the sampling point 19 and a water source exists at the dam base. In this case, the probable source of As is agricultural activity and lithologic formations through which the water source passes. Chromium is moderately en-riched in all estuaries except Koca stream. Chromium is thought to be generated from agriculture in the basin, domestic wastes and factories working with metallic raw materials in Çınarlı stream basin. Vehicle fuels, accumulators, batteries and paint are the most important Pb sources. Bullet is carried into water ecosystems by atmospheric events and streams (Dündar and Arslan, 2005). However, Pb enrichment at the bottom of the dam reached its highest value at the sampling point 19, which enables discharge into the water source according to the 1:25.000 scale J19b2 topography map prepared in 1980. Mercury is moderately enriched in the estuary of Bağırsak stream. The main
anthropogenic sources of Hg are fossil fuels, industrial wastes, cement and metal factories. Mercury enters aquatic ecosystems from atmo-spheric events and streams. The moderate level of Hg enrichment in the dam occurs in a rather local area. During field trips to identify the Hg source, rock samples were taken from the area and the source was determined to be of lithologic origin. Cadmium was moderately en-riched in the estuaries of Koca stream and Çınarlı stream and at the sampling points 17, 18, 19 and 20. The main reason for this is intensive agricultural activity at the mentioned points because Cd is the raw material of phosphate fertilizers (Bolat and Kara, 2017). Table 5 shows the enrichment factors of some wetlands in the current literature. The spatial distribution of the enrichment factor at the base of the dam is given in Fig. 4.
Table 3
Minimum and maximum metal concentrations of some Dam Lake in the literature (ppm).
LKS Al As Cd Cr Cu Fe Hg Mn Ni Pb Zn
İkizcetepeler Dam Lake (This study) 10.170 16.6 0.09 12.80 10.60 20.000 25.00 402 16.50 14.68 33.45 20.520 32.9 0.19 30.00 22.20 30.020 108.00 1.159 54.70 36.56 65.65
Avşar Dam Lake1 (Turkey) 0.34 9.40 18.20 19.680 19.80 0.64
1.23 19.90 38.40 28.500 39.40 6.35
Seyhan Dam Lake2 (Turkey) 1.55 84.90 12.40 30.640 595 32.80
2.44 135.50 23.80 43.204 904 43.30
Kapulukaya Dam Lake3 (Turkey) 9.10 0.50 98.10 9.80 1.01 326.6 24.70 8.60 14.80
69.70 1.80 1.116 29.30 1.60 1.053 127.15 34.14 124.24
Karacaören I Dam Lake4 (Turkey) 1.949 13.50 7.80 7.217 308.20 97.55 1.69 13.95
5.847 0.93 64.50 81.55 15.584 634.90 187.20 301.14 59.11
Yamula Dam Lake5 (Turkey) 3.70 2.60 4.75 45.80 3.77 4.73 6.73
4.80 19.80 12.50 341.30 42.67 12.15 33.97
Umurbey Dam Lake6(Turkey) 0.001 0.023 2.060 0.331 0.006 0.162
0.006 0.095 9.404 0.953 0.052 2.778
Çatören Dam Lake7 3.500 0.001 30.10 18.50 1.950 112 7.50 12.50 19.23
13.000 0.01 0.70 140.7 42.20 12.500 425 38.25 26.83 42.41
(Turkey) Asartepe Dam Lake8 (Turkey) 0.76 0.58 10.63 269.90 3.34 17.73 44.25
1.33 1.63 18.70 708.80 5.96 21.90 60.37
Rybnick Dam Lake9 (Poland) 20.48 122.37 51.87
51.07 671.7 117.80
Klingenberg Dam Lake10 10.6 2.48 1.73 5.62 1.71 3.54 6.32 2.63 88.6
13.6 167 3.07 15.10 23.02 5.09 112.20 22.60 3.281
(Germany) Aguamilpa Dam Lake11 (Mexican) 7.760 0.22 0.79 4.740 0.24 14.8
27.600 0.27 18.3 60.8 15.900 0.04 189 13.6 51.8 1Özözen (2005), 2Çevik et al. (2009), 3Başaran (2010), 4Erdoğan (2014), 5Kar (2011), 6Selvi (2012), 7Çiftçi (2015), 8Tunç (2015), 9Loska et al. (1997), 10 Hahn et al. (2018), 11 Peraza et al. (2015).
Fig. 3. a: Spatial distribution of organic carbon amount on the dam base, 3b: Spatial distribution of chlorophyll decomposition products, 3c: Spatial distribution of
CaCO3 based on kriging interpolation (without scale).
Table 4
Organic carbon concentrations identified in some studies in the literature.
Lake OC (%) References
İkizcetepeler Dam 0.11–3.03 Fural et al. (2019) Çıldır Lake (Turkey) 0.15–2.50 Kükrer et al. (2015) Aygır Lake (Turkey) 0.34–13.90 Kükrer (2018) Aktaş Lake (Turkey) 0.13–9.80 Kükrer (2017) Tortum Lake (Turkey) 0.0–0.50 Kükrer (2016) Uzunçayır Dam (Turkey) 4.20–8.30 Kutlu (2018) Sarbsko Dam (Poland) 0.30–18.50 Woszczyk et al. (2011) Caohai Lake (China) 8–25 Jiang et al. (2018) Wujiangdu Lake (China) 20–42 Jiang et al. (2018) Honfong Lake (China) 15–24 Jiang et al. (2018) Biwa Lake (Japan) 10–20 Ishiwatari et al. (2009)
2.4. Spatial distribution of contamination factor (CF) in Dam Lake base
The CF may be sequenced thus: Ni > Cr > As > Mn > Cd > Hg > Al > Cu > Zn > Fe > Pb according to the lithologic background values. Contamination was detected at a moderate level for
Cu, Fe, Pb and Zn, at a high level for Cr, As, Hg, Cd and Al and at a very high level Mn and Ni. Possible sources of Ni, As, Cr, Mn, Hg, Cd and Pb were accounted for by EF. The CF determined that Cu, Fe, Zn and Al were also affected by anthropogenic activities. Al, Cu, Fe and Zn con-stitute the raw materials of fertilizers used in plant nutrition (Bolat and
Table 5
Comparison of enrichment factor (EF) of some dams (D) and lakes (L) in the current literature.
Location As Cd Cr Cu Hg Ni Pb Zn
İkizcetepeler D. (This Study) 3.88 2.04 2.86 1.15 2.34 6.93 0.48 1.08
Gökçekaya D.1 (Turkey) 46.13 0.25 7.58 6.54 5.77 23.59 13.09 Uzunçayır D.2 (Turkey) 1.61 1.61 0.97 0.07 5.27 0.83 0.97 Seyhan D.3 (Turkey) 8.55 1.91 0.41 0.55 Kapulukaya D.4 (Turkey) 47.35 1.89 3.42 18.51 0.64 24.44 1.13 7.03 Aguamilpa D.5 (Mexican) 4.04 0.31 0.61 0.46 1.55 1.22 1.11 Rybnick D.6 (Poland) 28.32 15.94 39.58 37.65 35.38 64.11 Aygır L.7 (Turkey) 0.80 0.90 1.50 0.60 0.55 0.70 1.30 2.70 Tortum L.8 (Turkey) 1.35 1.79 1.01 1.06 1.19 1.07 1.34 1.04 Çıldır L.9 (Turkey) 1.10 1.25 0.85 0.75 1.80 0.60 0.80 0.75 1Kırmızıgül (2013), 2Kutlu (2018), 3Çevik (2009), 4Başaran (2010), 5Peraza et al. (2015), 6Loska and Wiechuła (2003), 7Kükrer (2018),
8Kükrer (2016), 9Kükrer et al. (2015).
Fig. 4. Spatial distribution of enrichment factor in dam base according to lithologic background values and kriging interpolation. Table 6
Comparison of contamination factor (CF) and PLI in dams and lakes worldwide and in Turkey in the current literature.
Location Al As Cd Cr Cu Fe Hg Mn Ni Pb Zn PLI
İkizcetepeler D. (This study) 2.32 4.65 2.77 4.73 1.92 1.18 2.61 3.85 8.83 1.04 1.85 1.44
Uzun Çayır D.1 (Turkey) 5.04 1.09 1.08 0.65 0.67 0.04 0.74 3.49 0.56 0.66 0.62
Aguamilpa D.2 (Mexican) 0.41 1.61 0.14 0.29 0.44 0.15 1.11 0.78 0.45 0.41 0.41
Tailing D.3 (Ghana) 0.90 23.70 0.04 0.20 0.10 0.04 0.11
Weija D.4 (Ghana) 0.22 6.55 0.02 0.09 6.18
Asartepe D.5 (Turkey) 4.37 2.14 2.92 3.99 2.96 3.32
Nasser Lake6 (Egypt) 0.58 0.32 0.54 0.26 0.29 0.41 0.54 0.37
Tortum Lake7 (Turkey) 0.81 1.03 1.22 0.82 0.77 0.84 0.89 0.86 0.82 0.99 0.82 0.15
Çıldır Lake8 (Turkey) 1.60 1.50 1.60 1.10 1.00 1.00 2.90 1.10 0.90 1.20 1.10 1.90
Beyşehir Lake9 (Turkey) 1.28 3.66 2.28 2.15 1.94 2.27 5.25 2.11
1Kutlu (2018), 2Peraza et al. (2015), 3Sey and Belford (2019), 4Raphael et al. (2016), 5Tunç (2015), 6Goher et al. (2014),, 7Kükrer (2016), 8Kükrer et al. (2015), 9Tunca (2016).
Kara, 2017). Agricultural activities carried out in the Dam Lake basin are considered as an anthropogenic activity that increases the con-tamination factor of the mentioned metals. The concon-tamination factor of some wetlands is shown in Table 6. The spatial distribution of the contamination factor on the Dam Lake floor is shown in Fig. 5.
2.5. Geoaccumulation index (Igeo)
According to lithologic background values, Igeo showed the des-cending level of pollution thus: Ni > Cr > As > Mn > Cd
> Hg > Cu > Zn > Fe > Pb. The Dam Lake; was not con-taminated with Fe and Pb, concon-taminated with Al, Cd, Cu, Hg and Zn, at low levels contaminated with As and Cr and moderately at the lower limits and contaminated with Ni moderately (see Fig. 6).
2.6. Spatial distribution of pollution load index (PLI) and toxic risk index (TRI) in the Dam Lake base
PLI ranged from 0 to 13. The estuaries of Bağırsak stream and Çınarlı stream (Taşköy stream) and sampling points 18, 19 and 20 were
Fig. 5. Spatial distribution of contamination factor in dam base according to lithologic background values and kriging interpolation.
identified as areas at a risk of pollution (Fig. 8a). Their common feature of these is the existence of large agricultural areas near the sampling points. Table 6 presents the PLI values of the study area and related literature. TRI varies between 4.00 and 6.60. No toxic risk was detected at sampling points 1 and 2 in the estuary of Koca stream, at the sam-pling points 19 and 20 near the water source, and samsam-pling points 31 and 32 in the estuary of Kille stream. A low toxic risk was detected at the other points (Fig. 8c).
2.7. Spatial and vertical distribution of ecological risk index (mER) and potential ecological risk index (mPER) in the Dam Lake base
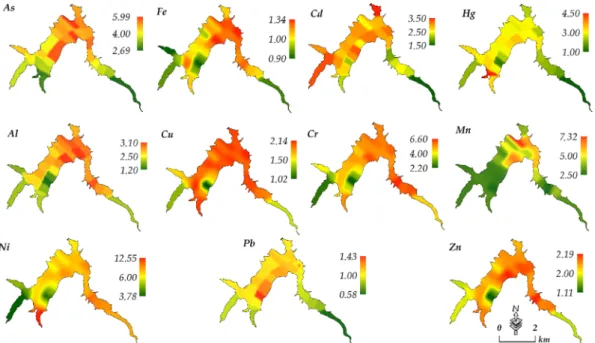
mER and mPER were calculated separately based on the lithologic background values obtained from rock samples and background values obtained from core sample data. In addition, the vertical distribution of mPER in the core sample was calculated according to the core sample and lithologic background data; by which means the temporal change was examined. The ecological risk at İkizcetepeler Dam was of the descending order: Hg > Cd > As > Ni > Cu > Cr > Pb > Zn according to lithologic background values and Hg > Cd > As > Ni > Cu > Pb > Cr > Zn in accordance with core sample background values. As shown by lithologic background values, the ecological risk level was identified as significant for Hg, as moderate level for Cd, as very close to moderate for As and Ni, and as low for the other metals (Fig. 7). From the obtained core sample background values, the eco-logical risk level was identified for Hg at the lowest segment of sig-nificant level, as moderate Cd, and as low for other metals.
mPER varies between 50 and 123 according to the core sample background values and between 98 and 201 according to the lithologic background values. The core sample background values indicate that a low ecological risk was detected in the Dam Lake. According to the lithologic background values, a low level ecological risk was found in the estuaries of Kille stream and Çınarlı stream and around sampling point 19; potential ecological risk was identified at other points.
Temporal change of mPER varied between 102 and 123 as per the core sample background values and between 131 and 156 according to li-thologic background values. When the temporal change of potential ecological risk was analyzed, a downward trend was observed (Fig. 9). The mER of some wetlands is shown in Table 7.
Fig. 7. Spatial distribution of ecological risk (mER) in the dam base according to lithologic background values.
Fig. 8. a: Distribution of pollution load index (PLI) in dam base, 8b: Distribution of potential ecological risk (mPER), 8c: Distribution of toxic ecological risk (TRI)
(According to lithologic background values) (without scale).
Fig. 9. Vertical distribution of potential ecological risk (mPER) according to
2.8. Multivariate statistical analysis
Pearson’s correlation matrix analysis was carried out to identify possible sources of metals and their transport processes as strong po-sitive correlations were detected between some metals. This shows that the sources and transportation processes of these metals are similar (Wang et al., 2018). Organic materials play an active role in the transportation of metals, so correlations between organic materials and metals should be examined (Zhang et al., 2016). A positive correlation was found between OC and Zn and Al and CaCO3. Spatial distribution maps show that the areas where these metals and the OC input are found at their highest amounts are the sampling points corresponding to the estuary of Kille stream (Fig. 2). CDP exhibited a positive corre-lation with Cu, Zn, Fe, Cr, Al, and CaCO3. This indicates that CDP and the metals mentioned are carried from terrestrial sources by the Ba-ğırsak stream (Fig. 2).
Another important indicator in determining the transportation processes of metals is the amount of CaCO3 (Shetye et al., 2009). CaCO3 showed a positive correlation with Cu, Zn, Cr, Al, OC and CDP. These metals were discharged together with CaCO3 from terrestrial sources by Çınarlı stream and Bağırsak stream (Fig. 2). According to the correla-tion analysis data of the metals, it was determined that Cu showed positive correlations with Zn, Ni, Mn, Fe, Cr, Al, Hg, CDP and CaCO3. Positive correlations were found between Pb and Ni, As, Cd, Hg; be-tween Zn and Ni, Mn, Fe, Cr, Al, Hg, OC, CDP and CaCO3; between Ni and Mn, Fe, Cr, Al; between Mn and Fe, As, Cr, Al; between Fe and As, Cr, Al, Hg, CDP; between As and Cd, Al; between Cd and Hg; between
Cr and Al, CDP, CaCO3 and between Al and OC, CDP, CaCO3 (Table 8). According to the analysis, most of the metals show positive correlation with each other. However, Pb, As and Cd had very little association with other metals. This shows that the source and transportation pro-cesses of these metals are different (see Table 9).
Bullet and As reached their highest enrichment around the sampling point 19. The 1/25.000 scale topography map of the area, prepared before the dam was built, points to a water source at the specified lo-cation. According to correlation analysis and spatial distribution maps, Pb and As discharges arise from the mentioned source. One of the most
Table 7
Comparison of ecological risk index (mER) and potential ecological risk index (mPER) of some dams (D) and lakes (L).
Location As Cd Cr Cu Hg Ni Pb Zn PER
İkizcetepeler D. (This study) 38 61 5.72 5.98 94 35 5.68 1.07 201
Uzun Çayır D.1 (Turkey) 50.44 32.85 2.15 3.26 1.92 17.77 2.82 0.65 111
D. Duze D.2 (Poland) 96.14 2532 2.55 13.01 12.46 45.65 25.55 2727 Tailings D.3 (Ghana) 9.65 711 0.10 1.20 0.50 0.04 722 T. Georges D.4 (China) 64 1.69 10.45 64 2.41 2.72 2.15 147 Hubei L.5 (China) 16.90 97.11 2.50 8.60 78 2.67 7.15 1.95 215 Dali L.5 (China) 35 96 30 30 35 10 236 Aygır L.6 (Turkey) 12 40 5 5 26 6 8 5 107 Tortum L.7 (Turkey) 14 40 2 6 50 5 6 2 125 Çıldır L.8 (Turkey) 15 50 6 7 110 10 9 6 213 1Kutlu (2018),
2Tytła and Kostecki (2019), 3Sey and Belford (2019), 4Liu et al. (2015), 5Xu, et al. (2019), 6Kükrer (2018), 7Kükrer (2016), 8Kükrer et al. (2015). Table 8
Pearson correlation coefficients between variables. (Bold values indicate high correlations).
Cu Pb Zn Ni Mn Fe As Cd Cr Al Hg OC CDP CaCO3 Cu Pb −0.1297 Zn 0.8973 −0.2026 Ni 0.7720 −0.3659 0.7596 Mn 0.4545 0.1254 0.4950 0.3725 Fe 0.7695 0.0533 0.8432 0.6942 0.7190 As 0.2272 0.6680 0.1357 −0.1103 0.5521 0.3737 Cd 0.2402 0.6021 0.1360 −0.2758 0.1277 0.1426 0.5394 Cr 0.8663 −0.3242 0.8666 0.8991 0.5148 0.7569 0.1367 −0.0867 Al 0.7930 −0.0367 0.8771 0.6180 0.6604 0.8722 0.4310 0.2124 0.8361 Hg 0.6002 0.3906 0.4742 0.2443 0.2302 0.3681 0.2628 0.5731 0.2638 0.2959 OC 0.1889 −0.2541 0.3773 0.1164 0.1776 0.1930 0.0449 0.0341 0.3277 0.4361 0.0113 CDP 0.4915 −0.0297 0.4342 0.2155 0.2080 0.4303 0.3577 0.2265 0.4466 0.5655 0.1301 0.2814 CaCO3 0.4491 −0.3010 0.3651 0.2017 0.0024 0.0939 0.1622 0.0970 0.4384 0.4109 0.0884 0.5078 0.6149 Table 9
Factor analysis. (Bold values indicate a high relationship between variables). Factor 1 Factor 2 Factor 3 Factor 4 Cu 0.853928 −0.0303204 0.194867 0.397755 Pb −0.224637 0.80313 −0.274914 0.195405 Zn 0.896884 −0.0805418 0.190827 0.261009 Ni 0.857477 −0.428104 −0.0647929 0.0372676 Mn 0.688694 0.505175 −0.058413 −0.141827 Fe 0.936917 0.241223 0.0116765 0.0487253 As 0.242775 0.893156 0.171107 0.00462371 Cd −0.0968883 0.603125 0.171858 0.622958 Cr 0.912819 −0.151059 0.285135 −0.0326642 Al 0.853956 0.276288 0.333895 0.00313544 Hg 0.2859 0.0675688 −0.137454 0.87211 OC 0.0568623 0.0303492 0.764316 −0.00113031 CDP 0.361289 0.110749 0.658135 −0.163667 CaCO3 0.0639325 −0.111539 0.894221 0.0746469
important sources of As and Pb is other volcanic rocks and carbonated rocks, especially pyrite (Atabey, 2009). Limestone and andesite for-mations are located near the sampling point 19. In this case, the pos-sible source of Pb and As discharge to the dam related to the lithogenic factors. Cd was discharged by streams from Koca stream and Çınarlı stream basin.
Four components were calculated for PCA analysis. These compo-nents explained 83.41% of the total change. The first factor is re-sponsible for 42.92% of the change and consisted of Cu, Zn, Ni, Mn, Fe, Cr, and Al. These metals, which were found to act together in the correlation analysis and spatial distribution maps (Fig. 2), are of ter-restrial origin. The second factor elucidated 18.43% of the changes and consisted of Pb and As. These are also determined to have similar sources in the correlation analysis and spatial distribution maps and are discharged by the water source at the bottom of the dam, possibly of lithogenic origin. Component 3, which included OC, CDP, and CaCO3, accounted for 13.49% of the total change. Cadmium and Hg in factor 4 were discharged from a different source than the other inputs. When the spatial distribution maps were examined, Cd was found to be dis-charged from Koca stream and Çınarlı stream basins, where intensive agriculture is carried out. Hg discharge is of lithologic origin, which is evidenced by rock samples taken from the region. The average Hg concentration was 0.024 ppm in the rock samples taken from seven different points in the basin. However, Hg concentration was de-termined as 0.101 ppm in the 4th lithologic sample taken from sam-pling point 21 where Hg creates a significant ecological risk. This value indicates that the lithologic-origin Hg concentration in the area was 4 times the average. Hg concentration was 0.011 ppm on average in the 6 samples outside the 4th lithologic sampling point. In this case, the Hg concentration detected at the 4th lithologic sampling point was 10 times the other points.
According to the cluster analysis data, Cu, Fe, Zn, Al, Ni, Cr, and Mn were transferred from a common source. As shown on the spatial dis-tribution maps, these metals were transported from the land by streams (Fig. 2). OC, CDP, and CaCO3 were also transported from terrestrial sources by different streams. Pb and As were discharged from a water source, Hg was discharged due to its lithologic features, and Cd was discharged into the dam from Koca stream and Çınarlı stream basin (Fig. 10). Cluster analysis data were consistent with the spatial dis-tribution maps, the correlation analysis, and the factor analysis.
3. Conclusion
Our findings show that Hg posed a significant ecological risk, Cd a moderate ecological risk, As and Ni a close-to-moderate ecological risk, and the other metals exhibited a low ecological risk based on the li-thologic background values. In relation to the core sample background values, Hg was at the lower limits of the significant ecological risk level, Cd was at moderate ecological risk level and no ecological risk was
identified for the other metals. TRI analysis showed a low toxic risk in the Dam Lake. Metals that may create an ecological risk for the Dam Lake were identified as Hg, Cd, As and Ni. While multivariate statistical analyses and spatial distribution maps indicated Hg and As of lithologic origin and Cd and Ni as of anthropogenic origin. The probable source was fertilizers used on agricultural land for Cd and mining quarry lo-cated at the intersection of Bağırsak stream basin and Koca stream basin for Ni. The risk decreased in the present day according to the vertical distribution of the potential ecological risk. However, it is necessary to keep other anthropogenic activities, primarily agriculture, under con-trol so that the level of ecological risk in the Dam Lake does not in-crease. Otherwise, the ecological risk will increase in the dam and sustainable use of the lake will be interrupted. As a result of this study, moderate potential ecological risk was identified in İkizcetepeler Dam Lake based on lithologic properties and anthropogenic activities.
CRediT authorship contribution statement
Şakir Fural: Data curation, Investigation, Methodology,
Conceptualization, Resources, Visualization, Writing - original draft.
Serkan Kükrer: Project administration, Data curation, Investigation,
Methodology, Conceptualization, Writing - review & editing. İsa
Cürebal: Project administration, Funding acquisition, Supervision,
Writing - review & editing.
Declaration of Competing Interest
The authors declare that they have no known competing financial interests or personal relationships that could have appeared to influ-ence the work reported in this paper.
Acknowledgements
This study was carried out with the financial support of Balıkesir University, Scientific Research Projects Unit (BAP). We would like to thank Professor Dr. Ahmet Evren Erginal for supervising the project stage of the study, Furkan Inan for his help in the field work, and Mr. Graham Lee for proof-reading the text.
References
Atabey, E., 2009. Arsenic and its Effects. General Directorate of Mineral Research and Exploration, Ankara ISBN: 6054075284, 9786054075287.
Başaran, G., 2010. Comparative investigation of heavy metal contracts in Kapulukaya Dam Lake (Kırıkkale) and lower basin water, sediment and aquatic plant samples. Kırıkkale University, Institute of Science, Department of Biology PhD Thesis. Bolat, İ., Kara, Ö., 2017. Plant nutrients: sources, functions, deficiencies and excesses. J.
Bartin Faculty For. 1 (19), 218–228. https://doi.org/10.24011/barofd.251313. Brady, J.P., Ayoko, G.A., Martens, W.N., Goonetilleke, A., 2015. Development of a hybrid
pollution index for heavy metals in marine and estuarine sediments. Environ. Monit. Assess. 187 (306). https://doi.org/10.1007/s10661-015-4563.
Brekhovskikh, V., Volkova, Z., Katunin, D., Kazmiruk, V., Kazmiruk, T., Ostrovskaya, E., 2002. Heavy metal in bottom sediment in the upper and lower Volga. Water Resour. 5 (29), 539–547. https://doi.org/10.1023/A:1020377915283.
Cabrita, T.S., Duarte, B., Gameiro, C., Godinho, M.R., Cacador, I., 2018. Photochemical features and trace element substituted chlorophylls as early detection biomarkers of metal exposure in the model diatom Phaeodactylum tricornutum. Ecol. Ind. 95, 1038–1052. https://doi.org/10.1016/j.ecolind.2017.07.057.
Çevik, F., Göksu, M.Z., Derici, O.B., Fındık, Ö., 2009. An assessment of metal pollution in surface sediments of Seyhan dam by using enrichment factor, geoaccumulation index and statistical analyses. Environ. Monit. Assess. 152, 309–317. https://doi.org/10. 1007/s10661-008-0317-3.
Çiftçi, M., 2015. Determination of Seydisuyu basin (Eskişehir) water and sediment quality. Anadolu University Graduate School of Science Master Thesis. Cunningham, P., Sullivan, E., Everett, K., Kovach, S., Rajan, A., Barber, M., 2019.
Assessment of metal contamination in Arabian/Persian Gulf fish: a review. Mar. Pollut. Bull. 143, 264–283. https://doi.org/10.1016/j.marpolbul.2019.04.007. Dündar, Y., Arslan, R., 2005. Life surrounding lead and its effects. Kocatepe Med. J.
6, 1–5.
Eid, E., Shaltout, K., El-Sheikh, M., et al., 2012. Seasonal courses of nutrients and heavy metals in water, sediment and above- and below-ground Typha domingensis biomass in Lake Burullus. Perspectives for phytoremediation. Flora – Morphol. Distrib. Funct. Ecol Plants 207 (11), 783–794. https://doi.org/10.1016/j.flora.2012.09.003. Engin, M.S., 2012. Investigation of heavy metal deposition properties of some aquatic
plants growing in Kızılırmak Delta and removal of pollution maps of wetlands in delta. 19 Mayıs University, Institute of Science, Chemistry Department PhD Thesis. Erdoğan, M., 2014. Investigation of some heavy metal accumulation in water, sediment and carp (Cyprinus carpio L., 1758) samples in Karacaören I Dam Lake. Süleyman Demirel University, Institute of Science, Department of Biology Master Thesis. FAO, 2007. The State Of Food And Agriculture. World Wildlife Fund Report, Rome, Italy. Fural, Şakir, Kükrer, Serkan, Cürebal, İsa, 2019. Temporal and Spatial Disturbition of the Organic Carbon Content in Sediments of İkizcetepeler Dam Lake (Balıkesir). Turk. J. Agric. Food Sci. Technol. 7 (12). https://doi.org/10.24925/turjaf.v7i12.2204-2208. 2966.
Gaudette, H., Flight, W., Toner, L., Folger, D., 1974. An inexpensive titration method for the determination of organic carbon in recent sediments. J. Sediment. Res. 44, 249–253.
Goher, M., Farhat, H., Abdo, M., Salem, G., 2014. Metal pollution assessment in the surface sediment of Lake Nasser, Egypt. Egypt. J. Aquat. Res. 40 (3), 203–224. https://doi.org/10.1016/j.ejar.2014.09.004.
Hahn, J., Opp, C., Evgrafova, A., Groll, M., Zitzer, N., Laufenberg, G., 2018. Impacts of dam draining on the mobility of heavy metals and arsenic in water and basin bottom sediments of three studied dams in Germany. Sci. Total Environ. 640–641, 1072–1081. https://doi.org/10.1016/j.scitotenv.2018.05.295.
Hakanson, L., 1980. An ecological risk index for aquatic pollution control. A sedi-mentological approach. Water Res. 14 (8), 975–1001. https://doi.org/10.1016/ 0043-1354(80)90143-8.
Ishiwatari, R., Negishi, K., Yoshikawa, H., Yamamoto, S., 2009. Glacial–interglacial productivity and environmental changes in Lake Biwa, Japan: a sediment core study of organic carbon, chlorins and biomarkers. Org Geochem. 40, 520–530. https://doi. org/10.1016/j.orggeochem.2009.01.002.
Jiang, T., Bravo, G., Skyllberg, U., Bjorn, E., Wang, D., Yan, H., Green, W., 2018. Influence of dissolved organic matter (DOM) characteristics on dissolved mercury (Hg) species composition in sediment porewater of lakes from southwest China. Water Res. 146, 146–158. https://doi.org/10.1016/j.watres.2018.08.054.
Jorfi, S., Maleki, R., Jaafarzadeh, N., Ahmadi, M., 2017. Pollution load index for heavy metals in Mian-Ab plain soil, Khuzestan, Iran. Data in Brief 15, 584–590. https://doi. org/10.1016/j.dib.2017.10.017.
Kar, M., 2011. Investigation of seasonal change of heavy metal levels in Yamula Dam (Kayseri) water, sediment and freshwater mullet (Squalıus Cephalus) samples. Erciyes University, Institute of Science, Department of Biology Master Thesis. Karakaya, F., 2011. Heavy metal content and origin of Silifke – Alanya (Mediterranean)
beach sands. Niğde University, Institute of Science, Geological Engineering Department.
Kırmızıgül, O., 2013. Determination of heavy metal levels of Gökçekaya Dam Lake bottom sediment. Gazi University, Institute of Science, Department of Environmental Sciences.
Kükrer, S., 2016. Comprehensive risk assessment of metal accumulation in Tortum Lake surface sediments via ecological indexes. Turk. J. Agric. Food Sci. Technol. 4 (12), 1185–1191. https://doi.org/10.24925/turjaf.v4i12.1185-1191.969.
Kükrer, Serkan, 2017. Pollution, source, and ecological risk assessment of trace elements in surface sediments of Lake Aktaş, NE Turkey. Hum. Ecol. Risk Assessent. 23 (7). https://doi.org/10.1080/10807039.2017.1332953.
Kükrer, S., 2018. Vertical and horizontal distribution, source identification, ecological and toxic risk assessment of heavy metals in sediments of Lake Aygır, Kars, Turkey. Environ. Forensics 19 (2), 122–133. https://doi.org/10.1080/15275922.2018. 1448905.
Kükrer, S., Erginal, A.E., Kılıç, Ş., Bay, Ö., et al., 2020. Ecological risk assessment of surface sediments of Çardak Lagoon along a human disturbance gradient. Environ. Monit. Assess. 192 (359). https://doi.org/10.1007/s10661-020-08336-9. Kükrer, S., Mutlu, E., 2019. Assessment of surface water quality using water quality index
and multivariate statistical analyses in Saraydüzü Dam Lake Turkey. Environ. Monit. Assess. 191 (2). https://doi.org/10.1007/s10661-019-7197-6.
Kükrer, S., Erginal, A.E., Şeker, S., Karabıyıkoğlu, M., 2015. Distribution and environ-mental risk evaluation of heavy metal in core sediments from Lake Çıldır (NE Turkey). Environ. Monit. Assess. 187 (7). https://doi.org/10.1007/s10661-015- 4685-1.
Kutlu, B., 2018. Dissemination of heavy-metal contamination in surface sediments of the Uzunçayır Dam Lake, Tunceli, Turkey. Hum. Ecol. Risk Assessent. 24 (8), 2182–2194. https://doi.org/10.1080/10807039.2018.1441703.
Liu, M., Yuyi, Y., Yun, X., 2015. Concentrations, distribution, sources, and ecological risk assessment of heavy metals in agricultural topsoil of the Three Gorges Dam Region, China. Environ Monit Assess. 187 (3), 147. https://doi.org/10.1007/s10661-015- 4360-6.
Lorenzen, C., 1971. Chlorophyll-degradation products in sediments of Black Sea. Woods Hole Oceanogr. Inst. Contrib. 28, 426–428.
Loska, Krzysztof, Cebula, Jan, Pelczar, Jacek, Wiechuła, Danuta, Kwapuliński, Jerzy, 1997. Use of enrichment, and contamination factors together with geoaccumulation indexes to evaluate the content of Cd, Cu, and Ni in the Rybnik water reservoir in Poland. Water Air Soil Pollut. 93, 347–365.
Loska, K., Wiechuła, D., 2003. Application of principal component analysis for the esti-mation of source of heavy metal contaminationin surface sediments from the Rybnik Reservoir. Chemosphere 51, 723–733. https://doi.org/10.1016/S0045-6535(03) 00187-5.
Macdonald, D.D., Carr, R.S., Calder, F.D., 1997. Development and evaluation of sediment quality guidelines for Florida coastal waters. Oceanogr. Lit. Rev. 6 (44), 638. Müller, G., 1969. Index of geo-accumulation in sediments of the Rhine river. Geochem. J.
2, 108–118.
Özözen, G., 2005. Determination of some heavy metal concentrations in fish, water and sediment samples taken from Demirköprü and Avşar Dams. Celal Bayar University, Institute of Science Master Thesis.
Pehlivan, H., 2017. Investigation of heavy metal quantity in Marmara Sea South (Kocasu Delta) sediments. Hacettepe University, Institute of Science, Environmental Engineering Department.
Peraza, J., Anda, J., Farias, F., Rode, M., 2015. Assessment of Heavy Metals in Sediments of Aguamilpa Dam, Mexico. Environ. Monit. Assess. 3 (187), 4359–4370. https://doi. org/10.1007/s10661-015-4359.
Raphael, K., Vincent, K., David, E., 2016. Assessment of heavy metal contamination in the Weija Dam, Ghana. J. Natl. Sci. Res. 2 (6), 18–26.
Sawicka, K., Rakowska, A., 1993. Heavy metal contamination in Polish national parks. Sci. Total Environ. 134, 161–166.
Schlichting, E., Blume, H., 1966. Bodenkundliches praktikum. Verlag Paul, Hamburg und Berlin.
Selvi, K., 2012. Heavy metal accumulation and toxicity in water, sediment and some macro invertebrates in Umurbey Stream and Dam (Çanakkale). Çanakkale 18 Mart University, Institute of Science, Fisheries Department PhD Thesis.
Sey, E., Belford, E., 2019. Levels of heavy metal and contamination status of a decom-missioned Tailing Dam in Ghana. Environ. Qual. 35, 33–50.
Shetye, S.S., Suthakar, M., Mohan, R., Tyagi, A., 2009. Implications of organic carbon, trace elemental and CaCo3 variations in a sediment core from the Arabian Sea. Indian J. Marine Sci. 38, 432–438.
Siegenthaler, U., Sarmiento, J., 1993. Atmospheric carbon dioxide and the ocean. Nature 365, 119–125.
Suresh, G., Ramasamy, V., Meenakshisundaram, V., Venkatachalapathy, R., Ponnusamy, V., 2011. Influence of mineralogical and heavy metal composition on natural radionuclide contents in the river sediments. Appl. Radiat. Isot. 69 (10), 1466–1474. https://doi.org/10.1016/j.apradiso.2011.05.020.
Sutherland, R., 2000. Bed sediment associated trace metals in an urban stream, Oahu. Hawaii Environ. Geol. 39, 611–627. https://doi.org/10.1007/s002540050473. Tagliaferro, M., Gonçalves, A., Bergman, M., Sobral, O., Graça, M., 2018. Assessment of
metal exposure (uranium and copper) by the response of a set of integrated bio-markers in a stream shredder. Ecol. Ind. 95, 991–1000. https://doi.org/10.1016/j. ecolind.2017.10.065.
Tao, Y., Yuan, Z., Xiaona, H., Wei, M., 2012. Distribution and bioaccumulation of heavy metals in aquatic organisms of different trophic levels and potential health risk as-sessment from Taihu Lake, China. Ecotoxicol. Environ. Safety 81, 55–64. https://doi. org/10.1016/j.ecoenv.2012.04.014.
Tomlinson, D., Wilson, J., Harris, C., Jeffrey, D., 1980. Problems in the assessment of heavy-metal levels in estuaries and the formation of a pollution index. Helgolander Meeresunters 33, 566–575.
Tsakovski, S., Kudlak, B., Simeonov, V., et al., 2012. Relationship between heavy metal distribution in sediment samples and their ecotoxicity by the use of the Hasse dia-gram technique. Anal. Chim. Acta 719, 16–23. https://doi.org/10.1016/j.aca.2011. 12.052.
Tunç, S.O., 2015. Evaluation of heavy metal pollution and accumulation of Asartepe Dam Lake (Ankara). Muğla Sıtkı Koçman University, Institute of Science, Geological Engineering, Department.
Tunca, E.Ü., 2016. Heavy metal accumulation in water and sediment and anthropogenic contamination in sediment. Ordu Univ. J. Sci. Technol. 2, 205–219.
Tytła, Malwina, Kostecki, Maciej, 2019. Ecological risk assessment of metals and me-talloid in bottom sediments of water reservoir located in the key anthropogenic “hot spot” area (Poland). Environ. Earth Sci. 78 (179). https://doi.org/10.1007/s12665- 019-8146-y.
Ustaoğlu, F., Islam, M.D., 2020. Potential toxic elements in sediment of some rivers at Giresun, Northeast Turkey: a preliminary assessment for ecotoxicological status and health risk. Ecol. Ind. 113, 106237. https://doi.org/10.1016/j.ecolind.2020.106237. Ustaoğlu, F., Tepe, Y., 2019. Water quality and sediment contamination assessment of
Pazarsuyu Stream, Turkey using multivariate statistical methods and pollution in-dicators. Int. Soil Water Conserv. Res. 7, 47–56. https://doi.org/10.1016/j.iswcr. 2018.09.001.
Ustaoğlu, F., Tepe, Y., Taş, B., 2020. Assessment of stream quality and health risk in a subtropical Turkey river system: a combined approach using statistical analysis and water quality index. Ecol. Ind. 113, 105815. https://doi.org/10.1016/j.ecolind.2019. 105815.
Uwah, I., Dan, S., Etiuma, R., Umoh, U., 2013. Evaluation of status of heavy metals pollution of sediments in qua-iboe river estuary and associated creeks, South Eastern Nigeria. Environ. a Pollut. 2 (4), 110–122. https://doi.org/10.5539/ep.v2n4p110. Wang, X., Zhao, L., Xu, H., Zhang, X., 2018. Spatial and seasonal characteristics of dis-solved heavy metals in the surface seawater of the Yellow River Estuary, China. Mar. Pollut. Bull. 137, 465–473. https://doi.org/10.1016/j.marpolbul.2018.10.052. Woszczyk, M., Bechtel, A., Gratzer, R., 2011. Composition and origin of organic matter in
surface sediments of Lake Sarbsko: a highly eutrophic and shallow coastal lake (Northern Poland). Org Geochem. 42, 1025–1038. https://doi.org/10.1016/j. orggeochem.2011.07.002.
Xu, M., Sun, W., Wang, R., 2019. Spatial distribution and ecological risk assessment of potentially harmful trace elements in surface sediments from Lake Dali, North China. Water Res. 11, 2554. https://doi.org/10.3390/w11122544.
Yang, J., Ling, C., Lui, Z.L., Shi, L.W., 2014. Comprehensive risk assessment of heavy metals in lake sediment from public parks in Shanghai. Ecotoxicol Environ. 102, 129–135. https://doi.org/10.1016/j.ecoenv.2014.01.010.
Yao, C., Jiang, X., Che, F., Wang, K., Zhao, L., 2019. Antimony speciation and potential ecological risk of metal(loid)s in plain wetlands in the lower Yangtze River valley, China. Chemosphere 218, 1114–1121. https://doi.org/10.1016/j.chemosphere. 2018.11.164.
Zhang, G., Bai, J., Zhao, Q., Lu, Q., 2016. Heavy metals in wetland soils along a wetland- forming chronosequence in the Yellow River Delta of China: levels, sources and toxic risks. Ecol Indic. 69, 331–339. https://doi.org/10.1016/j.ecolind.2016.04.042.