Bilkent-RETINA at Retrieving Diverse Social Images Task
of MediaEval 2014
Mustafa Ilker Sarac
Bilkent University,
Department of Computer Engineering, 06800, Ankara, Turkey.
[email protected]
Pinar Duygulu
Bilkent University,
Department of Computer Engineering, 06800, Ankara, Turkey.
[email protected]
ABSTRACT
This paper explains the approach proposed by Bilkent -RETINA team for the Retrieving Diverse Social Images task of MediaEval 2014 [1]. We develop a framework which first removes outliers using one-class support vector machines (SVM) to improve relevance. Second it clusters the elimi-nated set and retrieves the centroids to diversify the results. We tried to exploit visual only features during our experi-ments. For the first run we used the provided visual features and for the second run we used well known visual features like SIFT [2] and GIST [4].
1.
INTRODUCTION
In today’s world image sharing applications are being used extremely. Users of Facebook upload 350 million photos1 each day and it is said to be equal to the number of photos have been taken during 19th century in total2. Given that
large number of images, search engines become more im-portant than ever in order to produce good quality search results. In this task the quality factors are determined by means of relevancy and diversity.
Participants were provided with a development dataset (de-vset) of 30 locations and a testing dataset (testset) of 123 locations [1]. Each location consists of up to 300 photos which are retrieved from Flickr using text information. In the following, we provide a framework which first removes the outlier images and then apply k-means clustering to ob-tain diversified results.
2.
PROPOSED APPROACH
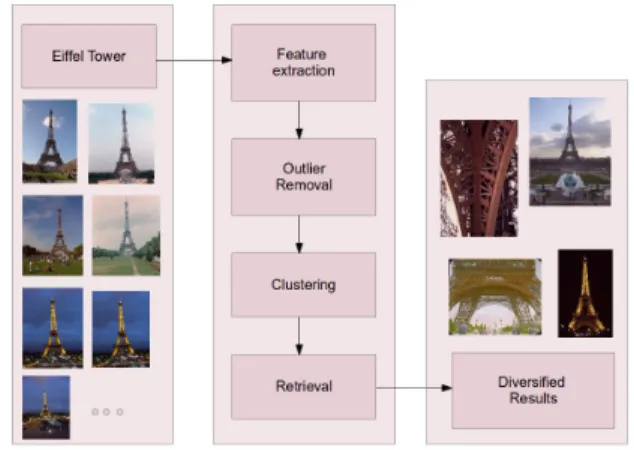
Our method can be summarized in 4 steps as shown in Figure 1, namely:
Step 1: Feature extraction
In this step we compute visual features for each image of each location. Some of the features are provided by the task and 2 of them are extracted by our team.
Step 2: Outlier removal
In order to increase number of relevant images for each loca-tion in the dataset, we apply an outlier removal procedure.
1
http://www.businessinsider.com/facebook-350-million-photos-each-day-2013-9
2
http://blog.1000memories.com/94-number-of-photos-ever-taken-digital-and-analog-in-shoebox
Copyright is held by the author/owner(s).
MediaEval 2014 Workshop,October 16-17, 2014, Barcelona, Spain
This procedure promisingly chop off some of the irrelevant images from the dataset and increase the P and F1 scores.
Figure 1: Overall framework structure. When the images related to a specific location are given as in-put, our framework produces diversified results for that location.
Step 3: Clustering
After the outlier removal step, in order to increase the di-versity score we apply k-means clustering to the remaining images at each location.
Step 4: Retrieval
In the retrieval step we select cluster centroids that we ob-tain in the previous step. Each centroid should represent a different aspect of a given location so that it is aimed to get a good diversification results.
3.
VISUAL FEATURES
The task organizers provide us with 6 visual descriptors (CM, CN, CSD, GLRLM, HOG, LBP) out of which 4 have also a spatial pyramid representation (CM, CN, GLRLM and LBP). We sought for the best combination of these fea-tures using provided devset images. We found out that best results are obtained when all these features are combined. So we concatenate all these 10 visual descriptors and come up with a feature vector of 945 dimensions for each image (i.e., descvis). Then we normalize each feature vector to zero mean and unit variance.
We also extracted other visual features like GIST and bag of visual words (BOVW) representations using dense SIFT features [2, 4]. We use these extra features while
construct-ing the fifth run of the challenge. GIST features are 512 dimensional global features and they are useful in capturing the scene information in images. It is important to cap-ture and differentiate scenery information in order to boost diversity of the results.
In order to compute dense-SIFT descriptors we use vlfeat ’s standart feature extactor tool [5]. First we resize each im-age to a fixed size of 200 by 200 pixels and then we obtain 128 by 5776 dimensional SIFT features per image. In or-der to create a pool of descriptors we randomly sample 100 descriptors from each image and then we apply k-means al-gorithm with ’plusplus’ option. We try 3 different k values (e.g., 600, 800 and 1000). According to the performance on devset, we choose k of k-means as 1000 and it becomes the volume of our visual words dictionary. Using this dictionary, we quantize each image to 1000 dimensional feature vectors.
4.
OUTLIER REMOVAL
We use SVM to find out the outliers and construct a sub-set of images per location which are more relevant than the initial set. Our method is similar to [3] but we use a fixed set of negative examples for each of devset and testset which are selected in the following ways. For devset images we picked 2 random images from each of the 30 locations, for testset images we select 60 random images from each of the 123 locations considering at most 1 image from each testset location. Then for each location, similar to cross valida-tion, we select 60 random positive images and first train and then classify using one-class SVM, and repeat this pro-cedure 10 times consecutively. Finally we select the model which scored the highest accuracy assuming that this model provides the best seperation. We use this process for each location, using the same negative examples at each step but with different positive examples. We use a quadratic ker-nel while experimenting with SVM because our features are dense vectors so that they are not easily seperable by lin-ear kernel functions. We observed on the devset that as the result of outlier removal process, we get rid of some of the ir-relevant images and obtain a higher relevancy score for each location.
5.
CLUSTERING AND RETRIEVAL
After outliers are removed we cluster the images of each location using a k-means algorithm. On the devset we try 2 different K values. First we select K as 25, because we observed that each location has at most 25 subclasses in their diversity subgroups. Second we select K as 50, because that was the maximum number of images required to be retrieved. The latter method, over clustering, seemed to work better in devset so that we report our test set results using K as 50.
After we compute cluster centroids, we simply retrieve images which are closest to the centroids. We apply k nearest neighbor method with Euclidean distance and search for the nearest neighbor for each centroid. While computing nearest neighbor we pay great attention to retrieve unique neighbors for each cluster centroid.
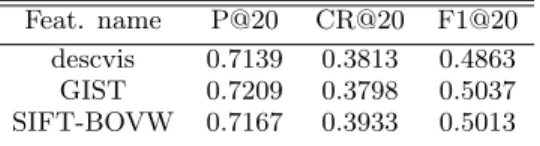
Results from devset are shown in Table 1. One may ob-serve that SIFT-BOVW [2] features works better than de-fault features. The reason is that local descriptors are gen-erally works better to capture similarities among images so that each cluster becomes more coherent. GIST [4] features
also perform better than the default features and perform similar to SIFT-BOVW features. Results from our 2 submis-sions, namely Run#1 and Run#5, can be found in Table 2. Similar to devset results, using SIFT-BOVW we obtain bet-ter results from Run#5 than Run#1.
Table 1: Results on devset using provided features, GIST and SIFT-BOVW.
Feat. name P@20 CR@20 F1@20
descvis 0.7139 0.3813 0.4863
GIST 0.7209 0.3798 0.5037
SIFT-BOVW 0.7167 0.3933 0.5013
Table 2: Official results on testset.
Run# P@20 CR@20 F1@20
1 0.6809 0.375 0.4758
5 0.7228 0.387 0.4966
6.
CONCLUSIONS
We showed that it is possible to obtain competitive results using only visual features. Our framework first eliminates the outliers and then using clustering it tries to leverage the diversity to the retrieval results. However it is obvious that one can improve the scores by utilizing more information into our framework like textual features, credibility scores.
7.
ACKNOWLEDGMENTS
This research was supported by the MUCKE project funded within the FP7 CHIST-ERA scheme and also Scientific and Technical Research Council of Turkey (TUBITAK) under grant number 112E174.
8.
REFERENCES
[1] B. Ionescu, A. Popescu, M. Lupu, A. L. Gˆınsc˘a, and H. M¨uller. Retrieving diverse social images at mediaeval 2014: Challenge, dataset and evaluation. In MediaEval 2014 Workshop, October 16-17, Barcelona, Spain, 2014. [2] D. G. Lowe. Object recognition from local
scale-invariant features. In Computer vision, 1999. The proceedings of the seventh IEEE international
conference on, volume 2, pages 1150–1157. Ieee, 1999. [3] H. Lukashevich, S. Nowak, and P. Dunker. Using
one-class svm outliers detection for verification of collaboratively tagged image training sets. In Multimedia and Expo, 2009. ICME 2009. IEEE International Conference on, pages 682–685. IEEE, 2009.
[4] A. Oliva and A. Torralba. Building the gist of a scene: The role of global image features in recognition. Progress in brain research, 155:23–36, 2006. [5] A. Vedaldi and B. Fulkerson. VLFeat: An open and