INVESTIGATION OF THE EFFECT OF MICRO
ARC OXIDATION AND SHOT PEENING ON
CORROSION AND WEAR BEHAVIOR OF
AZ31-X-LA AND AZ31-X-ND ALLOYS
GALAL ELMENSOURI
2020
PhD THESIS
METALLURGICAL AND MATERIALS
ENGINEERING
Thesis Advisor
INVESTIGATION OF THE EFFECT OF MICRO ARC OXIDATION AND SHOT PEENING ON CORROSION AND WEAR BEHAVIOR OF AZ31-xLa
and AZ31-xNd ALLOYS
GALAL ELMENSOURI
T.C
Karabuk University Institute of Graduate Programs
Department of Metallurgical and Materials Engineering Prepared as PhD Thesis
Thesis Advisor
Prof. Dr. Hayrettin AHLATCI
KARABUK July 2020
ii
I certify that in my opinion the thesis submitted by Galal ELMENSOURI titled “INVESTIGATION OF THE EFFECT OF MICRO ARC OXIDATION AND SHOT PEENING ON CORROSION AND WEAR BEHAVIOR OF xLa and AZ31-xNd ALLOYS” is fully adequate in scope and in quality as a thesis for the degree of PhD.
Prof. Dr. Hayrettin AHLATCI ...
Thesis Advisor, Department of Metallurgical and Materials Engineering
APPROVAL
This thesis is accepted by the examining committee with a unanimous vote in the Department of Metallurgical and Materials Engineering as a PhD thesis. 09.07.2020
Examining Committee Members (Institutions) Signature
Chairman : Prof.Dr. Mustafa ACARER (SU) ...
Member : Prof.Dr. Hayrettin AHLATCI (KBU) ...
Member : Assoc.Prof.Dr. Yunus TÜREN (KBU) ...
Member : Assoc.Prof.Dr. Okan ÜNAL (KBU) ...
Member : Assoc.Prof.Dr. Ebru Emine ŞÜKÜROĞLU (GU) ...
The degree of PhD by the thesis submitted is approved by the Administrative Board of the Institute of Graduate Programs, Karabuk University.
Prof. Dr. Hasan SOLMAZ ...
iii
“I declare that all the information within this thesis has been gathered and presented in accordance with academic regulations and ethical principles and I have according to the requirements of these regulations and principles cited all those which do not originate in this work as well.”
iv
ABSTRACT
M. Sc. Thesis
INVESTIGATION OF THE EFFECT OF MICRO ARC OXIDATION AND SHOT PEENING ON CORROSION AND WEAR BEHAVIOR OF AZ31-xLa
AND AZ31-xNd ALLOYS
Galal Elmensouri
Karabük University
Institute of Graduate Programs
The Department of Metallurgical and Materials Engineering
Thesis Advisor:
Prof. Dr. Hayrettin AHLATCI July 2020, 68 pages
To reduce the CO2 emission and to increase the energy efficiency, the using of
magnesium alloys as a light material in automotive and space industries is important due to their low density of 1,74 g/cm3 and high specific strength. Moreover, as biomaterial the Mg alloys is an important candidate due to their corrosion resistance could be control thanks to alloying elements or surface modifications. Furthermore, the rare earth metals are the excellent texture modifier and they impart stable microstructure to Mg alloys in which secondary phases resisting extreme corrosion or wear conditions. Besides, shot peening is acceptable method to develop the surface strength of light materials such as aluminum or magnesium. In addition, micro arc oxidation (MAO) can be used as effective way to increase the corrosion and wear resistance of light materials. However, many studies about improving of corrosion or wear resistance of Mg alloys is limited at as-cast materials. In this study, we produced
v
AZ31 Mg alloys containing Neodymium (Nd) and Lanthanum (La) elements as using of low pressure die casting method, following hot rolling was utilized to obtain 2 mm sheets which deformed at different rolling speed. After the hot rolling, some of the produced sheets was exposed directly MAO or some of them was exposed both shot peening and MAO. To examine the wear and corrosion resistance of materials the wear and corrosion tests were applied at dry condition and 3,5%NaCl solution at 25°C, respectively. The microstructure after coating was characterized by scanning electron microscopy (SEM) and X-ray diffraction (XRD). Further, the surface properties were obtained by profilometer as surface roughness.
Key Words : AZ31(+La, Nd), Hot rolling, Shot peening, MAO, Corrosion, Wear. Science Code : 91519
vi
ÖZET
Doktora Tezi
MİKRO ARK OKSİDASYON VE BİLYELİ DÖVME İŞLEMLERİNİN AZ31-xLa VE AZ31-xNd MAGNEZYUM ALAŞIMLARININ KOROZYON VE
AŞINMA DAVRANIŞLARINA ETKİSİNİN İNCELENMESİ
Galal ELMENSOURI
Karabük Üniversitesi Lisansüstü Eğitim Enstitüsü
Metalurji ve Malzeme Mühendisliği Anabilim Dalı
Tez Danışmanı:
Prof. Dr. Hayrettin AHLATCI Temmuz 2020, 68 sayfa
CO2 emisyonunu azaltmak ve enerji verimliliğini artırmak için, magnezyum
alaşımlarının otomotiv ve uzay endüstrilerinde hafif bir malzeme olarak kullanılması, 1,74 g / cm3 düşük yoğunluğu ve yüksek özgül mukavemeti nedeniyle önemlidir. Ayrıca, biyo-malzeme olarak Mg alaşımları korozyon direncinden dolayı önemli bir adaydır, bu özellik alaşım elementleri veya yüzey modifikasyonları sayesinde kontrol edilebilir. Ayrıca, nadir toprak metalleri mükemmel doku modifiye edicidir ve ikincil fazların aşırı korozyon veya aşınma koşullarına dirençli olduğu Mg alaşımlarına kararlı mikroyapı verir. Buna ilaveten, bilyeli dövme işlemi alüminyum veya magnezyum gibi hafif malzemelerin yüzey mukavemetini geliştirmek için kabul edilebilir bir yöntemdir. Ek olarak, mikro ark oksidasyonu (MAO), hafif malzemelerin korozyonunu ve aşınma direncini arttırmak için etkili bir yol olarak kullanılabilir. Bununla birlikte, Mg alaşımlarının korozyonu veya aşınma direncinin iyileştirilmesi
vii
ile ilgili birçok çalışma döküm malzemelerde sınırlıdır. Bu çalışmada, farklı haddeleme hızlarında deforme olan 2 mm levhalar elde etmek için düşük basınçlı döküm yöntemi kullanılarak Neodyum (Nd) ve Lantan (La) elementleri içeren AZ31 Mg alaşımları ürettik. Sıcak haddeleme işleminden sonra, üretilen saç malzememelerin bir kısmı doğrudan MAO'ya maruz bırakıldı ya da bir kısmı da hem bilyeli dövme hem de MAO'ya maruz bırakıldı. Malzemelerin aşınma ve korozyon direncini incelemek için aşınma ve korozyon testleri sırasıyla 25 ° C'de kuru durumda ve %3,5 NaCl çözeltisi ile uygulanmıştır. Kaplama sonrası mikroyapı, taramalı elektron mikroskopisi (SEM) ve X-ışını kırınımı (XRD) ile karakterize edildi. Ayrıca yüzey özellikleri profilometre ile yüzey pürüzlülüğü olarak elde edilmiştir.
Anahtar Kelimeler : AZ31 (+ La, Nd), Sıcak haddeleme, Bilyeli yüzey dövme,
MAO, Korozyon, Aşınma.
viii
ACKNOWLEDGMENT
I would like to reveal my major thanks of gratitude to my advisor Prof. Dr. Hayrettin AHLATCI who gave me the glorious moment for the extended support of my Ph.D. research and detailed analysis, for his perseverance, interest, and tremendous insight. His direction encouraged great exploration moreover I moved to learn about so many new things. I am absolutely grateful to him. Besides my advisor, I would like to thank the rest of my thesis committee: Dr. Yunus Turan, Dr. Okan Ünal, and Dr. Ebru Emine Süküroglu and Dr. Ismael Hakki KARA, for their encouragement, insightful comments, and hard questions.
Second, I would like to extend my sincere thanks to the Libyan state, which supported me financially, and also my thanks to the Turkish state and to the Turkish people with whom I lived during the period of my PhD study.
Finally, I would also like to thank my family and my friends who helped me a lot in finalizing this thesis within the limited time frame.
ix CONTENTS Page APPROVAL ... ii ABSTRACT ... iv ÖZET... vi ACKNOWLEDGMENT ... viii CONTENTS ... ix LIST OF FIGURES ... xi
LIST OF TABLES ... xiv
SYMBOLS AND ABBREVITIONS INDEX ... xv
PART 1 ... 1
INTRODUCTION ... 1
PART 2 ... 3
LITERATURE REVIEW... 3
2.1. DEFORMATION SYSTEMS IN MAGNESIUM ... 3
2.1.1. Slip ... 4
2.1.2. Twins ... 5
2.1.3. Dynamic Recrystallization (DRX) ... 5
2.2. CORROSION RATE BEHAVIOUR OF MG ALLOYS ... 6
2.2.1. The Surface Film and Coating of Mg Alloys ... 7
2.3. WEAR BEHAVIOUR OF MG ALLOYS ... 9
2.3.1. Effect of Rare Earth Metals, MAO and Shot Peening on Wear Behavior of Mg Alloys ... 11
2.3.2. Effect of Rare Earth Metals, MAO and Shot Peening on Corrosion Behavior of Mg Alloys ... 13
PART 3 ... 15
EXPERIMENTAL STUDIES ... 15
x
Page
3.1.1. Casting ... 15
3.1.2. Rolling ... 17
3.2. SHOT PEENING ... 17
3.3. MICRO ARC OXIDATION (MAO) ... 18
3.4. CORROSION TEST ... 18
3.5. WEAR TEST ... 19
3.6. SURFACE ROUGHNESS TEST ... 19
PART 4 ... 20 RESULTS ... 20 4.1. PHASE ANALYSIS ... 20 4.1. SURFACE ROUGHNESS ... 21 4.2. CORROSION TEST ... 21 4.3. WEAR TEST ... 23 PART 5 ... 26
DISCUSSION AND CONCLUSIONS ... 26
5.1. IMMERSION CORROSION TEST ... 26
5.1.1. AZ31 Mg Alloys ... 26 5.1.2. AZ31-La Mg Alloys ... 37 5.1.2.1. Surface Smoothness ... 39 5.1.2.2. Corrosion Test ... 39 5.1.2.3. After Corrosion ... 40 5.1.3. AZ31-Nd Mg Alloys ... 42 5.2. WEAR TEST ... 46 5.2.1. AZ31 Mg Alloys ... 46 5.2.2. AZ31 – La Mg Alloys ... 50 5.2.2. AZ31 – Nd Mg Alloys ... 51 REFERENCES ... 62 RESUME ... 68
xi
LIST OF FIGURES
Page
Figure 2.1. a) Mg unit cell, b) basal plane, c) prismatic plane, d) pyramidal and
e) the second order pyramidal plane. ... 4
Figure 2.2. Typical stress-strain curve with dynamic recrystallization. ... 6
Figure 2.3. Figure Adhesive Wear SEM images. ... 9
Figure 2.4. SEM Image of abrasive wear. ... 9
Figure 2.5. SEM Image of oxidation wear ... 10
Figure 2.6. SEM image of delamination wear ... 11
Figure 2.7. SEM images of MAO applied Mg alloys a and b of surfaces and c and d of cross sections. ... 12
Figure 2.8. SEM images after wear test of MAO applied Mg alloys. ... 14
Figure 3.1. Diagram of low-pressure gravity die casting furnace. ... 15
Figure 4.1. XRD templates of MAO coated materials. ... 20
Figure 5.1. The coating properties of investigated alloys. ... 27
Figure 5.2. LOM image of SP-MAO applied AZ31 Mg alloy. ... 28
Figure 5.3. SEM images of MAO and SP-MAO samples from their both surface and cross-sections and average pore size and filled area of them on the surfaces. ... 29
Figure 5.4. XRD pattern of MAO applied sample. ... 30
Figure 5.5. EDS analysis carried out on the surface of MAO applied sample. ... 31
Figure 5.6. Corrosion rates of investigated alloys. ... 33
Figure 5.7. The surface morphology after corrosion test. ... 34
Figure 5.8. The surface SEM images after corrosion test. ... 35
Figure 5.9. The cross-section SEM images after corrosion test. ... 36
Figure 5.10. SEM images of base metals rolled at 4,7 and 10 m/min. ... 37
Figure 5.11. SEM images of surface and cross-section of materials at rolled different speeds... 38
Figure 5.12. XRD patterns of MAO coated material rolled at 4.7 m / min. ... 38
Figure 5.13. Surface properties of the materials examined. ... 39
Figure 5.14. Corrosion rates of samples that were corroded for 168 hours in 3.5% NaCl... 40
xii
Page
Figure 5.16. Linear EDS analysis from section to base material after corrosion test. 41
Figure 5.17. The metal loss of specimens for various hours. ... 43
Figure 5.18. SEM surface images of a)MAO coated and b)SP / MAO treated AZ31 Mg alloys rolled at 4,7 m/min speed. ... 43
Figure 5.19. Specific corrosion rate of investigated samples. ... 43
Figure 5.20. Secondary phases of AZ31 alloy rolled at different rolling speed of a)4,7 m/min and b)10m/min. ... 44
Figure 5.21. Twins and DRXs of AZ31-0,5Nd alloy rolled at different rolling speed of a) 4,7 m/min and b)10m/min... 44
Figure 5.22. SEM images after corrosion test a) AZ31-0,5Nd and b) AZ31 Mg alloys treated with SP and coated by MAO both are rolled at 10m/min... 45
Figure 5.23. SEM of the (a) SP-MAO and (b) MAO applied specimen surfaces... 47
Figure 5.24. SEM of the (a) SP-MAO and (b) MAO applied specimen cross section. ... 47
Figure 5.25. Friction coefficient of the (a) SP-MAO and (b) MAO applied specimens. ... 48
Figure 5.26. Wear rate of the SP-MAO and MAO applied specimens of AZ31. ... 49
Figure 5.27. SEM of the (a) SP-MAO and (b) MAO applied specimens. ... 50
Figure 5.28. Wear rate of the SP-MAO and MAO applied specimens of AZ31 – 0,5La. ... 50
Figure 5.29. Wear rate of the SP-MAO and MAO applied specimens of AZ31 – 0,5La. ... 51
Figure 5.30. After wear test where at applied 2N load, the SEM image of AZ31 – 0,5La Mg Alloys that was rolled at 10 m/min rolling speed. ... 51
Figure 5.31. LOM images a) 4.7m/min, b) 10 m/min of AZ31-0,2Nd, c) 4.7 m/min and d) 10 m/min of AZ31-0,5Nd... 52
Figure 5.32. Surface roughness of alloys. ... 52
Figure 5.33. SEM images of MAO coated a) 4.7m/min, b) 10 m/min of AZ31-0,2Nd, c) 4.7 m/min and d) 10 m/min of AZ31-0,5Nd. ... 53
Figure 5.34. Wear test result of 0,2 Nd added alloys. ... 53
Figure 5.35. Wear test result of 0,5 Nd added alloys. ... 54
Figure 5.36. Average friction coefficient of investigated alloys. ... 55
Figure 5.37. Fig. 10. 2D topographies of the wear tracks on the MAO and SP applied/MAO coated samples labeled as n, k and h in Fig. 10. ... 56
xiii
Page
Figure 5.39. The worn surfaces under the different loads of 1,2 and 5 N of MAO coated and SP applied/MAO coated samples of AZ31-0,2 Nd and AZ31-0,5Nd. ... 58 Figure 5.40. Fig. 13. The wear track EDX analysis of SP applied and MAO coated
a) AZ31-0,2Nd alloy rolled at 4,7m/min and b) AZ31-0,5Nd alloy rolled at 10m/min under 2N load. ... 59
xiv
LIST OF TABLES
Page
Table 3.1. Casting Conditions. ... 16
Table 3.2. Raw materials used for production (% by weight). ... 16
Table 3.3. The chemical contents of the produced alloys. ... 16
Table 3.4. Rolling parameters. ... 17
Table 4.1. The Surface roughness of investigated samples. ... 21
Table 4.2. Immersion corrosion test results of investigated alloys. ... 22
Table 4.3. Wear test results of investigated alloys. ... 24
xv
SYMBOLS AND ABBREVITIONS INDEX
SYMBOLS 𝑔𝑟 : gram 𝑐𝑚 : centimeter ABBREVITIONS MPa : megapascal log : logarithmic Mg : Magnesium GPa : Gigapascal
1
PART 1
INTRODUCTION
Firstly, as a structure materials steel and aluminum could be replaced by Mg alloys because of their 1,74 g/cm3 density and high strength per density. As a result of their low density and high strength/density ratio, Mg alloys have engaged noticeable consideration as structural materials for utilizations in automotive and aerospace productions. While as a hexagonal close-packed (hcp) metal, Mg alloys have weak form ability at room condition due to number of self-reliant slipping arrangements. Concerning the Mg alloys, the non-basal slips are comparatively usable, and the plastic deformation is inhibited at room temperature because critical resolved shear stress of a basal plane is far lower than those of the non-basal planes on prismatic and pyramidal planes at low temperatures. Rolling is a good technique of forming Mg alloy; however, some objections emerge as rolling passes are added, smaller single pass reduction, low production and discernible mechanical anisotropy. These objections tremendously hinder the advancement of magnesium alloys. Furthermore, rolling outcomes in a strong basal texture with the c-axis coordinated virtually complementary to the sheet normal direction, which reduces basal slip in consecutive sheet forming. This brings about the high normal anisotropy in sheet, moderate work hardening and, therefore, low values of uniform elongation. Secondly, conventional metal base metallic materials like Ti, Co and Fe alloys have performed an important role in the repair or restoration of rotten or harmed bones as support implants. However, the elastic modulus of these alloys is considerably greater than that of the bone, which causes the implants placed within the bone to reduce bone density in that area, reducing bone tensile strength and drawing in. When compared to conventional metal alloys, a biodegradable material should contain properties that will not cause durable real discomfort but avoid secondary surgery in the removal of implants. Magnesium base metallic combinations as current possible biomaterials have inviting excellent
2
mechanical properties such as special density (1.7-2.0 g / cm3) and elastic modulus (41-45 GPa) values closest to human bone (1.8-2.1 g / cm3, 10-40 GPa) and thus minimizes the tensile strength in the bone. In addition, magnesium and its alloys are non-toxic and have good biocompatibility. Contrastingly, Mg ions are present in a large quantity in the human body and are link in countless metabolic feedbacks and structures. This means that Mg can be introduced into the human body as a metallic biomaterial, where it is slowly dissolved, consumed or absorbed. Thanks to Mg, adhesion of bone cell develops, and Mg regression has no effect on growth of cell. In contrast, high Mg ion concentration leads to activation of bone cell. However, the degradability of Mg is like a double-edged knife. Mg is a very reactive metal and has a high corrosion rate in physiological solutions. These high corrosion rate values should be under control or reduced if Mg is to be used as biomaterial. To achieve this, the coating can be used as a means of corrosion rate blocking. The rate of corrosion can be reduced to ensure that the metallic integrity remains mechanically as intact during the treatment of the bone. The coating application will also downplay the formation of hydrogen. Hydrogen formation is seen as a potential disadvantage. Normally, the coating will slowly wear out, leading to controlled material degradation.
3
PART 2
LITERATURE REVIEW
Magnesium (Mg) alloys have been broadly utilized in automotive and aerospace industries due to their low density and high strength/density [1]. Sadly, the application of magnesium alloys is often inhibited by unacceptable corrosion and fatigue properties. Micro arc oxidation (MAO) is most prevailing technique to insulate Mg alloys from corrosion [2]. Lately, innumerable performances have been managed to scrutinize the tracts of nanostructured exterior blankets on Mg alloys [3] and [4]. Research argued the useful influence of nano crystallization on the hardness and fatigue properties [5]. However, in terms of corrosion behavior of nanostructured surface layers on Mg alloys, incompatible outlooks are announced. The medical field is the potential application of Mg alloys due to the Mg alloys can be utilized as an implant for biomaterial. Firstly, the biocompatibility of Mg was introduced in the beginning of 20th century. Nonetheless, the actual accelerated corrosion and hydrogen progress phenomena belonging to Mg forced researchers to discontinue their first clinical operations. Afresh, a better understanding of corrosion mechanisms and the development of creative corrosion protection techniques have restored research concern with biodegradable Mg alloys [6] [7] [8] [9].
2.1. DEFORMATION SYSTEMS IN MAGNESIUM
Hexagonal tight package (HCP) structured Mg alloys have a c / a ratio of 1.624 It was calculated. The most important crystallographic role in the deformation of magnesium planes {0001} basal plane, {101̅0} prismatic plane, {1011} pyramidal plane and {1212} is the second order pyramidal plane. All these planes are given in Figure 2.1 [10] .
4
Figure 2.1. a) Mg unit cell, b) basal plane, c) prismatic plane, d) pyramidal and e) the second order pyramidal plane [10].
2.1.1. Slip
Slips in specific crystallographic planes and along certain crystallographic directions dislocations, resulting in atomic displacement. Different slip shifting of associated dislocations in systems (i.e. shear plane and direction), absorbed strains resulting in a constant deformation. According to Taylor in a randomly oriented polycrystalline metal the disclosure. more than five independent sliding systems are needed to achieve deformation. One When the dislocation reaches a grain boundary, the shear system will cannot shift from one to another due to the change in orientation. Therefore, shear to maintain shear activity, to prevent material breakage systems should be available [11] [8]. Volume-centered cubic (BCC) and surface Unlike centric cubic (FCC) crystal structures, HCP crystals meet the Taylor criteria. cannot contribute sufficient separate sliding system to fulfill Critical Strain (CRSS) values of these systems cause this situation [12]. Figure 3.1 shows the planes and directions of the major sliding systems in magnesium shows schematically. Of the four dominant shear systems, three (basal, prismatic and first order pyramid), close to each other direction of sliding <1120> share. Here, three sets of main planes (i) containing shear directions are basal, (ii) and (iii) pyramidal. Activation of these shift systems is only four can provide independent
5
slip system; any random stretch path it is still insufficient for five of them to accommodate [10]. Mg alloys the most important factor in shaping is temperature. A small number of sliding systems 225 Above ° C prismatic and pyramidal systems are active [13]. Herrera Solaz and arc. 0.5% Nd and 1% Nd (wt. examined the effect. CRSS basal / CRSS twinning ratio constant in 0.5Nd alloy remains but increased in 1Nd alloy, CRSS pyrasma / CRSS twinning and CRSS Pyramid / CRSS twinning ratio decreased after 0.5% Nd and 1% Nd alloy have been [14].
2.1.2. Twins
Twinning is the second time a metallic material exhibits during deformation as a mechanism. Particularly difficult to slip materials show twinning. There is no change in the crystal structure as a result of twinning but there is a change in the crystal lattice direction. Unlike atoms seen in shear they are displaced at the interatomic distance relative to each other. Single crystal twinning shared structure and original crystal. It remains. Twinning lattices are like the reflection of the original lattice in the mirror and The plane of symmetry between them is defined as the twin plane [8]. Twinning studies in the literature, it is divided into tensile and compression twinning. Elongation of crystalline c- along the axis {10-12} or by pull twinning. Tensile stresses along the c-axis or compression stress perpendicular to the c-axis occurs when applied [15]. Compression twins are {11-22} and {10-11}is created by [16]. Meng Y. et al. rupture usually it has been reported to occur by twins or slip bands [17]. Twin here formation and the highest local strain causes rupture [18].
2.1.3. Dynamic Recrystallization (DRX)
In metals where the softening rate is slow (ie, with low or medium stacking error energy), DRX may occur when a detracting deformation situation is signed in. As shown in Figure 3.5, the flow curve of a DRX treated material generally shows a broad peak [19]. The distinctive regions of the curve in Figure 3.4 are: 1. Dislocation intensity increases with stress during the first stages of deformation; When the stored energy reaches a critical value, the DRX starts with a critical strain (εc) before the peak
6
the formation of new particles deformed during deformation. Dynamic recrystallization occurs during the thermomechanical processes of Mg alloys, which contributes to wear and the formation of a finer microstructure. Numerous studies have been attended on the mechanisms of DRX in Mg alloys, which can be categorized into three different types: continuous (sub) DRX and discontinuous (bulging) DRX [19].
Figure 2.2. Typical stress-strain curve with dynamic recrystallization [42].
It is desirable to weaken the basal texture (0002) during rolling. However, DRX (0002) has been reported to have little effect on attenuation of the basal test [20]. The effect of rolling speed on DRX formation is quite high. It was reported that AZ31 Mg alloy, which was rolled at 400 ° C at 470 m / min rolling speed, first formed the twinning and then DRXs formed due to the twinning and also the fine-grained twins gained more place with increasing deformation rate. DRXs, especially formed on twin bands, have been reported to have smaller grains, lower internal stresses and weaker textures [21].
2.2. CORROSION RATE BEHAVIOUR OF MG ALLOYS
The thermodynamics of pure Mg is a base for appreciation the electrochemical corrosion of Mg compositions. The Mg balance in miscellaneous surroundings can also support advise for reckoning the corrosion rating of Mg alloys in typical statutes
7
which is accessible against understanding the thermodynamic behavior of Mg alloys. This meaning Mg in usual surroundings has an excellent trend to instinctively convert into its oxidized describes. Proportionately, if Mg is opened to environments including oxygen or water, its external section always leans to be very quickly oxidized, so that occurring an oxide or hydroxide surface film. Virtually there are many determinants that can influence the corrosive reactions and thus also induce the corrosion of Mg. For instance, the existence of oxygen in water can lead to greater or less oxygen decline on Mg which may have some effect on the cathodic and anodic polarization behaviors of Mg, especially in atmospheric surroundings where the amount of oxygen is sufficient.
2.2.1. The Surface Film and Coating of Mg Alloys
The surface of metal could be oxide in natural surroundings which gives rise to covering of oxide film or hydroxide film. Mg and its alloys be apt to be dissolved and oxidized in most possible surroundings. Subsequent corrosion products can deposit and form a surface film on its surface.
Plasma electrolytic oxidation (PEO) is an alluring engineering of surface processing for Mg compositions. Amid PEO, the Mg surface is swapping a ceramic coating stiffly using huge discharges of electric energy. This can attempt developed wear and corrosion resistance to different magnesium components, thus enlarging their areas of application. MAO is an extreme-voltage plasma-supported anodic oxidation method, commonly used for surface modifications of Mg and alloys. The plasma charge discharge in the course of the MAO process leads to limited momentary liquefying of the oxide layer and forms a highly sticky ceramic oxide coating. The MAO coating gives high hardness, good wear resistance and average corrosion resistance and better warm condition stability and non-conductivity of electric properties. The evolution of the MAO coating on Mg and its alloys first begins amidst the dissolution of the metal and the growing of the film of barrier. At this stage, the voltage shows a rapid and linear increase. The main force is provided by the electric field in transporting the positive ions and negative ions contained in the electrolyte through the barrier film and increases the thickness of the film at 0.6nm / V. The barrier film forming is escorted
8
by the development of O2. This step shows the ordinary anodic coating process. In the
initial moments of barrier film expansion, a homogeneous flow of current occurs along the film. However, when 100-200 nm thickness was observed on the film, it starts to show a resistance to current. Subsequently, in some regions of the barrier film, the insulating property is reduced and there is less resistance there, and thus the formation of discharge in the form of fine sparks begins. The voltage value at which this event occurs gives the breaking voltage. After this stage, the cell voltage starts to upsurge frequently. At this leg, the flow of prevailing only condenses in the fracture zones and leads to regional thickness increase. The formation of the fresh layer of coating revitalizes the resistance to current flow while the other parts tend to break because they are less resistant. Thus, too many fine white sparks are randomly dispersed and move rapidly over the entire anode surface. Mg implant materials treated with MAO give positive results in bone repair. Y Wu et al. MAO applied with different coating thickness compared to pure Mg alloy Mg alloys showed better biocompatibility. It is an advantage that the MAO coated Mg alloy provides slower gas formation during bone repair, and the rate of gas formation decreases with increasing coating thickness. In addition, MAO applied Mg implant material showed faster development in the first stage of cell adhesion and spread. In addition, the degradation time of the implant material is increased during treatment with MAO, where the rate of Mg (OH) 2
occurring is reduced, increasing the degradation time of the implant material. Surface roughness has an impact on the nucleation and development of the barrier film during the MAO process. Nashrah et al. The roughness of surface values of sheet AZ31 Mg alloy were obtained by using fine and coarse sanding to be 0.025µm and 1µm respectively, and then two materials were subjected to MAO treatment. The fracture voltage of the material having a high surface roughness was earlier than that where nucleation was more easily started in ridge areas. The performed electrochemical corrosion measurements showed that the MAO coating of the starting material with high surface roughness showed twice the polarization resistance due to the perforated structure. The large-perforated structure provides room for chemically interlocking secondary materials, thus contributing to corrosion resistance [22].
9
2.3. WEAR BEHAVIOUR OF MG ALLOYS
Description of wear is described as the loss of material caused by sliding, impact or rolling between two solid surfaces. Adhesive wear (see figure 2.3); type of wear that causes material transfer between two solids as a result of adhesive forces [23].
Figure 2.3. Figure Adhesive Wear SEM images [23].
Abrasive wear (see figure 2.4); it is caused by rubbing a solid material against a material that is harder or of the same hardness [24]. It shows itself in the constitute of grooves and scratches in the way of wear. Here, the more rigid counter-material causes abrasion of striped particles from the surface [25].
10
Oxidation: The presence of molten particles caused by heating during wear leads to oxidation wear (see figure 2.5). During continued wear, the oxide particles are dispersed in the worn cavities and adhere to each other. Here, the contact between the primary material and the abrasive material is reduced and consequently the wear rate is reduced [25].
Figure 2.5. SEM Image of oxidation wear [23].
Thermal softening and Melting; high wear rate during the wear or heat caused by heavy load causes the material to wear in bulk. In addition, there is a significant increase in wear rate in this environment. This case occurs especially in Mg alloys [26].
Delamination wear: in the form of short cracks in the approach perpendicular to the wear direction (see figure 2.6). Leaf-like particles cause creases to form over time [26] [22].
11
Figure 2.6. SEM image of delamination wear [23].
2.3.1. Effect of Rare Earth Metals, MAO and Shot Peening on Wear Behavior of Mg Alloys
Micro arc oxidation process depends on selected parameters to 1000 V (and approximately 1 MW in capacity) needs. This high energy is dangerous depending on the type and size of parts creates a production process. Given the amount of energy used micro arc production costs in the oxidation process to traditional anodic oxidation methods more than that. In addition, high temperature formed on the exterior section of the material high capacity for cooling the solution used in the process. Refrigerant will be needed. The ceramic coating formed as a result of the process is rough and it is very brittle, so its abrasion resistance is very low on the outermost surface. The inner layers of the ceramic coating have the opposite property. These layers it is quite hard and has high abrasion resistance. But on the surface of the material removal of the top layer of this ceramic coating is both cost effective and is not efficient in terms of production. Many advantages of micro arc oxidation Besides the above-mentioned disadvantages, the use of this technology limits.
Liang and et.al. studied AM60 B grade magnesium alloy, silica-based and phosphate based on two separate electrolytes and the effect of electrolyte on the MAO process aimed to research. Silica based Na2SiO3 + KOH mixture, Phosphate based on Na3PO4 + KOH mixture. Two equal times When comparing the results of the
12
experiment, phosphate-based electrolyte degradation and critical higher than the end voltage at the same time. They have determined that. When compared morphological properties, silica-based Electroplated coating is more homogeneous and compact, phosphate-based they found that the coating obtained by electrolyte was more porous. Alkali silicate MgO and Mg2SiO4 phases in the material structure. in the process using phosphate solution, only MgO phase is formed. It has been identified. Nonetheless, when formed layer hardness is examined, a layer of silicate solution with a higher hardness than a phosphate solution formation. This is because the Mg2SiO4 phase compared to the MgO phase more rigid. Coating obtained with alkaline silicate solution wear resistance was determined to be higher in the study, the layers corrosion resistances compared, obtained by silica-based electrolyte and more homogeneous and more compact layer with higher corrosion resistance [27].
Figure 2.7. SEM images of MAO applied Mg alloys a and b of surfaces and c and d of cross sections [27].
13
2.3.2. Effect of Rare Earth Metals, MAO and Shot Peening on Corrosion Behavior of Mg Alloys
Magnesium (Mg) alloys have been the attractive light materials to many industrials’ applications such as structural components of automotive and aircraft vehicles as a consequence their low g/cm3 and high MPa/density. AZ31 Mg alloys are the common alloys as commercially, although the weak corrosion which resulted from lower Al content than AZ61 or AZ91 types and poor wear resistance of them hinders their enlarged application areas. in the direction of overcome the unsatisfied corrosion or tribological properties of AZ31 Mg alloys, mainly the coating treatments such as anodizing or micro-arc oxidation (MAO) were utilized to develop both the weak corrosion and poor wear resistances thanks to MgO or Mg2SiO4 [28]. However, the surface treatment of shot peening (SP) mostly was applied to Mg alloys to enhance their fatigue life and wear resistance [29]. By the same token, it is perceived that the SP may be dangerous to corrosion properties of materials in the interest of the high roughness of surface and the used ferrous peening media during SP [30]. The alternative approach to modify the corrosion or wear resistance of Mg alloys is the rare earth metals (REMs) [31]. Moreover, the RE elements play an important role to deactivate impurity and make purer the matrix thus enhancing corrosion resistance effectively [32]. Furthermore, secondary phases reduce the galvanic corrosion where there is a decreasing electrode potential because of the Al11RE3 type secondary phases. Argade G.R. and et. al. studied the Nd added wrought Mg alloys applied oppressive plastic deformation, where it is reported that break-up during deformation of finer and uniformly secondary phases will be effective to the corrosion resistance of Mg alloys [33]. In the literature, Nd mostly was used to reinforce the high-temperature mechanical properties of Mg alloys [34]. However, the stability of secondary phases at higher temperatures can be used as improving wear resistance for Mg alloys. The finer grains can be obtained perfectly via rolling process allowing better corrosion resistance that can be accomplished by using high strain rates or higher rolling speeds [35]. It is reported that the lower strain rates or speeds give rise to twins dominated microstructure, where the corrosion resistance was deteriorated by formed higher stress on the boundaries of twins [18].
14
15
PART 3
EXPERIMENTAL STUDIES
3.1. MATERIALS
3.1.1. Casting
In this recent study, AZ31 Mg alloy and modified AZ31 Mg alloys were studied as the main material. The raw materials used for production are given in Table 3.2. Pure Mg, Al pure, pure Zn alloys from Turkey gauges are supplied from China. For the production, a special low-pressure gravity die casting method was used (Figure 3.1) and the casting conditions given in Table 3.1 were complied with. Pure Mg was first introduced into the stainless-steel crucible. After reaching a temperature of 775 ° C, after a waiting period of 1-hour, pure Al and gauge alloys were added to the ladle. Meanwhile, the molten metal in the crucible was continuously stirred. The final alloy addition was added to the pure Zn crucible and after 10 min stirring the molten metal was injected into stainless steel metal molds having a temperature of 355 ° C under 2-4 atm.
16
Table 3.1. Casting Conditions.
Protective gas
Melting temperature (° C)- Standby time (min)
Mold temperature (° C) Runner temperature (° C) Casting gas pressure (Atm) Argon 775-60 350 350 2-3
Table 3.2. Raw materials used for production (% by weight).
Raw material Mg Al Zn Mn La Nd Gd Purified Mg %99,99 ---- --- ---- ---- --- --- Purified Al ---- %99,98 - --- --- --- -- Purified Zn ---- ---- %99,989 --- --- --- -- Mastar Mn %90 --- --- %10 - - - Mastar-La %70 - - - %30 - - Mastar Nd %70 - - - - %30 -
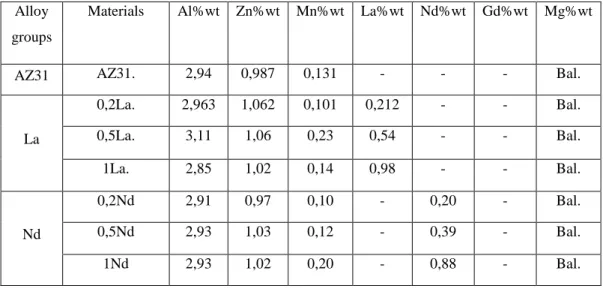
The chemical contents of the produced alloys are given in Table 3.3. Rigaku ZSX Primus II device belonging to XRF laboratory of Karabük University Iron and Steel Institute was used for chemical analysis.
Table 3.3. The chemical contents of the produced alloys.
Alloy groups
Materials Al%wt Zn%wt Mn%wt La%wt Nd%wt Gd%wt Mg%wt
AZ31 AZ31. 2,94 0,987 0,131 - - - Bal.
La 0,2La. 2,963 1,062 0,101 0,212 - - Bal. 0,5La. 3,11 1,06 0,23 0,54 - - Bal. 1La. 2,85 1,02 0,14 0,98 - - Bal. Nd 0,2Nd 2,91 0,97 0,10 - 0,20 - Bal. 0,5Nd 2,93 1,03 0,12 - 0,39 - Bal. 1Nd 2,93 1,02 0,20 - 0,88 - Bal.
17
3.1.2. Rolling
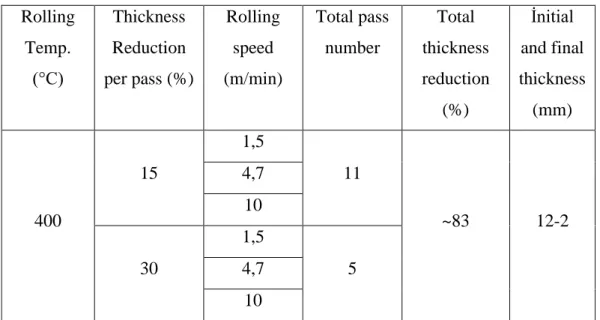
After casting, billets with dimensions of 120x36x12 mm were applied for homogenization heat treatment at 395-410 ° C for 23-24 hours. In order to prevent metal oxidation during homogenization and homogeneous temperature distribution, the materials were embedded in sand. Homogenized materials were hot rolled with parameters in Table 4.4. Here, 15% (total 11 passes) and 30% (total 5 passes) section constriction was applied in each pass. Interpass materials were stored in a furnace at 395-410 ° C for 5-6 minutes. After the narrowing total 83% of the section, billets with initial thickness of 12 mm was reduced to 2 mm thickness.
Table 3.4. Rolling parameters.
Rolling Temp. (°C) Thickness Reduction per pass (%) Rolling speed (m/min) Total pass number Total thickness reduction (%) İnitial and final thickness (mm) 400 15 1,5 11 ~83 12-2 4,7 10 30 1,5 5 4,7 10 3.2. SHOT PEENING
Air-type shot peening treatments with max. 8 bar pressure were carried out according to AISI 1070 after grinded samples with utilizing an air shot- peening machine of TAB firm and metal ball shots Z850 (Ø 850 μm) at steadily lengthy exposure moments (20 minutes) on double side of the sample that impacted 90° of steel ball. the samples of SP’ed were ultrasonically spruced up in methanol to clean dirty particles that coming from the SP process and rests of the ceramic medium.
18
3.3. MICRO ARC OXIDATION (MAO)
Micro-arc oxidation was applied on samples of rolled AZ31 Mg alloys with dimensions of 25mm*25mm*12mm. The upper area of all the sample was ground using silicon carbide papers # 600 up to # 1200 to certain reliable surface roughness and afterwards cleaned from dirty by ultrasonically with acetone and rinsed with pure water to eschew any surface grimy content prior to the MAO coating practice. A of 2 mm diameter of hole was drilled on the corner of the samples and a thin aluminum rod was utilized to hold the sample and to ensure proper electrical contact. The electrolytic solution was prepared by adding 4g/L of sodium silicate (Na2SiO3), 1g/L of potassium hydroxide (KOH) and 3g/L of disodium hydrogen phosphate (Na2 HPO4) to 4 L of distilled water. The sample of AZ31 Mg(+La, +Nd) alloys arranged for MAO treatment were associated to the (+)terminal of the power source, whereas the (-) terminal was joined to the stainless-steel bath containing electrolyte solution. Amid the MAO proceeding, the electrolyte solution was disturbed steadily by a magnetic mixer to provide legitimate distraction of heat from the electrolyte. Likewise, to preserve the condition consistent, the thorough electrolyte system was wrapped in a custom-made tub through which cold water was spread by an extraneous chiller. An indigenous invented pulsed DC power supply was operated for MAO procedure, which can convey voltage up to 800 V and current up to 20A. With experimental trials, the parameters were decided under constant current and voltage mode at a current density of 85 mA/cm2, frequency of 250 Hz and duty cycle of 10%. A constant voltage regime at a positive voltage 550 and a negative voltage of 100 V. MAO treatment were performed on the specimens for a time duration of 5 minutes.
3.4. CORROSION TEST
Immersion tests were implemented with 3.5% Sodium chloride mix at 25°C. The output of corrosion test were removed using 180 g l-1 CrO3 for 1 minute in ultrasonic cleansing machine and drained by ethonal before mass loss measure. Morphology of the alloys was examined by SEM after immersion test.
19
3.5. WEAR TEST
The behaviour of dry sliding wear of the SP applied and MAO coated specimens was determined proving a AISI 52100 steel ball of 6 mm diameter. Test procedure was set up according to ASTM G-133. The wear tests were executed at medium conditions at three different loads of 1N, 2N and 5N with an vacillate magnitude of 8 mm and at a sliding velocity of 5 mm s−1 for a sliding distance of 50m. Surface roughness and wear depth measurements were performed with a Mitutoyo profilometer. The worn surfaces of samples after wear test were examined by SEM. Further, characterization of the wear trails and the wear wreckage was accomplished in SEM with energy disperse spectra (EDS) analysis tool.
3.6. SURFACE ROUGHNESS TEST
The surface roughness, Ra, of the rolling direction on samples was computed handling surface profilometer (Mitutoya- SVC3200S4 model machine) affirming to ISO 1997 and the surveyed boundary was about 0.08 mm and three reiterations were attended for a moderate value.
20
PART 4
RESULTS
This section contains the results of test and analysis presented as Table and Figures in following parts.
4.1. PHASE ANALYSIS
The XRD results of investigated alloys was illustrated in Fig. 4.1.
21
4.1. SURFACE ROUGHNESS
Surface roughness of investigated samples was illustrated in Table 4.1.
Table 4.1. The Surface roughness of investigated samples.
Alloys MAO, 4.7m/min MAO, 10m/min SP-MAO, 4.7m/min SP-MAO, 10m/min AZ31 2,63 2,898 2,204 2,268 0,2La 2,796 3,226 2,430 3,024 0,5La 3,400 2,458 3,460 2,326 0,2Nd 3,055 3,401 2,308 2,338 0,5Nd 3,022 2,673 2,504 2,181 4.2. CORROSION TEST
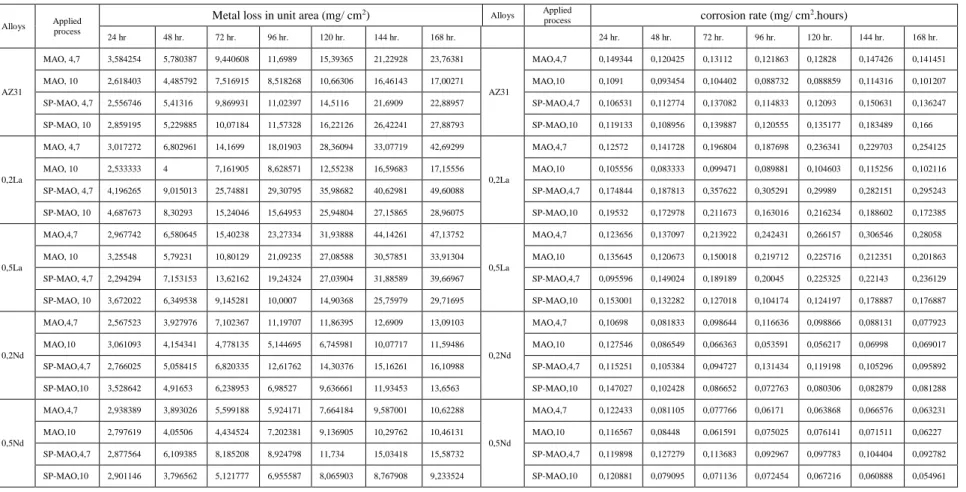
The corrosion test results are given in Table 4.2. The corrosion rate and specific corrosion rate were calculated by using of following formula.
Metal loss in unit area.
(𝑔/𝑐𝑚2) = 𝑚𝑒𝑡𝑎𝑙 𝑙𝑜𝑠𝑠/𝑐𝑜𝑟𝑟𝑜𝑑𝑒𝑑 𝑎𝑟𝑒𝑎
Specific corrosion rate.
22
Table 4.2. Immersion corrosion test results of investigated alloys.
Alloys Applied process
Metal loss in unit area (mg/ cm2) Alloys Applied
process corrosion rate (mg/ cm 2.hours) 24 hr 48 hr. 72 hr. 96 hr. 120 hr. 144 hr. 168 hr. 24 hr. 48 hr. 72 hr. 96 hr. 120 hr. 144 hr. 168 hr. AZ31 MAO, 4,7 3,584254 5,780387 9,440608 11,6989 15,39365 21,22928 23,76381 AZ31 MAO,4,7 0,149344 0,120425 0,13112 0,121863 0,12828 0,147426 0,141451 MAO, 10 2,618403 4,485792 7,516915 8,518268 10,66306 16,46143 17,00271 MAO,10 0,1091 0,093454 0,104402 0,088732 0,088859 0,114316 0,101207 SP-MAO, 4,7 2,556746 5,41316 9,869931 11,02397 14,5116 21,6909 22,88957 SP-MAO,4,7 0,106531 0,112774 0,137082 0,114833 0,12093 0,150631 0,136247 SP-MAO, 10 2,859195 5,229885 10,07184 11,57328 16,22126 26,42241 27,88793 SP-MAO,10 0,119133 0,108956 0,139887 0,120555 0,135177 0,183489 0,166 0,2La MAO, 4,7 3,017272 6,802961 14,1699 18,01903 28,36094 33,07719 42,69299 0,2La MAO,4,7 0,12572 0,141728 0,196804 0,187698 0,236341 0,229703 0,254125 MAO, 10 2,533333 4 7,161905 8,628571 12,55238 16,59683 17,15556 MAO,10 0,105556 0,083333 0,099471 0,089881 0,104603 0,115256 0,102116 SP-MAO, 4,7 4,196265 9,015013 25,74881 29,30795 35,98682 40,62981 49,60088 SP-MAO,4,7 0,174844 0,187813 0,357622 0,305291 0,29989 0,282151 0,295243 SP-MAO, 10 4,687673 8,30293 15,24046 15,64953 25,94804 27,15865 28,96075 SP-MAO,10 0,19532 0,172978 0,211673 0,163016 0,216234 0,188602 0,172385 0,5La MAO,4,7 2,967742 6,580645 15,40238 23,27334 31,93888 44,14261 47,13752 0,5La MAO,4,7 0,123656 0,137097 0,213922 0,242431 0,266157 0,306546 0,28058 MAO, 10 3,25548 5,79231 10,80129 21,09235 27,08588 30,57851 33,91304 MAO,10 0,135645 0,120673 0,150018 0,219712 0,225716 0,212351 0,201863 SP-MAO, 4,7 2,294294 7,153153 13,62162 19,24324 27,03904 31,88589 39,66967 SP-MAO,4,7 0,095596 0,149024 0,189189 0,20045 0,225325 0,22143 0,236129 SP-MAO, 10 3,672022 6,349538 9,145281 10,0007 14,90368 25,75979 29,71695 SP-MAO,10 0,153001 0,132282 0,127018 0,104174 0,124197 0,178887 0,176887 0,2Nd MAO,4,7 2,567523 3,927976 7,102367 11,19707 11,86395 12,6909 13,09103 0,2Nd MAO,4,7 0,10698 0,081833 0,098644 0,116636 0,098866 0,088131 0,077923 MAO,10 3,061093 4,154341 4,778135 5,144695 6,745981 10,07717 11,59486 MAO,10 0,127546 0,086549 0,066363 0,053591 0,056217 0,06998 0,069017 SP-MAO,4,7 2,766025 5,058415 6,820335 12,61762 14,30376 15,16261 16,10988 SP-MAO,4,7 0,115251 0,105384 0,094727 0,131434 0,119198 0,105296 0,095892 SP-MAO,10 3,528642 4,91653 6,238953 6,98527 9,636661 11,93453 13,6563 SP-MAO,10 0,147027 0,102428 0,086652 0,072763 0,080306 0,082879 0,081288 0,5Nd MAO,4,7 2,938389 3,893026 5,599188 5,924171 7,664184 9,587001 10,62288 0,5Nd MAO,4,7 0,122433 0,081105 0,077766 0,06171 0,063868 0,066576 0,063231 MAO,10 2,797619 4,05506 4,434524 7,202381 9,136905 10,29762 10,46131 MAO,10 0,116567 0,08448 0,061591 0,075025 0,076141 0,071511 0,06227 SP-MAO,4,7 2,877564 6,109385 8,185208 8,924798 11,734 15,03418 15,58732 SP-MAO,4,7 0,119898 0,127279 0,113683 0,092967 0,097783 0,104404 0,092782 SP-MAO,10 2,901146 3,796562 5,121777 6,955587 8,065903 8,767908 9,233524 SP-MAO,10 0,120881 0,079095 0,071136 0,072454 0,067216 0,060888 0,054961 .
23
4.3. WEAR TEST
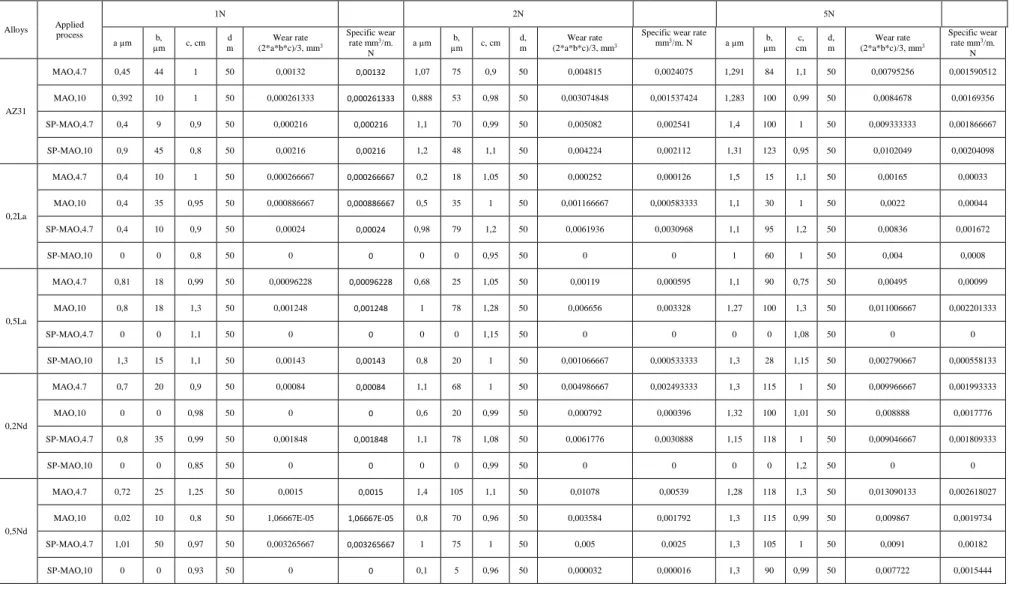
The wear test results are given in Table 4.3. The wear rate and specific wear rate were calculated by using of following formula.
Wear rate; 𝑉(𝑚𝑚3) =2
3𝑎. 𝑏. 𝑐
Where a and b are the height and width of wear track and c is long of wear track.
Specific wear rate; 𝑉(𝑚𝑚3/𝑚) = 𝑤𝑒𝑎𝑟 𝑟𝑎𝑡𝑒 / 𝑑.N
24
Table 4.3. Wear test results of investigated alloys.
Alloys Applied process 1N 2N 5N a µm b, µm c, cm d m Wear rate (2*a*b*c)/3, mm3 Specific wear rate mm3/m. N a µm b, µm c, cm d, m Wear rate (2*a*b*c)/3, mm3
Specific wear rate
mm3/m. N a µm b, µm c, cm d, m Wear rate (2*a*b*c)/3, mm3 Specific wear rate mm3/m. N AZ31 MAO,4.7 0,45 44 1 50 0,00132 0,00132 1,07 75 0,9 50 0,004815 0,0024075 1,291 84 1,1 50 0,00795256 0,001590512 MAO,10 0,392 10 1 50 0,000261333 0,000261333 0,888 53 0,98 50 0,003074848 0,001537424 1,283 100 0,99 50 0,0084678 0,00169356 SP-MAO,4.7 0,4 9 0,9 50 0,000216 0,000216 1,1 70 0,99 50 0,005082 0,002541 1,4 100 1 50 0,009333333 0,001866667 SP-MAO,10 0,9 45 0,8 50 0,00216 0,00216 1,2 48 1,1 50 0,004224 0,002112 1,31 123 0,95 50 0,0102049 0,00204098 0,2La MAO,4.7 0,4 10 1 50 0,000266667 0,000266667 0,2 18 1,05 50 0,000252 0,000126 1,5 15 1,1 50 0,00165 0,00033 MAO,10 0,4 35 0,95 50 0,000886667 0,000886667 0,5 35 1 50 0,001166667 0,000583333 1,1 30 1 50 0,0022 0,00044 SP-MAO,4.7 0,4 10 0,9 50 0,00024 0,00024 0,98 79 1,2 50 0,0061936 0,0030968 1,1 95 1,2 50 0,00836 0,001672 SP-MAO,10 0 0 0,8 50 0 0 0 0 0,95 50 0 0 1 60 1 50 0,004 0,0008 0,5La MAO,4.7 0,81 18 0,99 50 0,00096228 0,00096228 0,68 25 1,05 50 0,00119 0,000595 1,1 90 0,75 50 0,00495 0,00099 MAO,10 0,8 18 1,3 50 0,001248 0,001248 1 78 1,28 50 0,006656 0,003328 1,27 100 1,3 50 0,011006667 0,002201333 SP-MAO,4.7 0 0 1,1 50 0 0 0 0 1,15 50 0 0 0 0 1,08 50 0 0 SP-MAO,10 1,3 15 1,1 50 0,00143 0,00143 0,8 20 1 50 0,001066667 0,000533333 1,3 28 1,15 50 0,002790667 0,000558133 0,2Nd MAO,4.7 0,7 20 0,9 50 0,00084 0,00084 1,1 68 1 50 0,004986667 0,002493333 1,3 115 1 50 0,009966667 0,001993333 MAO,10 0 0 0,98 50 0 0 0,6 20 0,99 50 0,000792 0,000396 1,32 100 1,01 50 0,008888 0,0017776 SP-MAO,4.7 0,8 35 0,99 50 0,001848 0,001848 1,1 78 1,08 50 0,0061776 0,0030888 1,15 118 1 50 0,009046667 0,001809333 SP-MAO,10 0 0 0,85 50 0 0 0 0 0,99 50 0 0 0 0 1,2 50 0 0 0,5Nd MAO,4.7 0,72 25 1,25 50 0,0015 0,0015 1,4 105 1,1 50 0,01078 0,00539 1,28 118 1,3 50 0,013090133 0,002618027
MAO,10 0,02 10 0,8 50 1,06667E-05 1,06667E-05 0,8 70 0,96 50 0,003584 0,001792 1,3 115 0,99 50 0,009867 0,0019734
SP-MAO,4.7 1,01 50 0,97 50 0,003265667 0,003265667 1 75 1 50 0,005 0,0025 1,3 105 1 50 0,0091 0,00182
25
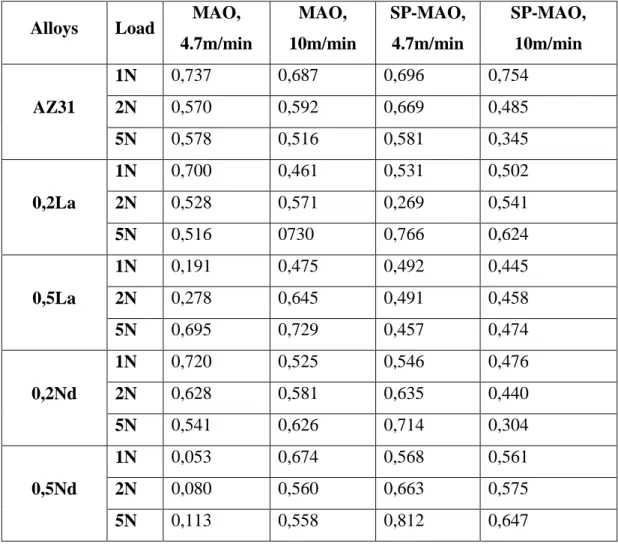
The average friction coefficient of investigated alloys is presented in Table 4.4.
Table 4.4. Average friction coefficient of investigated alloys.
Alloys Load MAO,
4.7m/min MAO, 10m/min SP-MAO, 4.7m/min SP-MAO, 10m/min AZ31 1N 0,737 0,687 0,696 0,754 2N 0,570 0,592 0,669 0,485 5N 0,578 0,516 0,581 0,345 0,2La 1N 0,700 0,461 0,531 0,502 2N 0,528 0,571 0,269 0,541 5N 0,516 0730 0,766 0,624 0,5La 1N 0,191 0,475 0,492 0,445 2N 0,278 0,645 0,491 0,458 5N 0,695 0,729 0,457 0,474 0,2Nd 1N 0,720 0,525 0,546 0,476 2N 0,628 0,581 0,635 0,440 5N 0,541 0,626 0,714 0,304 0,5Nd 1N 0,053 0,674 0,568 0,561 2N 0,080 0,560 0,663 0,575 5N 0,113 0,558 0,812 0,647
26
PART 5
DISCUSSION AND CONCLUSIONS
This section includes immersion corrosion and dry wear test results the graphs which extracted from the test results and analysis. Moreover, some parts contain micrographs to support the discussion.
5.1. IMMERSION CORROSION TEST
To check out the corrosion nature of studied alloys immersion corrosion test for 178 hours was applied. The initial microstructure and the shot peened-coated surface properties was investigated to describe the corrosion attacks which degrade the materials.
5.1.1. AZ31 Mg Alloys
Fig.5.1 displays the coating properties of MAO and SP-MAO applied materials. As seen that the surface roughness of MAO applied sample is more than the SP-MAO one. It can be said that the thickness of material is higher in the condition of the rough surface wherein the coating will show non-homogeneously distribution due to the additional substrates will be added on the island structure during MAO process. Moreover, Tang H. et. al. show that the thickness of coating and the surface roughness of MAO applied samples were increased together. They are found that higher voltage, which is maximum 500 V in their studies is similar with this study, give rise to more erupted molten oxides wherein the filling behavior of spaces of the oxides is brought about and results in enlarged film surface roughness [36].
27
Figure 5.1. The coating properties of investigated alloys.
Fig. 5.2 shows that the LOM image of SP-MAO applied AZ31 Mg alloy. It is can be seen finer grains occurred probably due to plastic deformation during shot peening process. Moreover, somewhere of the matrix have DRXs introduced all through the rolling process [37]. Furthermore, Fig. 5.3 illustrates that the SEM images of MAO and SP-MAO samples from their both surface and cross-sections. The surface morphology of SP-MAO sample including more island-structures and volcano-like structures than MAO applied one. Further, SP-MAO sample have bigger and more cracks between the island-structures. The pores were introduced by the molten oxide and gas bubbles discarded of MAO channels and the cracks were formed due to the thermal stresses during rapid solidification [38]. As seen Fig. 5. 3 the cross section of both samples was constituted by outer pores and inner barrier layer. However, compared with the MAO, the SP-MAO sample including more holes like canals that penetrates through of the center of surface.
28
Figure 5.2. LOM image of SP-MAO applied AZ31 Mg alloy.
It is obviously show that the SP changed the MAO coating properties as surface morphology. The surface defects such as macro pores and cracks were unwanted properties which deteriorate of the corrosion behavior of Mg alloys. As seen Fig. 5.3 average pore sizes were calculated by ImageJ software 1,32 µm and 1,476 µm for MAO and SP-MAO samples, respectively. Furthermore, MAO applied sample obtains whiter colored particles especially distributed between island-structures or on them. As seen the Fig.5 the particles including Mg, O and Si or P rich elements.
29
Figure 5.3. SEM images of MAO and SP-MAO samples from their both surface and cross-sections and average pore size and filled area of them on the surfaces.
Fig. 5.4 presents the XRD pattern of MAO applied sample. MAO applied sample demonstrates that the coating was constituted mainly by Mg, MgO and spinel MgAl2O4 phases, in consonance with the alloy composition and the electrolyte. The
30
existence of the tops of mg was scrutinized, due to the impression from the substrate of AZ31 alloy [39]. Intensity of peaks corresponding to MgO phase increased with increasing concentration of Na3PO4 in the reference electrolyte, while peak intensities of MgAl2O4, α-Mg and β-Mg17Al12 phases decreased conversely. Hence, darkening of the MAO coatings fabricated in Na3PO4 containing electrolytes (Fig. 5. 3) is suggested to be the result of the presence of phosphate containing phase in the MAO coatings.
Figure 5.4. XRD pattern of MAO applied sample.
As stated in the obtained data of the XRD analyses (Fig. 5. 4), Al embellished exterior floors of the MAO coatings are gorgeous in spinel MgAl2O4 (which is very hard (about 16 GPa) within the coating), while its Mg gorgeous internal layer is prevailed by MgO. On account of, more extraordinary MgO peaks arose on the XRD spectra (howbeit concentration of MgAl2O4 peaks were weaken) of the MAO coating fabricated in Na3PO4 containing electrolytes (Fig. 5. 3a). It is well ratified that MAO of Mg alloys kickoffs with the MgO evolution by the agency of outward migration of
31
Mg2+ ions from the substrate (AZ31 Mg alloy in this study), which then react with OH− ions at the metal/electrolyte interface.
As seen Fig. 5. 5, EDS analyses carried out on the surface of MAO applied sample revealed that Mg and O as the main elements as well as Pa Nd Zn and small amounts of Si, Al and K.
Figure 5.5. EDS analysis carried out on the surface of MAO applied sample.
Fig. 5. 6 shows that the corrosion rates of investigated alloys as a Mg loss of unit area versus immersion time of hours in 3.5 wt.% NaCl solution for 168 hours. In the first 24 hours, the metal losses of investigated alloys are approximately similar, however, MAO have less metal loss than SP-MAO. Uncoated AZ31 Mg sheet was immersed for 24 hours showed that 18 mg/cm2 metal loss was reported at our previous study [40]. As seen Fig. 5. 6 the MAO coating is developed the corrosion resistance three times more of AZ31. After 24 hours the metal loss is increasing due to the coating is deteriorated by corrosion attacks wherein the micro-pores and cracks effects the rate
32
of corrosion as reported by other studies discussed the more sized pores and cracks formation during MAO is important for corrosion speed [41]. Moreover, the port density and size can be evaluated as different subject which determining the corrosion rate of the coating. Higher pore density imparts more electrolytes to penetrate inside of the layer wherein the corrosion attack more degrading. However, if the diameter size of pore is obtained by larger, the corrosion rate will be decreased with the effects of them like corrosion barrier roles. Furthermore, the thickness of the coating gives rise to better corrosion resistance in the case of higher values [3]. Furthermore, the corrosion rate of both samples has increasing slope till 144 hours, however after this time the slope of corrosion rate is decreasing because Mg [OH]2 layer is coating the surface as seen of AZ31 Mg corrosion mechanism. The passive behavior of Mg alloys can be altered by different local pH valued areas wherein the passive film was occurred that making a role as a corrosion barrier. However, chloride environment could be serious attacker for corrosion barriers that resulting pitting corrosion is strongly introduced by surface roughness properties of material. Surface roughness is said that can be detrimental for corrosion resistance because the passivation tendency was interrupted by increased Ra and therefore the alloy more perceptible for pitting corrosion. Nevertheless, the disordered passivity of the alloy imparts lower susceptible pitting corrosion because of the Ra. Our study is appropriate for second one condition of disordered passivity wherein discouraged pitting corrosion impart higher corrosion resistance to MAO applied sample. As reported for Mg alloys, it does not show that urgently formed passive films on the surface wherein the passivity behavior of corrosion is different from aluminum or steel presenting speedily occurred passive films which recovering the corrosion rate immediately. If the surface roughness of Al or steel has high values, pitting corrosion will be finding more site for nucleation. However, the smooth surface give rise to fewer places for pitting corrosion. Further, the passive film ability of the smooth material is better than rougher one that contributing to enhancing of corrosion resistance. On the other hand, Mg does not show quickly formed passive films like Al or steel that changing of surface roughness relationship with the corrosion behavior wherein observed opposite result like the smoother surface are displaying higher corrosion rate due to the passive films does not introduce swiftly [42]. It can be said that the passivity behavior of the MAO coating was changed with the changing of surface roughness wherein it seems like the more
33
Ra, the less corrosion resistance due to altering of the passivity of MgO or MgAl2O4 on the surface.
Figure 5.6. Corrosion rates of investigated alloys.
Further, as can be seen from Fig. 5.7 as a result of corrosion attack, surface of the MAO and SP-MAO samples start heavily deteriorated even after 48 hours of immersion. Longer immersion times imposed rough and hollow pit containing surface topography. Surface degradation of the MAO sample was almost small as compared to the SP - MAO sample, if the corrosion pathways appeared on the surface were ignored. Corrosion pathways tended to progress and cover wider surface area at longer immersion durations. On the surfaces of the both samples, indications of corrosion attack were not clearly identified with the exceptions of very fine pits detected mostly at the edges of the samples immersed for 168 hours. Whereas the MAO coating undergoes some severe localized corrosion on its surface (see Fig. 5. 7), indicating that the MAO coating reduces the corrosion of the AZ31 Mg alloy.
34
Figure 5.7. The surface morphology after corrosion test.
After corrosion test, SEM examination of corroded surfaces show that the intergranular corrosion mechanism was introduced on the MAO applied sample surface. On the other hand, as seen Fig. 5. 8 the pitting corrosion also was placed on the SP-MAO applied sample.
35
Figure 5.8. The surface SEM images after corrosion test.
After corrosion test, the surface of the corroded surface of both samples includes MgO and C, O and Mg rich areas as seen Fig. 5. 9. Especially the C is more active for find a place in the boundary sections where probably Mg5 [CO3]4[OH] 2.5H2O carbonate product was occurred in the atmospheric condition exposed more carbon on there. It is reported that the mechanism of Mg alloys in the NaCl solution is as following:
𝑀𝑔 [𝑠] → 𝑀𝑔2+[𝑎𝑞] + 2𝑒− (5.1)
2𝐻2𝑂 + 2𝑒− → 𝐻
36 2𝐻3𝑂+[𝑎𝑞] + 2𝑒− → 𝐻
2[𝑔] + 𝐻2𝑂 (5.3)
𝑀𝑔2+[𝑎𝑞] + 2𝑂𝐻−[𝑎𝑞] → 𝑀𝑔[𝑂𝐻]
2 [𝑠] (5.4)
In the present of 𝐶𝑂2−, 𝑀𝑔[𝑂𝐻]2 [𝑠] is converted to magnesium carbonate:
5𝑀𝑔[𝑂𝐻]2 [𝑠] + 4𝐻𝐶𝑂3− + 𝐻2𝑂 ⇌ 𝑀𝑔5[𝐶𝑂3]4[𝑂𝐻2].5𝐻2𝑂 [𝑠] + 4𝑂𝐻− (5.5)
37
The magnesium carbonates are formed as a protective film on the surface that much thicker and more passive than other films such as MgO wherein the corrosion attacks are blocked with them [43]. As seen in Fig. 5. 9, the MAO applied sample consists of higher content of C on the marked as 1 and 2 points. It may be the eliminating factor for corrosion rate therefore the MAO sample lower corroded than SP-MAO one.
5.1.2. AZ31-La Mg Alloys
As shown in Figure 5.10, the base metal of AZ31-0,5La alloys rolled at 4.7 m/min has twins dominated microstructure and bigger sized secondary phases shaped as globular, although the specimen of rolled at 10 m/min speed includes dynamic recrystallization grains also finer secondary phases distributed mostly on grain boundaries as continuously.
Figure 5.10. SEM images of base metals rolled at 4,7 and 10 m/min.
As shown in Figure 5.11, surface morphology and cross-sectional images of the samples after MAO treatment is different. However, typical coating properties of the MAO process are obtained, for example, from islets of different sizes and micropores of different diameters formed on these islets. Melting and rapid solidification during MAO ensure that the pores are circular. At a rolling speed of 4.7 m / min, the extruded sample has micro-pores with a smaller diameter, however, is denser in the islets. However, it is seen that the rolled material at 10 m / min has larger pores with larger diameters, but they are distributed less on the islets.
38
4,7 SP-MAO 10 SP-MAO
Figure 5.11. SEM images of surface and cross-section of materials at rolled different speeds.
The images taken from the section show us that the rolled material at a velocity of 4.7 m / min is coated non-uniformly, but the coating is more uniform at a speed of 10 m / min. The XRD results of the rolled material at a rolling speed of 4.7 m / min coated with MAO are given in Figure 5.12. It is seen that the coating contains MgO and MgAl2O4 phases.
39
5.1.2.1. Surface Smoothness
As can be seen from Figure 5. 13, the surface images of the samples after coating are similar. However, surface smoothness was found to be lower in the rolled material at a rolling speed of 10 m / min.
4.7 SP-MAO 10 SP-MAO
3,46 2,32
Figure 5.13. Surface properties of the materials examined.
5.1.2.2. Corrosion Test
Immersion test results is shown in Figure 5. 14, the corrosion rate of the rolled material at the rolling speed of 10 m / min to the first 40 hours is faster than that of 4.7 m / min, but after 40 hours, the corrosion rate increased more in the 4.7m / min sample. The corrosion rate of the first 40 hours is under the influence of the coating. However, the corrosion rate was influenced by the properties of the base material in the following hours. -20,0 0,0 20,0 0,0 1,0 2,0 -20,0 0,0 20,0 0,0 1,0 2,0
40
Figure 5.14. Corrosion rates of samples that were corroded for 168 hours in 3.5% NaCl.
The relationship between corrosion rate and MAO coating is determined by the diameter and number of pores the coating has. The more or the larger the diameter, the faster the corrosion tendency. It is believed that the large diameter pores of the rolled material at a speed of 10 m / min cause a high corrosion rate in the first 40 hours. However, it is known that the rolled materials at high speeds contain fewer twins and more recrystallized grains. It is known that twinning adversely affects the corrosion resistance due to the different stress zones they have. However, the fact that the recrystallized grains contain more grain boundaries and less dislocation density contributes to corrosion resistance [35]. The reason why corrosion resistance is weaker after 40 hours in the material with the parameter 4.7 m / min may be attributed to this.
5.1.2.3. After Corrosion
After the corrosion test, pictures and SEM images were taken from the surfaces of the materials and given in Figure 5. 15. As it can be seen from both the macro pictures and the SEM images, it is understood that the rolled material with a rolling speed of 4.7 m / min has deeper and wider corrosion pits.
As can be seen from Figure 5. 16, Mg, O and Al elements remain in the coating material. However, as it progresses towards the base material, Mg becomes more
41
dominant and O and Al lose the minus. During corrosion, oxidation occurs on the surface of the material and forms a compound with Al and Mg.
4.7 SP-MAO 10 SP-MAO
Figure 5.15. SEM investigations after the corrosion test.
4.7 SP-MAO
![Figure 2.1. a) Mg unit cell, b) basal plane, c) prismatic plane, d) pyramidal and e) the second order pyramidal plane [10]](https://thumb-eu.123doks.com/thumbv2/9libnet/5399406.101975/20.892.251.711.126.497/figure-prismatic-plane-pyramidal-second-order-pyramidal-plane.webp)
![Figure 2.4. SEM Image of abrasive wear [23].](https://thumb-eu.123doks.com/thumbv2/9libnet/5399406.101975/25.892.271.686.770.1062/figure-sem-image-abrasive-wear.webp)
![Figure 2.5. SEM Image of oxidation wear [23].](https://thumb-eu.123doks.com/thumbv2/9libnet/5399406.101975/26.892.254.700.309.626/figure-sem-image-oxidation-wear.webp)
![Figure 2.7. SEM images of MAO applied Mg alloys a and b of surfaces and c and d of cross sections [27]](https://thumb-eu.123doks.com/thumbv2/9libnet/5399406.101975/28.892.170.788.528.991/figure-sem-images-applied-alloys-surfaces-cross-sections.webp)
![Figure 2.8. SEM images after wear test of MAO applied Mg alloys [27].](https://thumb-eu.123doks.com/thumbv2/9libnet/5399406.101975/30.892.172.783.125.354/figure-sem-images-wear-test-mao-applied-alloys.webp)