INTERNATİONAL JOURNAL OF AGRİCULTURE &BİOLOGY
ISSN Print: 1560–8530; ISSN Online: 1814–9596 09–376/AWB/2010/12–2–227–230
http://www.fspublishers.org
Full Length Article
To cite this paper: Karadavut, U., Ç. Palta, K. Kökten and A. Bakoğlu, 2010. Comparative study on some non-linear growth models for describing leaf growth of maize. Int. J. Agric. Biol., 12: 227–230
Comparative Study on Some Non-linear Growth Models for
Describing Leaf Growth of Maize
UFUK KARADAVUT1,ÇETIN PALTA†,KAĞAN KÖKTEN AND ADIL BAKOĞLU‡
University of Bingöl, Agricultural Faculty, P.K. 19, Bingöl, Turkey
†Konya Soil and Water Sources Research Institute, P.K. 48, Konya, Turkey ‡University of Bingöl, Bingöl High School, P.K. 19, Bingöl, Turkey
1Corresponding author’s e-mail: [email protected]
ABSTRACT
This research was carried out on five maize cultivars (Monton, Ranchero, Progen 1550, 35 P 12 & TTM 81-19) to explain the fitting performance of some nonlinear models (Richards Model, Logistic Model, Weibull Model, MMF Model & Gompertz Model) to leaf data. For model fitting performance, we used four comparison criteria; coefficient of determination ( 2
R ), sum squares error (SSE), root mean squares error (RMSE) and mean relative error (MRE). The results indicated that Richards, Logistic and Gompertz models are more useful than other non-linear models to estimate leaf growth of maize. © 2010 Friends Science Publishers
Key Words: Comparison; Growth models; Maize cultivar; Leaf INTRODUCTION
Leaf area production is crucial for energy transfer, mass accumulation processing, light interception, transpiration and photosynthesis in crop canopy (Ma et al., 1992). Neighboring plants generally compete for the limiting resources in order to grow and reproduce. Some resources e.g., sun light, may be monopolized by the larger plants and this may lead to asymmetric competition where a plant, which is twice as large, grows more than twice as fast. A previously published individual-based Richards growth model that describes the asymmetric growth of individual plants is here generalized with respect to a variable mean plant density and an explicit spatial setting (Damgaard, 2004). The capacity of the crop to intercept photosynthetically active radiation and synthesize carbohydrates for growth is a nonlinear function of Leaf Area Index. Several approaches have been taken in analyzing and predicting leaf area development for physiological, agro-meteorological experiments and remote sensing applications (Dwyer & Stewart, 1986). In a number of studies, leaf area development is described as a function of air temperature. Temperature affects numerous physiological processes in plants.
Crop growth models have been used increasingly in research and management and their performance is strongly influenced by the accuracy of the leaf area predictions (Khamis et al., 2005). Many nonlinear theoretical models (e.g., the logistic, the Gompertz, the Bertalanffy-Richards & the Schnute models) rather than empirical models (e.g.,
polynomial model) have been used to model plant growth, dry matter accumulation and yield (Lei & Zhang, 2004; Karadavut & Tozluca, 2005; Karadavut & Kayiş, 2006; Prasad et al., 2008). In this regard, Keating and Wafula (1992), modeling of the fully expanded area of maize leaves explained that bell-shaped functions were successfully fitted to independent area-per-leaf data from plants. The bell-shaped curve with parameters, linked to total leaf number, was a simple and flexible model of the potential area of individual leaves in maize.
Dwyer and Stewart (1986) estimated maize leaf area over six growing seasons. They also estimated maize leaf area for two independent years at the same location. Nelder (1961) explained that general models by using S-shaped logistic for developing leaf area growth of plants. Some researchers analyzed leaf development and separated into its components by processing leaf emergence and leaf expansion (Dennet et al., 1978; Sinclair, 1984). Use of a mathematical equation to estimate leaf area as a function of plant parameters that can be more easily measured should be a feasible alternative to direct measurement of leaf area (Ma et al., 1992). Some researchers indicated mathematical relationships between leaf parameters and leaf area for several plants (Ramos et al., 1983; Sharrett & Baker, 1985; Dwyer et al., 1986; Lieth et al., 1986).
Leaf growth is considered the most important single determinant of dry matter accumulation. Khamis and Ismail (2004) compared the fitting performance of the non-linear growth models to the tobacco leaf data. Fourteen models were tested to fit leaf growth. They found that Weibull,
KARADAVUT et al. / Int. J. Agric. Biol., Vol. 12, No. 2, 2010
228
Richards, Invers power, Transformation and Simple logistic models significantly outperform compared to the other growth models. Bilgin and Esenbuga (2003) concluded the parameters of nonlinear models for the context of the system.
The objective of this study is (i) to compare the fitting performance of the non-linear growth model for the maize leaf data, (ii) to select the best model fitting on several selection criteria.
MATERIALS AND METHODS
This research was carried out in 2003-2004 growing season in Konya, Turkey. Five maize (Zea mays L.) cultivars (Monton, Ranchero, Progen 1550, 35 P 12 & TTM 81-19) were tested in a completely randomized block design with four replications. Each plot was 3.0 m * 5.0 m = 15 m2.
Planting distance was 0.75 m between rows and 0.25 m between plants and a plant population was 53 333 plants ha -1. Four-row plots were used for data collection for all other
traits. At planting P2O5 in the form of single super
phosphate was applied at 80 kg/ha each; N was applied at 150 kg ha-1 in the form of urea. N fertilizer was applied in
two equal splits; 75 kg N ha-1 at planting and the other half
10 weeks after planting. Weed control were practiced two times by hand when plants reached to 15-20 and 35-40 cm. The data were recorded every week. For each measurement, 5 leaves were randomly selected. Average temperature was 18.2 and 17.7oC, rainfall and humidity were 15.6, 20.0 mm
and 50.2, 49.1%, in 2003 and 2004, respectively in growing season of maize. Soils of research area had clay-loam texture, pH: 8.2, cancerously and slightly salt. Also soils had low organic matter (1.04%) and lime levels (7.4%) but high K (1.812 ppm) and P (27.1 ppm).
In this study, we used five nonlinear models, as given below (Draper & Smith, 1998):
a) Richards Model β
α
κ 1/δ)
1
(
xe
Y
−+
=
b) Logistic Model xe
Y
κβ
α
−+
=
1
c) Weibull Modelα
β
κxδe
Y
=
−
− d) MMF Model δ δβ
κ
αβ
x
x
Y
+
+
=
e) Gompertz Model e xe
Y
=
α
−β−κWhere,
α
;thevalueofasymptote,β
; value of plants growth beginning stage,κ
; net growth ratio,δ
; parameterat inflexion point. For comparison of model fitting, we used the four comparison criteria. These criteria are given below:
a) Coefficient of Determination (
R
2)∑
∑
= − = − − − = n i i i n i i i Y Y Y Y R 1 2 1 2 ^ 2 ) ( ) ( 1b) Sum Squares Error (SSE)
∑
= − = n i i i Y Y SSE 1 2 ^ ) (
c) Root Mean Squares Error (RMSE)
n Y Y n i i i
∑
= − = 1 2 ^ ) ( RMSEd) Mean Relative Error (MRE)
⎟ ⎟ ⎟ ⎟ ⎠ ⎞ ⎜ ⎜ ⎜ ⎜ ⎝ ⎛ − − =
∑
= ) ( | | 1 min max 1 ^ Y Y Y Y n MRE n i i iWhere, Yi; observed value, Y^i ;predicted value, n;
number of observation, Ymax; maximum value of observation,
Y
min; minimum value of observation and Y− ; mean value of observation.RESULTS AND DISCUSSION
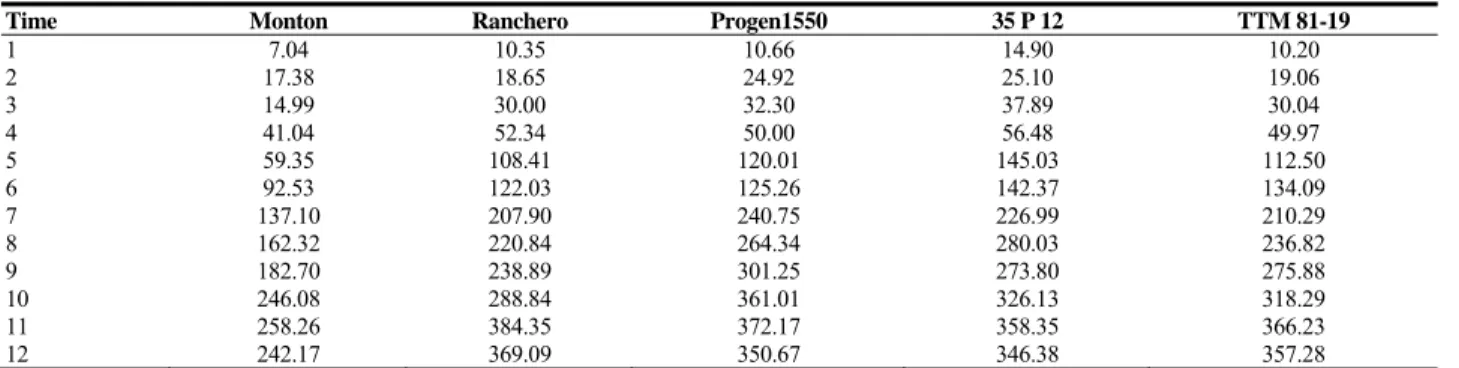
Measured leaf area is shown in Table I. Leaf area ranged from 384.35 cm2 (Ranchero) to 258.26 cm2
(Monton). Growth of leaf area revealed nearly S shaped. A board range of genotypes revealed a close relationship between leaf area and growing season. The increased variation was due to a change in leaf characteristics with ontogeny and possibly by the normal tendency for the variance of variable to increase in proportion to the mean of the variable (Ma et al., 1992). Preliminary analyses of individual leaf area data suggested that maximum plant leaf area was strongly correlated with mature leaf area of the largest leaf per plant (r=0.97). These results agree with Dwyer and Stewart (1986).
Parameters for every model of leaf growth have been shown in Table II. Richards’s model generally gave a reasonable fit. The R2
, SSE, RMSE and MRE were evaluated
every model. All models are significantly fitted the maize data, except for Weibull model.
The best fitted model based on comparison criteria (SSE & RMSE) could be ranked as follow; Richards, Logistic, MMF and Gompertz growth models. From the value of MRE, Logistic model generally performed significantly better than other models. But Richards and Gompertz growth models had less MRE values than other models. We investigated the correlation matrices of parameters. If the correlation occurred among model parameters, this model might not be recommended for maize growth data (Ratkowsky, 1983; Gallant, 1987; Ratkowsky, 1990; Draper & Smith 1998). Weibull and
NON-LINEAR GROWTH MODELS FOR MAIZE LEAF / Int. J. Agric. Biol., Vol. 12, No. 2, 2010
229
MMF growth models gave the highest value of correlation coefficient. There were strong correlations between α and
β parameters in Weibull (r=0.901) and MMF (r=0.976) and there were also strong correlations between β and δ (r=0.912 and r=0.896, respectively). Correlation among parameters was non-significant in the other models. Thus we cannot suggest that these models were not suitable for data of leaf area growth in maize. Khamis and Ismail (2004) did not recommend Gompertz model 3, Stannard and Exponential logistic models for tobacco growth data because of the highest value of correlation coefficient. Cultivars exhibited disparate morphology and growth habit. Therefore cultivar models differed only slightly from one another (Ma et al., 1992).
Richards model explained growth of cultivars higher than other models, while Wei bull model explained less than others. We considered value of 2
R as a tool to make
comparative studies for cultivars. 2
R Values of cultivars are
found between 0.88 and 0.99, while Monton cultivar was explained higher than other cultivars, 35 P 12 cultivar was explained less than others. The best fitted model for cultivars based on comparison criteria (SSE & RMSE) can be ranked as follow; Monton, TTM 81-19, Ranchero and 35 P 12. MRE of Monton was lesser than other cultivars in all growth models. These results are supported by results of Birch (1999).
The non-linear investigation of the growth process has not only advantages in mathematically explaining growth but also estimating the relationship among plant organs. Furthermore, non-linear estimation techniques may contribute to determination of the economic information in plant growth mechanism.
Mathematical relationships between length, width and area of maize leaf blades can serve as a basis for direct leaf Table I. Leaf variation of maize cultivars evaluated with different time (cm2)
Time Monton Ranchero Progen1550 35 P 12 TTM 81-19
1 7.04 10.35 10.66 14.90 10.20 2 17.38 18.65 24.92 25.10 19.06 3 14.99 30.00 32.30 37.89 30.04 4 41.04 52.34 50.00 56.48 49.97 5 59.35 108.41 120.01 145.03 112.50 6 92.53 122.03 125.26 142.37 134.09 7 137.10 207.90 240.75 226.99 210.29 8 162.32 220.84 264.34 280.03 236.82 9 182.70 238.89 301.25 273.80 275.88 10 246.08 288.84 361.01 326.13 318.29 11 258.26 384.35 372.17 358.35 366.23 12 242.17 369.09 350.67 346.38 357.28
Table II. Parameters estimation of five models for leaf growth
Models Maize cultivar Comparison criteria
2
R
SSE RMSE MREδ κ β
α
/ 1)
1
(
xe
Y
−+
=
Monton 0.99 0.0076 0.00685 0.00015 Ranchero 0.98 0.0082 0.00726 0.00017 Progen1550 0.96 0.0095 0.00803 0.00017 35 P 12 0.95 0.0112 0.00872 0.00021 TTM 81-19 0.99 0.0077 0.00670 0.00015 xe
Y
κβ
α
−+
=
1
Monton 0.98 0.0097 0.00074 0.00561 Ranchero 0.98 0.0097 0.00074 0.00564 Progen1550 0.97 0.0114 0.00086 0.00612 35 P 12 0.95 0.0129 0.00114 0.00698 TTM 81-19 0.97 0.0114 0.00087 0.00614 δ κβ
α
xe
Y
=
−
− Monton 0.93 1.0231 0.07641 0.00035 Ranchero 0.89 1.2564 0.09122 0.00047 Progen1550 0.90 1.1984 0.08620 0.00038 35 P 12 0.88 1.2678 0.09755 0.00051 TTM 81-19 0.91 1.1445 0.08667 0.00038 δ δβ
κ
αβ
x
x
Y
+
+
=
Monton 0.98 0.0149 0.00603 0.00231 Ranchero 0.96 0.0165 0.00712 0.00285 Progen1550 0.98 0.0150 0.00602 0.00233 35 P 12 0.95 0.0201 0.00964 0.00342 TTM 81-19 0.96 0.0163 0.00731 0.00291 x ee
Y
=
α
− β−κ Monton 0.98 0.0324 0.01240 0.00186 Ranchero 0.96 0.0382 0.01538 0.00203 Progen1550 0.96 0.0382 0.01557 0.00201 35 P 12 0.95 0.0403 0.02063 0.00224 TTM 81-19 0.97 0.0356 0.01481 0.00192KARADAVUT et al. / Int. J. Agric. Biol., Vol. 12, No. 2, 2010
230
area estimation. The leaf area of a crop is a determinant factor in mechanismssuch as radiation interception and water and energy exchange. Therefore, accurate measurements of LAI are essential to understand the interaction between crop growth and environment (Jesus et al., 2001).
The Richards, Logistic and Gompertz functions proved their robustness byadequately describing a wide range of combinations of cultivars and environments. Cultivars varied in maturity, environmental adaptation and growth vigor. Environments included N-limited, moisture-limited and favorable growing conditions. The leafarea of the largest leaf was associated with these growth restrictions and variation in photoperiod and temperature during the photoperiod-sensitive phase of the maize plant led to variation in total leaf number within cultivars (Elings, 2000). Parameter a (asymptote of the curve) was smaller (narrower) for late-maturing cultivar (TTM 8119) than for early-maturing cultivar (Ranchero), but it was not related to growing conditions. The results could be applied to individual genotype–environment combinations and to all experiments at one location, but also proved capable of describing all data jointly with one parameter set. Prediction on the basis of observations on at least five plants is sufficiently accurate.
Mathematical models to describe maize leaf area are important components of computer simulation of maize growth and development. The objective of this research was to develop a mechanistic model to describe maize leaf growth. The hypothesiswas that single leaf growth rate is the difference between potential positive leaf growth and reduced leaf growth rate because assimilates are also being utilized for stem, roots, other leaves and reproductive organ growth (Yang & Alley, 2005). Behavior of the growth curves can change according to living organisms, the phenotype to be studied and environment to which it is exposed. To evaluate growth data properly, it is required to select a suitable growth curve and its parameters should be able to be interpreted biologically (Karadavut et al., 2008).
The largest leaf in the experiments was usually one of the three leaves below the ear leaf, or the ear leaf itself. As a general rule it can be assumedthat the leaf with the greatest length is also the one withthe greatest area. Measurement of the largest area of the mature leaf could be done during grain filling but before the beginningof senescence, which through shriveling influences the leaf blade area. Establishment of maximum plant leaf area requires the total number of leaves, which can be counted reliably if leaf numbers 5 and if necessary 10 are marked early in the season so that lower leaves are accounted for beforethey senesce and are lost (Elings, 2000).
In conclusion, Richards, Logistic and Gompertz models were found to be the most suitable models to fit with maize leaf growth data in this study. Weibull and MMF models are suitable but parameter estimate are highly correlated. Thus these models do not offer the best solution for maize leaf growth.
REFERENCES
Bilgin, O.C. and N. Esenbuga, 2003. Parameter estimation in non-linear growth models. Anim. Prod., 44: 81–90
Birch, C.P.D., 1999. A new generalized logistic sigmoid growth equation compared with the Richards growth equation. Annl. Bot., 83: 713– 723
Damgaard, C., 2004. Modelling individual plant growth at a variable mean density or at a specific spatial setting. Comptes Rendus Biologies, 327: 255–260
Dennet, M.D., J.R. Milford and J. Elston, 1978. The effect of temperature on the relative leaf growth rate of crops of Vicia faba L. Agric.
Meteorol., 19: 505–514
Draper, N.R. and H. Smith, 1998. Applied Regression Analysis. John Wiley and Sons, New York
Dwyer, L.M. and D.W. Stewart, 1986. Leaf area development in field grown maize. Agron. J., 78: 334–343
Elings, A., 2000. Estimation of leaf area in Tropical maize. Agron. J., 92: 436–444
Gallant, A.R., 1987. Non-linear Statistical Models. John Wiley and Sons, New York
Jesus, W.C., F.X.R. Do Vale, R.R. Coelho and L.C.C. Costa, 2001. Comparison of two methods for estimating leaf area index on Common bean. Agron. J., 93: 989–991
Karadavut, U. and A. Tozluca, 2005. Growth analysis some characters in rye plants (Secale cereale L.) Growth of root and upper ground parts.
J. Crop Res., 2: 1–10
Karadavut, U. and S.A. Kayiş, 2006. A growth curve application to compare weights of five wheat varieties. J. Agric. Fac. Univerity
Selçuk, 40: 107–110
Karadavut, U., S.A. Kayiş, Ç. Palta and O.Okur, 2008. A Growth Curve Application to Compare Plant Heights and Dry Weights of Some Wheat Varieties. American-Eurasian J. Agric. Environ. Sci., 3: 888– 892
Keating, B.A. and B.M. Wafula, 1992. Modeling the fully expanded area of maize leaves. Field Crops Res., 29: 163–176
Khamis, A. and Z. Ismail, 2004. Comparative study on non-linear growth model to tobacco leaf growth data. J. Agron., 3: 147–153
Khamis, A., I. Zuhaimy, H. Khalid and T.M. Ahmad, 2005. Non-linear growth models for modeling oil Palm yield growth. J. Math. Stat., 1: 225–233
Lei, Y.C. and S.Y. Zhang, 2004. Features and Partial Derivatives of Bertalanffy-Richards Growth Model in Forestry. Non-linear
Analysis: Model. Cont., 9: 65–73
Lieth, J.H., J.P. Reynolds and H.H. Rogers, 1986. Estimation of leaf area of soybeans grown under elevated carbon dioxide levels. Field Crops
Res., 13: 193–203
Ma, L., F.P. Gardner and A. Selamet, 1992. Estimation of leaf area from leaf and total mass measurements in Peanut. Crop Sci., 32: 467–471 Nelder, J.A., 1961. The fitting of a generalization of the logistic curve.
Biometrics, 17: 89–110
Prasad, T.V.R., K. Krishnamurthy and C. Kailasam, 2008. Functional crop and cob growth models of maize (Zea mays L.) cultivars. J. Agron.
Crop Sci., 194: 208–212
Ramos, J.M., L.F. Garcia Del Moral and L. Reclade, 1983. Dry matter and leaf area relationships in winter barley. Agron. J., 75: 308–310 Ratkowsky, D.A., 1983. Non-linear Regression Modeling. Marcel Dekker,
New York
Ratkowsky, D.A., 1990. Handbook of Non-linear Regression Modeling. Marcel Dekker, New York
Sharrett, B.S. and D.G. Baker, 1985. Alfalfa leaf area as a function of dry matter. Crop Sci., 26: 1040–1042
Sinclair, T.R., 1984. Leaf area development in field grown soybeans. Agron.
J., 76: 141–146
Yang, J. and M. Alley, 2005. A Mechanistic Model for Describing Corn Plant Leaf Area Distribution. Agron. J., 97: 41–48