U. Ü. ZİRAAT FAKÜLTESİ DERGİSİ, 2010, Cilt 24, Sayı 2, 1-9 (Journal of Agricultural Faculty of Uludag University)
Aerodynamic Performance of Some Wind Turbine
Rotor Models
Ali Vardar
1*, Nazmi İzli
1, Ferhat Kurtulmuş
11Uludag University, Faculty of Agriculture, Dept. of Agricultural Machinery, Bursa. *e-mail: [email protected]
Geliş Tarihi: 17.11.2009, Kabul Tarihi: 25.03.2010
Abstract: In this study, power coefficients of miniature wind turbine rotors produced by using NACA profiles were determined. To this end, an open system for wind turbine rotor model was established. In this test system power values of the wind that reach to each of the rotor form and tip speed ratios of each rotor form were indicated. With the help of these data, power coefficients of each rotor form were calculated. It was found that power coefficient values that were obtained in the study changed between 0,316 and 0,416. It was determined that 4-bladed rotors that were produced by using NACA 4415 and NACA 5317 profiles, having 0 degree twisting angle and approximately 10 degrees binding angle, had the highest ideal power coefficient values.
Key Words: Wind turbine, aerodynamic performance, rotor, power coefficient, tip speed ratio, angle of attack.
Bazı Rüzgâr Türbin Rotor Modellerinin
Aerodinamik Performansları
Özet: Bu çalışmada, NACA profilleri kullanılarak imal edilen minyatür rüzgar türbin rotorlarının güç katsayıları saptanmıştır. Bu amaçla rüzgar türbin rotor modeli testleri için açık bir sistem kurulmuştur. Bu test sisteminde her bir rotor formu üzerine gelen rüzgarın içinde barındırdığı güç değerleri ve her bir rotor formunun uç hız oranları ortaya konulmuştur. Bu veriler yardımıyla da her bir rotor formunun güç katsayıları hesaplanmıştır. Çalışmada elde edilen güç katsayısı değerlerinin 0,316 ile
0,416 arasında değiştiği görülmüştür.NACA 4415 ve NACA 5317 profilleri kullanılarak imal edilen,
0 derece burulma açısına sahip, yaklaşık 10 derece bağlama açısına sahip, 4 kanatlı rotorların en yüksek ideal güç katsayısı değerlerine sahip olduğu belirlenmiştir.
Anahtar Kelimeler: Rüzgâr türbini, aerodinamik performans, rotor, güç katsayısı, uç hız oranı, hücum açısı.
Introduction
Today a significant part of the world’s energy needs are provided by fossil fuels. However, the fossil fuels, whose harmful effects first come out as global warming and air pollution, give significant harms to the environment and human health. Excessive use of fossil fuels appears as one of the most important causes of climate changes. As a result of climate changes, the number of environmental catastrophes such as drought and flood dramatically increased in recent years (Asif and Muneer, 2007). As an alternative to fossil fuels, clean and renewable energy sources that we can define as environmentally friendly to eliminate all these negative effects, gradually gain importance (Kyoto, 1997). Wind energy is one of the most important renewable energy sources. Along with the establishment of large and powerful wind energy facilities, there was a significant increase in wind plants built power in recent years. While world wind plants total installed power was 47574 MW in 2005, this figure reached up to 59206 MW in 2006 January. These figures indicate that the power of wind plants 24,45% increased in the last one year (Ressiad, 2006). In addition, it is estimated that 5% of world’s energy needs will be met by wind energy until the year of 2020 (Herbest et al., 2007). Accordingly, it is necessary to allocate more sources for the improvement of wind energy and to carry out more R&D works.
The power of the wind can be transformed to useful power with the help of rotor and blades in wind turbines. To what extent the power of wind can be transformed into useful power can be expressed by “power coefficient”. It is not always possible to obtain the same power coefficient from each rotor and blade. Theoretically, the ratio of transforming of useful power of rotor and blades is maximum 16/27 (approximately 0.59) (Betz, 1926). This value is called “ideal power coefficient” and theoretically it is impossible to obtain a power coefficient higher than this value.
The purpose of this study is to determine power coefficient that rotor and blades which are produced by using some NACA profiles in wind turbine blades. In this scope, optimum Re number, angle of attack, sliding rate, lift and drag coefficients, maximum power values that can be obtained from wind, rotor tip speed ratio, the ratio of transformation of theoretical wind power into mile power, profile and tip losses were studied. In the study, Snack 2.0 computer software (Snack Software, 2001) was utilized for indicating lift and drag coefficients.
Materials and Methods
In this study, among the blade profiles that NACA recommend, NACA 0012, NACA 4412, NACA 4415 and NACA 5317 were selected as material. The experiments were performed at 5, 10 and 15 degrees angle of attack for each selected blade profile; by forming 2, 3 and 4-bladed rotor models. The experiments were carried out separately for each rotor model and with three repetitions.
rotor model numbers refer to rotor blade number. With number 1, 2-bladed rotor was defined, and 3 and 4 bladed rotors were indicated by 2 and 3 numbers, respectively.
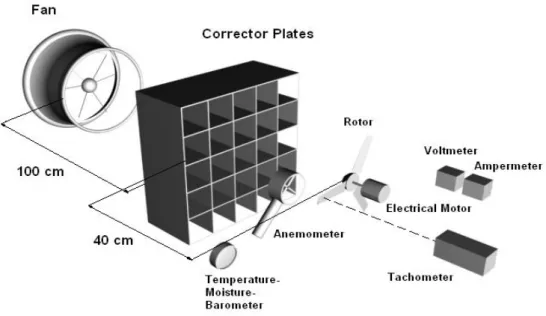
Experiment mechanism was formed in laboratory environment and under free room conditions. In the system, miniature rotor, electric motor and fan that provides air flow was located on the same axis. Among these there is a corrector plate which linearizates air flow of rotational character that is produced by the fan. In the system, electric motor that is connected to rotor produces electrical energy. The elements that form experiment mechanism and their locations are given in Figure 1.
Figure 1. Measurement Method
The air flow that is produced by the rotating of fan in the system, pass through corrector plates and reach to rotor; and barometric pressure, environmental humidity and temperature, rotor revolution, electrical current that is produced under 100 ohm of resistance and voltage can be measured.
The characters of the environment such as barometric pressure, temperature and humidity were measured by a measuring tool that can measure three variables. Two multimeters were used for electrical measurements. Rotor revolution was measured by a measurement device that works on the principle of optical sensing, in the kind of rpm.
The electrical motor used and its features are as follows (Figure 2): 0 200 400 600 800 1000 1200 1400 1600 372 750 1067 1395 1735 1925 2050 2194 23 9 5 2571 2750 30 08 323 7 3432 3666 384 3 4056
Motor Mil Devri (d/d)
E lekt ri ksel G ü ç ( m W )
Figure 2. Yield of electrical motor
Miniature, continuous, magnetic type motor,
Speed at 6V is 2520 rpm, at 9V is 3900 rpm and at 12V 4900 rpm Length 35 mm, diameter 32.7 mm, height 38.6 mm
Shaft diameter is 1.8 mm, shaft length is 8 mm
Electrical voltage, current and power values were found under constant 100 ohm of resistance with the help of multimeter. And the values in multimeters were noted in 5 minute periods. N A C A 0 012 N A C A 4 412 N A C A 4 415 N A C A 5 317 N A C A 2 301 2 N A C A 2 301 5
First rotor blade profile: NACA 0012 Second rotor blade profile: NACA 4412 Third rotor blade profile: NACA 4415 Fourth rotor blade profile: NACA 5317
In the study, power coefficients of 36 rotor models of different features were determined.
Rotor cross-section was calculated in the study and 0.07596 m2 was taken as a constant
value. Diameter of the rotor that was used in the study was 0.311 m. This value is constant for all values (Birnie, 2001).
Wind has a kinetic energy due to its speed. Due to this kinetic energy, there is a power value. This power value is the maximum power value that can be obtained from the wind and was calculated by the help of equation number 1 (Klug, 2001).
3 1
max
0
,
5
A
V
P
(1)Tip speed ratio, which also can be defined as rotor cyclical number, is the ratio of peripheral speed of a point at r (radius) distance from the hub of the rotor to the speed of the wind. Peripheral speed of a point that is at r (radius) distant from hub of the rotor is indicated by equation number 2 (Çetin et al., 2005; Özdamar and Kavas, 1999; Beer and Johnston, 1991; Yavuzcan, 1994).
30
.
. r
n
V
Ç
(2) Tip speed ratio is calculated by equation number 3 (Özdamar and Kavas, 1999;Yavuzcan, 1994; Fingersh and Carlin, 1998).
1
V
V
Ç
(3) It is not possible to fully transform theoretical power of wind into useful power, whichis mile power (Betz, 1926). There are losses during this transformation. In this situation, it is necessary to calculate the ratio of transforming theoretical wind power into mile power. These calculations were made with the help of equation number 4 (Beer and Johnston, 1991). uç profil PSchmitz P
C
C
(4) The values regarding vortex losses are given in Table 1.Table 1. CPschmitz values relative to [10].
5 6 7 8 9 10
Profile losses were calculated by using equation number 5 (Çetin et al., 2005; Özdamar and Kavas, 1999).
profil 1
(5) Sliding rate was calculated by the use of equation number 6 (Çetin et al., 2005;Özdamar and Kavas, 1999).
D K
C
C
(6) ε value changes according to blade profile. CK and CD values in Equation 6 wereobtained from Snack 2.0 program.
Taking speed values obtained in experiments as a base, these values were indicated in equation 7 (Piggott, 2000).
1
68500
Re
Chord
V
(7)Considering obtained Re value and utilized profiles, optimum CK/CD values and angle of attack () were detected by the help of Snack 2.0 computer program.
Tip losses were calculated by the help of equation 8 (Özdamar and Kavas, 1999).
.
84
,
1
1
B
uç
(8)Results and Discussion
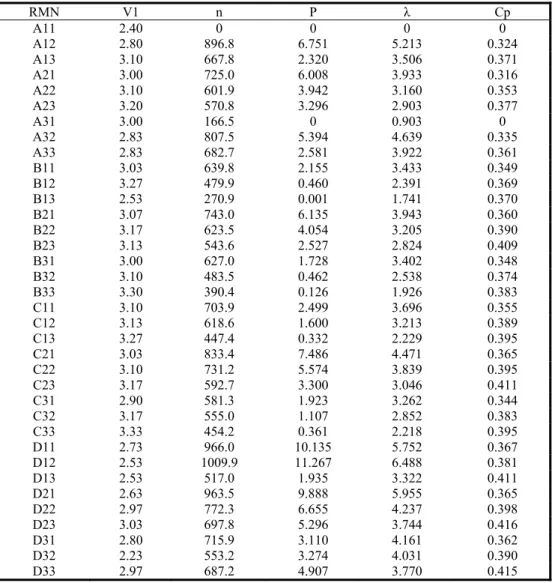
In this study, the results that are given in Table 2 were obtained. In Tables, revolution numbers, tip speed ratios and power coefficient of rotor models that were produced by the use of NACA 0012, 4412, 4415 and 5317 profiles. In first column of the tables, “Rotor Model Numbers” are given.
In this study it was found that the wind speed that reach over rotors changed between 2.40 and 3.30 ms-1; revolution number that is produced by the rotor changed between 161.0
and 1027.3 rpm; and the performance values that rotor produce under 100 ohm resistance changed between 0.001 and 11.686 mW. Here, rotor model D12 produced the highest performance value and highest revolution number. Power coefficient numbers that were obtained by operating rotor changed between 0.316 and 0.416. Here the highest value belongs to rotor model D23. In the study while minimum tip speed ratio value obtained from operating rotors belonged to rotor model A31 with 0.903; it was found that maximum tip speed ratio values belonged to rotor model D12 with 6.488.
rotors. And between rotor blade numbers, performance values produced by the rotors and rotor power coefficients, a correlation of 0.01 significance level was detected.
No statistical correlation was observed between binding angles of blades to rotor and rotor revolution numbers, rotor performance and rotor power coefficients.
In statistical analyses, a correlation of 0.01 significance level was found between revolution numbers that the rotors produce, rotor performances and rotor power coefficients. Again, between rotor performances and rotor power coefficients, a correlation of 0.01 significance level was found.
The features of best rotor models that are obtained at the end of this study are given in Table 2.
Table 2. At approximately 3 m s-1 wind speed test results for various rotor models.
RMN V1 n P λ Cp A11 2.40 0 0 0 0 A12 2.80 896.8 6.751 5.213 0.324 A13 3.10 667.8 2.320 3.506 0.371 A21 3.00 725.0 6.008 3.933 0.316 A22 3.10 601.9 3.942 3.160 0.353 A23 3.20 570.8 3.296 2.903 0.377 A31 3.00 166.5 0 0.903 0 A32 2.83 807.5 5.394 4.639 0.335 A33 2.83 682.7 2.581 3.922 0.361 B11 3.03 639.8 2.155 3.433 0.349 B12 3.27 479.9 0.460 2.391 0.369 B13 2.53 270.9 0.001 1.741 0.370 B21 3.07 743.0 6.135 3.943 0.360 B22 3.17 623.5 4.054 3.205 0.390 B23 3.13 543.6 2.527 2.824 0.409 B31 3.00 627.0 1.728 3.402 0.348 B32 3.10 483.5 0.462 2.538 0.374 B33 3.30 390.4 0.126 1.926 0.383 C11 3.10 703.9 2.499 3.696 0.355 C12 3.13 618.6 1.600 3.213 0.389 C13 3.27 447.4 0.332 2.229 0.395 C21 3.03 833.4 7.486 4.471 0.365 C22 3.10 731.2 5.574 3.839 0.395 C23 3.17 592.7 3.300 3.046 0.411 C31 2.90 581.3 1.923 3.262 0.344 C32 3.17 555.0 1.107 2.852 0.383 C33 3.33 454.2 0.361 2.218 0.395 D11 2.73 966.0 10.135 5.752 0.367 D12 2.53 1009.9 11.267 6.488 0.381 D13 2.53 517.0 1.935 3.322 0.411 D21 2.63 963.5 9.888 5.955 0.365 D22 2.97 772.3 6.655 4.237 0.398 D23 3.03 697.8 5.296 3.744 0.416 D31 2.80 715.9 3.110 4.161 0.362 D32 2.23 553.2 3.274 4.031 0.390 D33 2.97 687.2 4.907 3.770 0.415
Conclusions
According to results that are obtained in this study, the rotors whose power coefficient is higher than 0,40 value were determined as most efficient rotors. The rotors which possess this feature are C23, D13, D23 and D33 model number rotors. When common features of these model numbers are analyzed, it is found that they are 4-bladed rotors with 0 degrees of twisting angle, approximately 10 degrees of binding angle. C and D codes represent NACA 4415 and NACA 5317.
Table 3. The most optimum rotor models related to rotation rate and power coefficient.
RMN (NACA) Profil Number Blade Blade Angle
Rotation Number (Mean) Power Coefficient (Mean) C23 4415 4 10 592.7 0.411 D12 5317 3 5 1009.9 0.381 D13 5317 4 5 517.0 0.411 D23 5317 4 10 697.8 0.416 D33 5317 4 15 687.2 0.415 Nomenclature
A : Rotor Cross Section Area (m2) : Tip speed ratio
Pmax : Theoretical Power of Wind (W) : Sliding Number
: Density of Air (kg m-3) r : Rotor Radius
n : Rotational Speed of the Rotor (rpm) V1 : Wind speed (m s-1)
CPSchmitz : Vortex Losses Vç : Tangential Velocity (m s-1)
profil : Profile Loses (%) CP : Power Coefficient (%)
uç : Tip Losses (%) B : Blade number
Chord : Tip Length of the Blade Profile (m) Re : Reynold number
CD : Drag coefficient CK : Lift coefficient
RFCN : Code Number of the Rotor Form α : Angle of attack
References
Asif, M. and T. Muneer. 2007. Energy supply, its demand and security issues for developed and emerging economies. Renewable and Sustainable Energy Reviews, 11 (7): 1338– 1413.
Betz, A. 1926. Wind Energy and Their Utilization by Windmills. Bandenhoeck & Ruprect, Göttingen, Germany.
Snack Software, 2001. SNACK(™) Version 2.0, DreeseCode Software. Birnie. 2001; http://mse.arizona.edu/faculty/birnie/engr102/102index.htm
Klug, H. 2001. Basic Course in Wind Energy. German Wind Energy Institute GmbH (DEWI), Istanbul, Turkey.
Çetin, N.S., M.A. Yurdusev, R. Ata and A. Ozdemir. 2005. Assessment of optimum tip speed ratio of wind turbines. Mathematical and Computational Applications, 10 (1): 147-154.
Özdamar, A. and M.G. Kavas. 1999. A research about wind turbine propeller design. Sun Day Symposium Presentations Book, 151-160.
Beer, F.P. and E.R. Johnston (Translation: Tameroglu, S.S. and T. Ozbek). 1991. Vector Mechanics For Engineers: Dynamics, Birsan Publishing House, İstanbul.
Yavuzcan G. 1994. Technology of Energy, Faculty of Agriculture, University of Ankara, Publication, Ankara.
Fingersh, L.J. and P.W. Carlin. 1998. Results from the NREL variable-speed test bed. A collection of the 1998 ASME. Wind Energy Symposium Technical Papers, 233-237. Piggott H. 2000. Small wind turbine design notes.; http://www.scoraigwind.com

![Table 1. CPschmitz values relative to [10].](https://thumb-eu.123doks.com/thumbv2/9libnet/2743556.439/5.892.170.726.944.991/table-cpschmitz-values-relative-to.webp)