A. ï'î. ,Α р 1 7"' •/^■' ■’< / * i“·^. i« *^і;*' 1. .' ç " ‘Л J^v·
''-■Sî * ^' Í í TH IMDUCED ST
.’Ч ı л;, ; л» Λ · -Ч». j · · I ·. . , 4«. ,4м. ,« , а,., . ^ m 1 .' -“· Λ А '*''** <’’*">• ^'’7“ ! Í ^ J ^P
^ *» .A ,4 U !· I v M A Ч-2: i. 1 iΛ. D
4 ^ 1 // 3 S
'SS
Г 5 3
іѳзд
CHARACTERIZATION OF PROGRAMMED CELL DEATH INDUCED BY OXIDATIVE STRESS IN SELENIUM-DEFICIENT HEPATOCELLULAR
CARCINOMA CELLS
A THESIS SUBMITTED TO
THE DEPARTMENT OF MOLECULAR BIOLOGY AND GENETICS AND THE INSTITUTE OF ENGINEERING AND SCIENCE OF
BILKENT UNIVERSITY
IN PARTIAL FULFILLMENT OF THE REQUIREMENTS FOR THE DEGREE OF MASTER OF SCIENCE
BY
GÜLAY?E ÍNCE JULY, 1999
■wí C 4 9 0 3 8
Gi\J
■
I certify that I read this thesis and that in my opinion it is fully adequate, in
scope and in quality, as thesis for the degree of Master of Science.
Prof. Dr. MehrnetÖztürk
I certify that I read this thesis and that in my opinion it is fully adequate, in
scope and in quality, as thesis for the degree of Master of Science.
Assist. Prof. Gunay ^izmeci-Smith
I certify that I read this thesis and that in my opinion it is fully adequate, in
scope and in quality, as thesis for the degree of Master of Science.
o —
Vy
Prof. Dr. Kuyaş Buğra
Approved for Institute of Engineering and Science.
Prof.Dr. Mehmet Baray,
Director of Institute of Engineering and Science
ABSTRACT
CHARACTERIZATION OF PROGRAMMED CELL DEATH INDUCED BY OXIDATIVE STRESS IN SELENIUM-DEFICIENT HEPATOCELLULAR
CARCINOMA CELLS
GÜLAYŞE İNCE
M.S. in Molecular Biology and Genetics Supervisor; Prof. Mehmet Öztürk
July 1999, 72 pages
Selenium (Se) plays an important role in eliminating the reactive oxygen species generated during oxidative stress. Se-containing selenocysteine is an essential amino acid required for the synthesis o f many selenoproteins, such as glutathione peroxidase. Se-dependent glutathione peroxidase is the major en2yme that metabolizes organic and hydrogen peroxides in the cell. It appears that Se manifests its antioxidant effect through the selenoproteins. Se deficiency causes a wide range o f pathological conditions. Keshan disease, characterized by cardiomyocyte and liver cell death, defined as "necrosis", was found to be associated with Se deficiency. Se deficiency is also observed in liver cirrhosis, alcoholic liver disease, HIV positive and AIDS patients, thyroid hormone abnormalities, etc. Moreover, epidemiological studies show that Se deficiency increases the risk o f many cancer types, including hepatocellular carcinoma (HCC). The molecular mechanisms o f the pathologies associated with Se deficiency are mostly unknown. In this study, the in vitro responses o f human hepatocellular carcinoma cells, to Se deficiency have been examined. Apoptotic changes (nuclear condensation, positive annexin V staining, genomic DNA breaks) are detected in Huh7, HepG2, and Mahlavu cells under Se-deficient culture conditions. Hydrogen peroxide addition into the culture medium aggravates apoptosis. Such changes are prevented by the supplementation o f Se. The Se-dependent glutathione peroxidase enzyme is shown to be reduced in cells grown under Se-deficient conditions, explaining the build up o f intracellular oxidative stress. It is proposed that the cell death observed in many pathologies associated with Se deficiency, is the result o f the programmed cell death, triggered by an increase in intracellular oxidative stress, as opposed to necrotic cell death. Hep3B, Hep3B-TR, Hep40, PLC/PRF/5 and BC1/R14 cell lines have not displayed cell death when grown in Se-deficient conditions and were resistant to hydrogen peroxide, as well. The presence o f such cell lines and the differential sensitivities manifested by HepG2, Huh7 and Mahlavu suggest a complete or partial gained resistance for apoptosis, which may contribute to the onset or progression o f HCC, consistent with the increased risk o f HCC in Se deficiency. Key words: Selenium, Glutathione peroxidase. Hydrogen Peroxide, Oxidative Stress, Apoptosis, Hepatocellular Carcinoma.
ÖZET
SELENYUM EKSİKLİĞİNDE KARACİĞER KANSERİ HÜCRELERİNDE OKSİDATİF STRES YOLU İLE ORTAYA ÇIKAN PROGRAMLI HÜCRE
ÖLÜMÜNÜN TANIMLANMASI
GÜLAYŞE İNCE
Yüksek Lisans Tezi, Moleküler Biyoloji ve Genetik Bölümü Tez Yöneticisi: Prof. Mehmet Öztürk
Temmuz, 1999, 72 sayfa
Selenyum (Se), oksidatif stres sırasında ortaya çıkan reaktif oksijen türevlerinin ortamdan uzaklaştınlmasını sağlayan anti-oksidan sistemde önemli rol oynamaktadır. Se içeren selenosistein, başta glutatyon peroksidaz olmak üzere bir çok selenoproteinin sentezi için gerekli bir amino asittir. Se-bağımlı glutatyon peroksidaz, hücre içinde hidrojen ve organik peroksitleri metabolize eden başlıca enzimdir. Selenyumun anti-oksidan etkisini seleoproteinler aracılığı ile gösterdiği tahmin edilmektedir. Se eksikliği bir çok patolojik duruma sebep olmaktadır. "Nekroz" olarak tanımlanan kardiyomiyosit ve karaciğer hücre ölümlerinin gözlemlendiği Keşan hastalığının Se eksikliği ile bağlantısı ortaya konmuştur. Se eksikliği, karaciğer sirozu, alkole bağlı karaciğer hastalığı, HIV pozitif ve AIDS hastalannda, tiroid hormon metabolizması bozukluklannda da gözlemlenmiştir. Diğer taraftan epidemiyolojik çalışmalar selenyum eksikliğinin, karaciğer kanseri dahil olmak üzere, birçok kanserin riskini arttırdığını göstermektedir. Ancak selenyum-kanser ilişkisinin moleküler mekanizmaları büyük ölçüde bilinmemektedir. Bu çalışmada insan karaciğer kanseri hücrelerinde in vitro olarak selenyum eksikliğine bağlı ortaya çıkan değişiklikler incelenmiştir. Selenyumsuz kültür ortamında Huh7, HepG2, ve Mahlavu hücrelerinde apoptotik değişimler (çekirdek yoğunlaşması, genomik DNA haşan ve anneksin V pozitiliği) gözlemlenmektedir. Hücre ortamına eklenen HıG, apoptotik değişimleri hızlandırmaktadır. Bu değişimler ortama Se sağlanması ile engellenmektedir. Selenyumsuz ortamda büyütülen hücrelerde Se-bağımlı glutatiyon peroksidaz enzim aktivitesinin düştüğünün gösterilmesi, hücre içi oksidatif stres birikimini açıklamaktadır. Bu bulgular Se eksikliği ile ilişkilendirilmiş patolojilerin bir çoğunda gözlenen hücre ölümünün, nekroz yerine, hücre içi oksidatif stres birikimine bağlı olarak ortaya çıkan programlı hücre ölümü olduğu hipotezini desteklemektedir. Selenyumsuz ortamda büyütülen Hep3B, Hep3B-TR, Hep40, PLC/PRF/5 ve BC1/R14 hücre hatlannda, hidrojen peroksit eklenmesi durumunda dahi ölüm gözlemlenmemiştir. Bu tür dirençli hücre hatlan ve Huh7, HepG2 ve Mahlavu hücrelerinin ortaya koyduğu farklı derecede duyarlılıklar, hepatoselüler karsinojenezde apoptoza karşı kazanılmış, kısmı ya da tüm bir direncin varlığına işaret etmektedir. Se eksikliğinde artan karaciğer kanseri riskini doğrular şekilde, sözü edilen direnç karaciğer kanseri oluşumuna ya da ilerlemesine katkıda bulunabilir.
I am very pleased to express my deepest gratitude to my supervisor Prof. Dr.Mehmet Oztiirk, for his guidance, encouragement and invaluable efforts during my thesis work. I am very fortunate to have started my scientific life under the supervision o f a scientist like him o f excellent intellect, vision and knowledge.
ACKNOWLEDGEMENTS
I wish to thank A ssoc.Prof Uğur Yavuzer and Dr.Cengiz Yakicier for their close fnendships and significant contributions to my scientific background. Many thanks to Dr.Rengiil Çetin Atalay for her guidance in the native gel experiments, her warm attention and fnendship. I would also like to thank my teachers from Boğaziçi University for their supports and close attentions.
My best friend Ash, you will never get rid o f me! Thank you so much for all the years. Life is much more fun and easier with you! Mösyö Bilican, you are my sunshine! Temre, thanks for all, a fiiend in need is a friend indeed. Hani, the great member o f pretenders, thanks for being so nice. Thank you, the great Goddess Hilal, it is easier to bear up with difficulties (!) after knowing you. Also, I would like to thank to Togi and Tuba for all the endless geyiks and their helps. Many thanks to my friends from Istanbul and Ayça, the cefakar Boğaziçi-link o f our group.
Dearest Esma, I never knew it would get to be such a pleasant friendship, when we first started working as lab-partners. Thanks to my lab-mates, Neco, Esra, Berna, Emre, Arzu and Cemo for their helps and warm chats.
Finally, I would like to thank my family for always being with me, my grandfather for his endless love and supports and my cousin Cenk, for his overseas supports and cheer-ups.
TABLE OF CONTENTS
SIGNATURE PAGE
ABSTRACT
111OZET
ACKNOWLEDGEMENTS
TABLE OF CONTENTS
LIST OF FIGURES
LIST OF TABLES
ABBREVIATIONS
1. INTRODUCTION
1.1 OXIDATIVE METABOLISM1.1.1 Reactive Oxygen Species Generating Mechanisms 1.1.2 Toxicity o f Oxygen-Derived Free Radicals
1.1.3 Cellular Antioxidant Systems
1.2 SELENIUM-DEPENDENT GLUTATfflONE PEROXIDASE
1.3 SELENIUM DEFICIENCY-ASSOCIATED PATHOLOGIES
1.4 PROGRAMMED CELL DEATH
1.4.1 Apoptotic Pathways
1.4.2 Mitochondria and the Bcl-2 Family
1.5 OXIDATIVE STRESS AND APOPTOSIS
1.6 AIMS AND STRATEGIES
IV VI XI xii
1
1
2 3 46
9 11 12 15 16 19 VI2. M A T E R IA L S AND M ETH O D S 20 2.1 MATERIALS 2.1.1 Reagents 2.1.2 Solutions
2.2
2.1.2.1 General Solutions2.1.2.2 Solutions for Annexin V Assay 2.1.2.3 Solutions for TUNEL Assay 2.1.2.4 Solutions for Comet Assay
20 20
21
21
21
22 222.1.2.5 Solutions for Protein Concentration Determination 23 2.1.2.6 Solutions for Native Polyacrylamide Gel 24
2.1.3 Cell Culture Media and Cell Lines 25
2.1.4 Equipment 26
2.1.5 Photography Materials 27
METHODS 28
2.2.1 Cell Culture 28
2.2.2 Growth Curves 28
2.2.3 Programmed Cell Death Detection M ethods 28
2.2.3.1 Preparation o f Cell Samples for
In situ
M ethods 282.2.3.2 Hoechst 33258 Nuclear Staining 29
2.2.3.3 Annexin V Assay 30
2.2.3.4 TUNEL (Terminal Deoxynucléotidyl Transferase 31 Mediated dUTP Nick End Labeling) Assay
2.2.3.5 Comet Assay 32
2.2.4 Fluorescent Microscopy
2.2.5 Native Polyacrylamide Gel Electrophoresis 2.2.5.1 Sample Preparation and Cell Lysis 2.2.5.2 Protein Concentration Analysis
2.2.5.3 Pouring Native Polyacrylamide Gel and Electrophoresis
2.2.5.4 Detection o f Peroxidase Activity Bands
33 34 34 35 36 36
3. RESULTS
38
3.1 SELENIUM DEFICIENCY IMPAIRS
IN VITRO
GROWTH 38OF LIVER-DERIVED CELLS.
3.1.1 Growth Curves 3 8
3.1.2 Growth Inhibition Associated with Cell Death 39
3.2 SELENIUM-DEFICIENT CELLS UNDERGO CELL DEATH 39
UPON EXPOSURE TO OXIDATIVE STRESS.
3.2.1 Aggregation o f Cell Death by Exogenous Hydrogen 39 Peroxide Addition
3.2.2 The Non-immediate Protective Effect o f Selenium 41
3.3 SELENIUM DEFICIENCY LEADS TO LOSS OF 41
GLUTATHIONE PEROXIDASE ENZYME ACTIVITY.
3.4 IDENTIFICATION OF CELL DEATH UNDER 44
SELENIUM-DEFICIENT CONDITIONS AS APOPTOSIS.
3.4.1 Annexin V-PE Assay and Hoechst33258 Staining 46 vin
3.4.2 TUNEL Assay and Hoechst33258 Staining 3.4.3 Comet Assay
3.5 DIFFERENTIAL RESPONSES OF HCC CELL LINES
TO SELENILM DEFICIENCY
3.5.2.2 Hoechst 33258 and Annexin V-PE Stains
46 49
46
3.5.1 Screening Various HCC Cell Lines 49
3.5.2 Comparison o f Huh7, HepG2 and Hep3B-TR Cell Lines 52
3.5.2.1 Growth Curves 52
52 3.5.2.3 Se-dependent Glutathione Peroxidase Deficiency 52
in Hep3B-TR Cells
4. DISCUSSION
5. PERSPECTIVES
REFERENCES
56 62 64 IXL IS T O F FIG U R ES
Figure 1.1 Cellular Mechanisms o f ROS Generation and Antioxidant Systems.
6
Figure 1.2 Pathways o f Caspase Activation and Apoptosis (Green, 1998). 14
Figure 3.1 Growth curves o f Huh7 cells. 38
Figure 3.2 Light microscopy o f Huh7 cells. 40
Figure 3.3 Light Microscopy o f Se-deficient cultures. 42
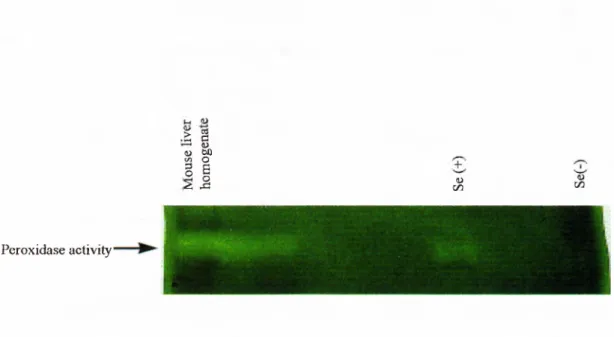
Figure 3.4 Percentages o f apoptotic cells as observed by 76 hours. 43 Figure 3.5 Peroxidase activity in cell lysates from Huh7 cells. 45
Figure 3.6 Annexin V assay. 47
Figure 3.7 TUNEL and Hoechst 33258 staining o f Huh7 cells. 47
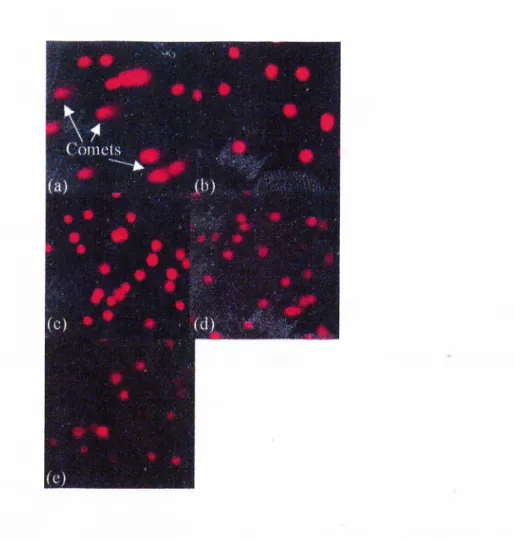
Figure 3.8 Comet assay o f Huh7 cells. 48
Figure 3.9 Light micrographs o f HCC cells. 50
Figure 3.10 Growth curves o f Huh7, HepG2 and Hep3B-TR cell lines. 53
Figure 3.11 Hoechst 33258 staining o f Hep3B-TR. 54
Figure 3.12 Hoechst 33258 and Annexin V-PE stains o f HepG2. 54 Figure 3.13 Peroxidase activity in cell lysates from Hep3B-TR cells. 55
Figure 4.1 Induction o f Apoptosis by Selenium Deficiency 60
Figure 4.2 Model for Increased Risk o f Hepatocellular Carcinoma in Selenium Deficiency
LIST OF TABLES
Table 2.1.
Table 3.1
Excitation and emmision wavelengths o f fluorochromes (O rm erodM G , 1994)
Apoptotic responses o f the HCC cell lines to Se deficiency and restoration by Se repletion.
34
51
ABBREVIATIONS
APS Ammonium per sulfate
BSA Bovine Serum Albumin
ddHaO double distilled water dH20 distilled water
DMEM Dulbecco's Modified Eagle's Medium
DMSO Dimethylsulfoxide
DNA Deoxyribonucleic acid
EDTA Ethylene diamine tetra acetic acid
PCS Fetal Calf Serum
FITC Fluorescein
g gram
Gpx Glutathione Peroxidase
Gpx-GI Gastrointestinal Glutathione Peroxidase Gpx-P Plasma Glutathione Peroxidase
GSH Glutathione (reduced form)
GSSG Glutathione (oxidized form)
HCC Hepatocellular Carcinoma
HEPES (N-[2-Hydroethyl]piperazine-N' -[2-ethanesulfonicacid])
HIV Human Immunodeficiency Virus
H2O2 Hydrogen Peroxide
LEC Long Evans Cinnamon
NADP^ Nicotinamide adenine dinucleotide phosphate (oxidized form) NADPH Nicotinamide adenine dinucleotide phosphate (reduced form)
M Molar
mA milHAmper
mg microgram
|ig microgram
min ml Ml nM mM mRNA O D 5 9 5 O2· OH* PAGE PBS PE PHGpx PS Rnase A ROO· ROOH ROS rpm SDS Se SOD Tdt TEMED TPCK Tris TUNEL U V minute milliliter microliter nanometer Millimolar messenger RNA Optical density at 595 nm. Superoxide Radical Hydroxy Radical
Polyacrylamide Gel Electrophoresis Phosphate buffered saline
Phycoerythrin
Phospholipid Glutathione Peroxidase Phosphatidylserine
Ribonucléase A Lipid peroxide Lipid
Reactive Oxygen Species revolutions per minute Sodium dodecyl sulphate Selenium
Superoxide Dismutase
Terminyl deoxynucléotidyl transferase N,N,N',N'-Tetramethylethylenediamine
N-TOSYL-L-Phenylalaninechloromethyl ketone 2-amino-2-[hydroxymethyl]-1,3 propandiol
Terminal Deoxynucléotidyl Transferase Mediated dUTP Nick End Labeling
Unit Volts
1
.
INTRODUCTION
1.1
OXIDATIVE METABOLISM
The reactive oxygen species (ROS) are by-products o f life under aerobic conditions and reactive intermediates are produced under physiological and pathophysiological conditions. The ROS are either free radicals, like hydroxy radical and peroxy radical, or reactive non-radical compounds such as hydrogen peroxide. A free radical is any species that contains one or more unpaired electron, that is an electron that occupies an atomic or molecular orbital by itself Free radicals react with all cellular components and are therefore very toxic to the cell. The ROSs half-lives vary from a few nanoseconds for the most reactive compounds to seconds and hours for rather stable species (Stahl and Sies, 1998).
ROS are continuously generated by sequential (one electron) reduction o f oxygen during various cellular processes and eliminated by antioxidant mechanisms o f the cell. Oxidative stress results when ROS are not adequately removed and the prooxidant-antioxidant balance is disturbed in favor o f the former (Dizdaroglu, 1994).
Oxygen-derived reactive molecules are formed by one electron reduction o f molecular oxygen during various cellular processes, mainly respiration.
During the last step o f the electron transport chain, oxygen is directly reduced into water by cytochrome oxidase, though designed not to release any incompletely reduced molecules, a few percentage (3-5%) o f the used oxygen leads to superoxide anion, O2·’ formation due to a leakage. The superoxide anion is converted into H2O2 by
the superoxide dismutase enzyme. In addition, O2·’ and H2O2 can be produced in the
cell by enzymatic activities, such as oxidases or cytochrome P450, and by autooxidation o f small molecules, such as flavines or catecholamines. The hydroxyl radical, OH· is formed by the Haber-Weiss reaction between H2O2 and O2·'. This
reaction is catalyzed by transition metals (mainly iron) in the so-called Fenton reaction (Michiels et al. 1994);
O2·· + H2O2 + Fe/Cu - ^ 0 2 + OH· + OH'
1.1.1 Reactive Oxygen Species Generating Mechanisms
Also, the hydroxyl radical is formed in vivo upon high energy irradiation (e g. y-irradiation or x-rays) by homolytic cleavage o f water. The hydroxyl radical is the most reactive oxygen species (Michiels, 1994).
All cellular components can react with oxygen derived free radicals at the level o f unsaturated bonds. In proteins, some amino acids are very sensitive to these attacks, inducing enzymatic activity alterations or changes in conformation. The OH· can also induce protein crosslinkings and cleave peptide bonds, leading to fragmentation o f macromolecules (Cohen et al. 1998, Prinsze et al. 1990). Nucleic acids are also a target for free radical attacks generating DNA strand breaks, or base modifications, leading to mutations (Dizdaroglu, 1994; Cadet et al. 1999).
1.1.2 Toxicity of Oxygen-Derived Free Radicals
However, the most important damage caused by these reactive species is lipid peroxidation. Polyunsaturated fatty acids are very sensitive to free radical attacks. Once initiated, by the abstraction o f an hydrogen atom from the fatty acids, the reaction can be propagated by a chain reaction to generate lipid peroxides. Lipid peroxides, ROO·, are relatively long-lived species with a considerable diffusion pathlength in biological systems. Further products generated by lipid peroxidation are aldehydes, which react with the amine group o f proteins. These events induce profound changes in the structure o f biological membranes, altering their different functions (Cheeseman, 1993). Lipid peroxidation, nucleic acid and protein alterations are the main consequences o f macromolecular damages induced by reactive oxidative species.
In the liver cells, mitochondria, microsomes and the peroxisomes are the major sites o f ROS generation.
Or'
leaks from the electron transport chain in the mitochondria. The peroxisomes are the organelles o f 3-oxidation o f long fatty acid chains and are highly enriched in H2O2 generating oxidases. The microsomes generateO2·' during the detoxification reactions o f hazardous xenobiotics, mainly by the
cytochrome P450 enzyme. The microsomes are substantial sites o f ROS generation in hepatocytes, since liver is the major organ for the detoxification o f hazardous xenobiotics (Inoue, 1994).
1.1.3 Cellular Antioxidant Systems
To protect themselves against injury by oxygen-derived free radicals, cells have evolved antioxidation mechanisms. The antioxidant system consists o f low molecular weight antioxidant molecules, including reduced glutathione (GSH), vitamin E and vitamin C and enzymes that degrade ROS. Under physiological conditions, these defence mechanisms maintain a low steady state concentration o f ROS and their activities are precisely regulated (Jacob and Burri, 1996).
The first line o f defence against O2·· is the superoxide dismutase enzyme
(SOD), which catalyzes the dismutation o f two O2·· into H2O2 (F igurel.l). Two
isoforms o f the enzyme in eukaryotes have been described, the manganese-dependent, Mn-SOD, and the copper and zinc-dependent, Cu/Zn-SOD, superoxide dismutases (Mates et al. 1999).
Catalase, a ubiquitous enzyme found in all organisms, catalyzes the transformation o f two H2O2 molecules into two H2O and a O2 (Figure 1.1). As for
SOD, catalase can be induced upon exposure to oxidative stress, (Michiels, 1994). It is localized predominantly in the peroxisomes and is responsible for the degradation o f H202in this organelle (Inoue, 1994).
Glutathione peroxidase (Gpx) is responsible for the reduction o f organic and hydrogen peroxides, while oxidizing two molecules o f glutathione (Figure 1.1). This enzyme will be further discussed in the following section.
Reactions catalyzed by the different antioxidant enzymes :
SOD; 202- + 2 H " -^ H 2 0 2 + 02 Catalase: 2H2O2 2H2O + O2
Chemical Autoxídation O xidases y-radiation Respiration (Mitochondria) TF Activation, eg. NF-kB dependent gene exp
H ,0
► HoO
F igure 1.1 C ellular M echanism s of ROS G eneration and A ntioxidant Systems
1.2 SELEN IU M -D EPEN D EN T G LU T A T H IO N E PERO X ID A SE
Glutathione peroxidase (Gpx), the major cellular enzyme detoxifying organic and hydrogen peroxides, is a selenoprotein. Certain enzymes, which have Se- independent glutathione peroxidase activity, such as the glutathione-S transferases, also exist (Carmagnol et al, 1983). Se-dependent Gpx catalyzes the reduction o f peroxides into water by oxidation o f GSH. Se-dependent Gpx is able to reduce lipid peroxides as well as hydrogen peroxide. Oxidized glutathione is circulated back into
its reduced form by the oxidation o f NADPH, by the enzyme glutathione reductase (Baker et al. 1993). Se-dependent Gpx; Glutathione reductase: ROOH + 2GSH ^ ROH + H2O + GSSG GSSG + 2NADPH -> 2GSH + 2NADP^
Se-dependent Gpx is a tetrameric enzyme o f 95 kDa, consisting o f 19-23 kDa monomers. Each subunit contains one molecule o f Se, which is present in the form o f selenocysteine in the catalytic site o f Gpx. Se is incorporated into the polypeptide co- translationally, by the insertion o f a selenocysteine-charged tRNA at the UGA opal nonsense codon at position 47 (Li et al. 1990). This special tRNA is first charged with serine, which is then converted into selenocysteine (Baker et al. 1993).
60-75 % o f Se-dependent Gpx is found in the cytoplasm o f eukaryotic cells, and 25-60 % in the mitochondria. This distribution is similar in the hepatocytes and Se-dependent Gpx is the major antioxidant enzyme that degrades H2O2 generated by
dismutation o f O2·', in the hepatocyte mitochondria (Inoue, 1994).
The Se-dependent Gpx enzyme activity is regulated by selenium availability. Under selenium-deficient conditions Gpx activity is diminished leading to increased oxidative stress. Restoration o f activity is observed during selenium repletion with the rates o f return for each cell type correlating with cell turn-over (Takahashi et al, 1986). The Se-dependent Gpx activity is reduced to 40% o f its control value in two days and
totally lost in ten days, when the Hep3B hepatoma cells are grown in selenium deficiency (Baker et al, 1993). Upon examining different species and different tissues, transcriptional, mRNA stabilization, translational and post-translational mechanisms for the control o f Se over Gpx activity has been suggested (Baker et al. 1993). In hepatoma cells, Se depletion regulates Se-dependent Gpx mainly by decreasing the half-life o f its mRNA, (Bermano et al. 1996). Se deficiency experiments in mice suggest that the liver Se-dependent Gpx activity is regulated post-transcriptionally at the early phase o f deficiency and by the transcriptional step o f the enzyme synthesis by long term deficiency (Toyoda et al, 1989).
Several isoforms o f the classical cellular Se-dependent Gpx have been discovered. Phospholipid Gpx (PHGpx) is associated with the membranes and is able to reduce phospholipid peroxides unlike the cytoplasmic one (Maiorino et al.l990). As the cellular Gpx, the PHGpx is present in most o f the tissues that have been examined (Roveri et al. 1992). Cellular Gpx is present abundantly in erythrocytes, kidney and liver. The plasma glutathione peroxidase (Gpx-P), which is detected in the plasma and milk, has similar substrate specificities with cellular Gpx. It exhibits tissue specific expression, being expressed mainly in the liver, kidney and heart (Maddipati et al. 1987). GPx-GI is selectively expressed in the mucosal epithelium o f the gastrointestinal (GI) tract (Chu et al. 1993). In the mouse GI tract, the Gpx-GI activity was found to be nearly equal to cellular Gpx (Esworthy et al. 1998).
1.3
SELENIUM DEFICIENCY-ASSOCIATED PATHOLOGIES
Since the discovery o f Se as an essential micro-nutrient, its deficiency has been associated with many pathological consequences in both animals and humans. 40 ug/day is considered as the adequate dietary Se requirement for humans (Yang and Xia, 1995). An extraordinarily wide variety o f organ systems are affected by this abnormal nutritional state, the predominant pathologies being cardiomyopathy, hepatic deficiencies, including liver necrosis, imbalances in thyroid hormone metabolism and immune functions (Pamham and Graf, 1987; Weitzel et al. 1990; Beck et al, 1998)
The clearest association between Se deficiency and disease is observable in certain muscular diseases. In man, cardiac myopathy results from dietary Se deficiency. This condition known as Keshan disease, named after the low Se region o f China is described by cardiomyopathy, severe deterioration and multiple focal necrosis, including liver necrosis. It is essentially prevented by dietary supplementation with sodium selenite (Pamham and Graf, 1987). However, the involvement o f an infectious cofactor in the pathogenesis o f the disease has been postulated. The avimlent coxsackievims transforms into a vimlent form under oxidative stress generated by the lack o f Se-dependent Gpx activity (Beck et el. 1998).
Se deficiency has also been associated with increased risk o f developing certain cancers, such as liver, gastrointestinal, prostate, breast, ovarian and lung cancers (Backovi et al. 1999). M oreover, increased dietaiy Se has been shown to have a
chemopreventive effect on many cancer types (Clark et al. 1996). The biochemical basis for the protective effect o f Se in cancer is unknown. Most probably, the chemopreventive effect o f this micro-nutrient is through the increased levels o f antioxidant selenoproteins in response to high Se diets (Gladyshev et al. 1998).
Increased HIV-related mortality and faster disease progression has been associated with Se deficiency. Evidence indicates an increased production o f free radicals or a failure o f antioxidant mechanisms in HIV-1 infected patients. Data consistent with the possibility o f viral selenoproteins have been reported. Moreover, several genomic features required for the expression o f potential selenoprotein genes in HIV-1 have been experimentally confirmed (Baum et al. 1997).
Additionally, Se deficiency is associated with liver deficiencies, including, liver necrosis and cirrhosis, abnormal thyroid hormone metabolism, immune dysfunctions, such as decreased CD4+ T cells and impaired phagocytic functions (Barceloux, 1999, Al-Bader et al. 1998, Arthur et al. 1992).
Se deficiency causes liver failure in animal models, too. The Lon-Evans Cinnamon (LEC) rat is an inbred strain o f Long-Evans which develops a spontaneous form o f hepatitis. It has been shown that the LEC rat possesses a hepatic deficiency in Se, which correlates with a reduced Gpx activity in liver (Downey, 1998).
Necrotic cell death has been identified as a major pathology in many o f the Se deficiency-related diseases. On the other hand, programmed cell death (apoptosis), is one o f the main mechanisms o f cell death. While necrosis involves a disorderly swelling and bursting o f the cell as a result o f severe external insult, apoptosis is executed by the onset o f a genetic program, leading to a programmed and orderly removal o f the cells. The connection between the Se deficiency and apoptosis has not been clearly stated previously. In the light o f the latest advances in the field o f apoptosis, it is questioned if such a connection between Se deficiency and apoptosis exists. Therefore, a brief overview o f programmed cell death will be presented in the following section.
1.4
PROGRAMMED CELL DEATH
Apoptosis is the mechanism by which cells are programmed to die under a wide range o f physiological, developmental or pathological stimuli. It plays a central role both in development and in homeostasis o f complex organisms. Defects in the control o f apoptotic pathway may lead to various pathological conditions, including cancer, autoimmune and neurodegenerative conditions.
Apoptosis was first recognized by a unique set o f structural changes observed in the dying cells, including cellular shrinkage, membrane blebbing, nuclear condensation and appearance o f pycnotic bodies (Kerr, 1972). Later, iurther
biochemical changes induced by the onset o f apoptosis were described, such as the fragmentation o f DNA and abnormalities in the plasma membrane.
The process o f apoptosis depends on the reception o f apoptotic signals, either physiological or mildly pathological, processing and relaying these signals by transducing pathways to the effector systems, the activation o f the effectors which comprise a unique set o f proteases, the caspases, and finally the cleavage o f the caspase substrates.
Caspases are pro-enzymes, that are activated upon limited proteolysis. They serve as transducers and effectors o f apoptosis. Caspases are highly specific proteases, with an absolute requirement for cleavage after an aspartic acid residue (Nunez G et al. 1998). The cleavage substrates o f caspases, include PARP (poly-ADP-ribose poylmerase) (Lazebnik et al, 1994), nuclear lamin proteins (Oberhammer et al.l994) and DNA-PKcs (DNA-protein kinase catalytic subunit) (Song et al. 1996).
1.4.1 Apoptotic Pathways
Two independent pathways are converging on the activation o f downstream caspases (Figure 1.2).
The first one involves the activation o f the death receptors, such as Fas (CD95) or TNF (Tumor Necrosis Factor) receptor by their ligands, leading to the recruitment
o f cytoplasmic adaptor proteins and activation o f procaspase-8 (Chinnaiyan et al. 1996; Varfolomeev et al. 1996) and further downstream caspases.
The second pathway is triggered by various cellular stress conditions, such as growth factor deprivation, hypoxia, calcium overload, oxidative stress, which mediate the release o f caspase-activating proteins from the mitochondria, among which are cytochrome c (Yang et al. 1997) and apoptosis-inducing factor (AIF) (Susin et al.
1996). The released cytochrome c binds to Apaf-1, which in turn cleaves procaspase-9 into active caspase-9 (Scrinvascula et al, 1998). Caspase-9 activates caspase-3 (Kuida et al, 1998) and the activation o f the downstream caspases follows.
The second pathway is mainly regulated by p53, when the cellular stress conditions induce DNA damage. Transcriptional activation by p53, the pro-apoptotic protein bax expression being the best example, is in part responsible for the p53- induced apoptosis (Miyashitu and Reed, 1995), although transcription-independent mechanisms exist (Amundson et al. 1998).
D
E
A
T
H
L
IG
A
N
D
(e.
g
.
F
a
sL
)
DEATH
R
E
C
E
P
T
O
R
{e.g
.
F
a
s)
a
da
p
ter
(e.g.
F
A
D
D
)
A
P
O
P
T
O
S
IS
Key
S
u
b
st
r
a
te
s
<
}
Pro
caspase-8
C
E
L
L
U
L
A
R
S
TR
ESS
I ^ S T “ ·’ '&
B
A
X
B
H
3
p
r
o
te
in
s?
Cytoc
hr
om
e
c
^
Fi
gu
re
1
.2
Path
ways
o
f
Casp
ase Activation
a
n
d
Ap
optosis,
G
re
en
1
9
9
8
1.4.2 Mitochondria and The Bcl-2 Family
The bcl-2 family proteins are critical regulators o f programmed cell death, either promoting or inhibiting apoptosis. The first member to be discovered was the bcl-2 anti-apoptotic gene in a chromosomal translocation in human follicular lymphomas (Tsujimoto et al. 1985). Since then, 16 homologs o f the family have been identified in humans. All members possess at least one o f the four conserved motifs known as bcl-2 homology domains (BH1-BH4). Bcl-2 and many o f its homologs contain a stretch o f hydrophobic amino acids at their C-termini that result in the post- translational insertion into intracellular membranes, primarily the outer mitochondrial membrane, nuclear envelope and endoplasmic reticulum (Lithyow et al. 1994).
Though not all o f the mechanisms o f action o f the bcl-2 homologs are known, a number o f functions have been attributed to them. Pro- and anti-apoptotic family members can heterodimerize and titrate each other's function. The first example discovered was, bcl-2 heterodimerization with its pro-apoptotic relative bax (Oltvai et al. 1993). Although the bcl-2^ax ratio plays a rheostat role in the trigger o f apoptosis, bcl-2 and bax appear to have independent functions as effectors o f survival and death, respectively. The additional functions o f bcl-2 include binding to non-homologous proteins, formation o f ion channels or pores on intracellular membranes modifying the flux o f small molecules, such as inhibition o f cjdochrome c release and free-radical scavenging antioxidant role (Hockenbery et al. 1993). Also, bax can directly cause the mitochondria to release cytochrome c (Jurgensmeier et al. 1998) by shuttling from
its cytoplasmic location to the mitochondria upon induction o f apoptosis (Wolter et al. 1997).
The mitochondrial role in the apoptotic pathway involves at least three general mechanisms, including; (i) disruption o f electron transport chain, oxidative phosphorylation, and ATP production; (ii) release o f proapoptotic proteins; and (iii) alteration o f cellular redox potential, (Green and Reed, 1998).
1.5
OXroATIVE STRESS AND APOPTOSIS
Many evidences point to the involvement o f ROSs in programmed cell death. The clearest genetic evidence is provided by familial amyotrophic lateral scelerosis. Mutations within the Cu/ZnSOD argue strongly for an oxygen radical-mediated loss o f motor neurons (Rosen et al. 1993). Exposure to low doses o f H2O2 induces apoptosis
in a variety o f cell types (Lennon et al. 1991). Most probably, H2O2 toxicity is
mediated by the production o f OH· radical.
While O2·' is the primary product o f e‘ attack on O2, it is a rather poorly reactive
radical and is not lipid soluble. Protonated HO-2 is relatively more reactive; however
the vast majority o f O2·’ is converted to H2O2, and most o f the damage is felt to be
mediated by the most reactive OH· radical. As mentioned previously, the hydroxy
radical is generated by two metal catalyzed reactions, either the Fenton reaction or the Haber-Weiss reaction (Hockenbery et al. 1993).
The activities o f the antioxidant enzymes and the balances in their expression patterns are important determinants o f apoptosis. Overexpression o f MnSOD, the enzyme that converts 0-2 and H2O into H2O2, does not protect the cells from
apoptosis. Consistent with this result, overexpression o f Se-depenedent Gpx the peroxide metabolizing enzyme, did protect against apoptosis (Hockenbery et al. 1993). Therefore, the balance between peroxide producing and metabolizing enzymes is critical. The imbalanced expression o f SOD and catalase activities may be deleterious perhaps through overproduction o f peroxides (Amstad et al. 1991).
Moreover, conditions inhibiting the antioxidant status o f the cell can be apoptogenic. Cells induced to apoptosis actively extrude glutathione in the reduced form (GSH), the most abundant cellular antioxidant and the substrate o f Se-dependent Gpx, as a very early process o f apoptosis, much earlier than plasma membrane leakage. Likewise, the inhibition o f GSH efflux, rescues the cells form apoptosis (Ghibelli et al.
1998)
The anti-apoptotic protein bcl-2, functions as an antioxidant at sites o f free radical generation, including mitochondria, ER and the nuclear membrane. Overexpression o f bcl-2 protects from H2O2 induced oxidative death and suppresses
lipid peroxidation (Hockenbery et al. 1993). One plausible role for bcl-2 would be as a free radical scavenger serving as a nonreactive free radical trap.
These evidences and many more indicate that oxidative stress and ROS may account for a central pathway in apoptosis. The downstream mediators o f ROS may be signalling molecules that regulate redox state and affect the activity o f several transcription factors including NF-kB, Fos/Jun and helix-loop-helix members (Schreck et al. 1991, Abate et al. 1990, Pagnonec et al. 1992). However, this hypothesis is questioned by the evidences that apoptosis may occur in anaerobic conditions, ie. in the absence o f ROS (Shimizu et al. 1995).
This project aims to investigate the underlying molecular mechanisms o f selenium deficiency in liver-derived cells. As, hepatic necrosis is a major symptom described in Se deficiency associated pathologies, we decided to characterize this mode o f death and propose a model explaining its role in Se deficiency associated hepatic diseases and increased risk o f hepatocarcinogenesis by Se deficiency. For this purpose, the following strategies were employed:
1. To screen the response o f various HCC cell lines to Se deficiency, in terms o f programmed cell death. Se deficiency is created by growing the cells in serum-ffee medium. Se repletion is achieved by supplementation o f sodium selenite into the culture medium.
2. To characterize apoptosis by nuclear condensation, annexin V positivity, TUNEL and comet assays.
3. To demonstrate the loss o f Se-dependent Gpx activity and the accumulation o f oxidative stress. This is questioned by the effect o f hydrogen peroxide addition, the time-dependent protective role o f sodium selenite repletion and demonstrating the loss o f peroxidase activity by native activity gels.
1.6 AIM AND STRATEGIES
2.
MATERIALS AND METHODS
2.1
MATERIALS
2.1.1 Reagents
All the chemicals or kits were purchased Sodium selenite
Hydrogen peroxide Ethanol (for fixation) Paraformaldehyde Ribonucléase A DMEM PCS L-glutamine Penicillin/ Streptomycin Non-essential amino acids Trypsin/EDTA
Hoechst 33258 Annexin V-PE
In Situ Cell Death Detection Kit
Reduced glutathione Aprotinin
Leupeptine TPCK
from the sources listed below.
Sigma
Merck
Merck
Sigma
Sigma
Sigma
Seromed
Biological Industries
Seromed
Seromed
Sigma
Sigma
Pharmingen, Cat. no. 65875X
Boehringer Mannheim,
Cat. no. 168409
Sigma
Boehringer Mannheim
Boehringer Mannheim
Boehringer Mannheim
All other chemicals were purchased from Sigma, Difco or Carlo-Erba.
2.1.2 Solutions
2.1.2.1 General Solutions
Phosphate-Buffered Saline (PBS); Hoechst 33258 fluorochrome: 70 % Ethanol: Ribonucléase A; 0.12 M NaCl, 2.7 mM KCl, 10 mM Na2HP04, 1.8 mM KH2PO4, pH 7.4.400 ug/ml stock solution in double- distilled water. Stored at 4°C in dark. 3 ug/ml working solution in distilled water.
70 % ethanol in distilled water. Stored at -20°C.
0.5 mg/ml solution in PBS. Stored at -20°C.
50 % Glycerol; 50 % glycerol in distilled water.
2.1.2.2 Solutions for Annexin V Assay
Binding Buffer: 10 mM HEPES/NaOH, pH 7.4,
140 mM NaCl, 2.5 mM CaCb. Stored at 4°C.
2.1.2.3 Solutions for TUNEL Assay
In Situ Cell Death Detection Kit;
TUNEL Reaction Mixture:
Permeabilization Solution:
4% Paraformaldehyde:
0.075% Saponin:
Bottle 1 (enzyme solution) and bottle 2 (label solution). Stored at -20°C. 50 p.1 from bottle 1 is added to 450 ul from bottle 2, mixed thoroughly and kept on ice. Prepared freshly. 100 ul from bottle 2 is spared for negative controls.
0.1 % Triton X-100, 0.1 % sodium- citrate.
40 mg/ml paraformaldehyde in PBS, pH 7.4. Stored at 4°C for several weeks.
0.75 mg/ml saponin in PBS, pH 7.4.
2.1.2.4 Solutions for Comet Assay
Lysis Buffer: 2.5 M NaCl, 100 mM EDTA,
1 % N-lauryl sarcosine, 10 mM Tris- HCl, pH 10, 1% Triton X-100, 10 % DMSO, freshly prepared.
Neutralization Buffer: Ethidium Bromide:
Electrophoresis Buffer: 300 mM NaOH, 1 mM EDTA, pH
13.
0.4 M Tris-HCl. pH 7.5.
10 mg/ml stock solution. 20 ug/ml working solution. Stored in dark.
2.1.2.5 Solutions for Protein Concentration Determination
Bradford Stock Solution:
Bradford Working Solution:
Protein standard:
100 ml o f 95% ethanol, 200 ml o f 88% phosphoric acid, 350 mg Serva Blue G. Filtered and stored in dark for several weeks.
21.25 ml o f distilled water, 0.75 ml o f 95% ethanol, 1.5 ml o f 88% phosphoric acid, 1.5 ml o f Bradford stock solution. Prepared freshly and filtered.
1 mg/ml bovine serum albumin (BSA) in doubledistilled water. Stored at -20°C.
2.1.2.6 Solutions for Gpx Activity Analysis by Native Polyacrylamide Gel
Protease Inhibitors: Lysis Buffer: Lower Buffer: Upper Buffer: 24% Acrylamide/Bisacrylamide mix: 10% APS: 0.5 mg/ml leupeptine, 1 mg/ml aprotinin, 3 mg/ml TPCK, 100 mM PEFA block stock solutions were stored at -20°C.300 mM NaCl, 50 mM Tris-HCl, pH 8, 0.5 ug/ml leupeptine, 1 ug/ml aprotinin, 100 ug/ml TPCK, 1 mM PEFA Block, freshly prepared, kept on ice. 0.48 N HCl, 3 M Tris-HCl, pH 8.9. Stored at 4°C. 0.48 N HCl, 0.49 M Tris-HCl, pH 7. Stored at 4°C. 24%acrylamide, 0.64% bisacrylamide in distilled water. Stored at 4°C.
100 mg/ml APS in distilled water. Stored at - 20°C.
TEMED
lOx Electrophoresis Buffer: Loading Buffer: Washing Buffer 1: Washing Buffer2: Staining Solution: 0.5 M Tris-HCl, 3.8 M glycine, pH 8.3. Stored at 4°C. 0.0025 % bromophenol blue, 10 % glycerol in distilled water.
1.5 mM GSH, 50 mM Tris-HCl, pH 8. Prepared freshly.
1.5 mM GSH, 0.003 % H2O2, 50 mM
Tris-HCl, pH 8. Prepared freshly.
Prepared by mixing equal volumes o f freshly prepared 2 % stock solutions o f potassium-ferricyanide and ferric- chloride, immediately before staining the gel.
2.1.3 Cell Culture Media and Cell Lines
Control Medium: 10 % PCS, 2 mM L-glutamine,
100 U/ml penicillin, 100 ug/ml streptomycin, and lx non-essential amino acids in DMEM.
Se-deficient Medium:
Se-repleted Medium:
Medium for BC1/R14 cell line:
Cell lines:
0.1 % or 0 % FCS, 2 mM L- glutamine, 100 U/ml penicillin, 100 ug/ml streptomycin, and lx non- essential amino acids in DMEM. 10 nM or 100 nM sodium-selenite in Se-deficient medium.
5 ug/ml insulin, 7 x 10'’ M methyl prednisole in control medium.
Huh7, Hep3B-TR, HepG2, Mahlavu, PLC/PRF/5, FOCUS, Hep40, Hep3B, BC1/R14 cell lines were used.
All media are stored at 4°C.
2.1.4 Equipment
The list o f the equipments used and their manufacturers are given below.
Gel Apparatus
Vertical minicell EC 120 Horizontal midicell EC350 Power Supply Centrifuges Bioflige GS-15R (rotors S4180 and F3602)
EC Apparatus Corporation
EC Apparatus Corporation
Bio-Rad, Power-pac200
Haerus Instruments
Beckmann
26
Ultracentrifiige, XL-90 (rotor NVT90)
Beckmann
Inverted Light Microscope, Axiovert 25
Zeiss
Fluorescent Microscope, Axioskop
Zeiss
Spectrophotometer DU 640
Beckmann
2.1.5 Photography Materials
Photograph machines installed on the Fluorescent microscope Inverted-light microscope
Zeiss
Contax
Photograph Films SUdefilm ISO 200 Negative film ISO 200Kodak
Kodak
2.2
METHODS
2.2.1 Cell Culture
All cell lines were maintained in the control medium at 37°C, in 5 % CO2,
except the BC1/R14, which was grown in insulin and methylprednisole- supplemented control medium. Cultures were split in 1:3 to 1:6 ratios, every 3-4 days.
2.2.2 Growth Curves
6 x 1 0 “* cells were plated into wells o f 6-well plates and grown in 1 ml control medium overnight. The control medium was removed, the cells were washed with 1 ml PBS and supplemented with 3 ml experimental medium (Se-deficient, Se-repleted and control mediums) the next day and counted every 48 hours, until the 120th hour, by a haemocytometer.
2.2.3 Programmed Cell Death Detection Methods
2.2.3.1 Preparation of Cell Samples for
In situMethods
Autoclave-sterilized coverslips were placed into the wells o f 6-well plates. 6 x 10“* cells, counted by a haemocytometer, were seeded into each well and grown for 16
hours in 1 ml control medium. Each well was washed with 1 ml PBS and supplemented with 3 ml o f experimental medium (Se-repleted, Se-deficient and control mediums). After 72 hours o f growth, 3 |il o f 0.1 M H2O2 to a final concentration o f
1Q·^ M, was provided into the culture medium o f appropriate wells. After 4 hours o f incubation, cells were tested for the presence o f programmed cell death by various methods.
2.2.3.2 Hoechst 33258 Nuclear Staining
%
Hoechst 33258 DNA dye was used for the detection o f nuclear condensation o f cells undergoing apoptosis.
Cells were prepared for in situ staining as described in section 2.2.3.1. After removing away the culture medium from the wells, the cells were washed with 1 ml PBS. Cells were fixed by placing 1 ml 70% cold ethanol into each well and keeping on ice for 30 minutes. Samples were washed with 1 ml PBS. 0.5 ml o f 0.5 mg/ml Rnase A was placed into each well and incubated for 30 minutes in room temperature. Samples were rinsed with 1 ml dH20. Coverslips were removed from the wells and placed on a stretched parafilm. 100 |il o f 3 ug/ml Hoechst 33258, was placed onto each coverslip and incubated for 5 minutes at room temperature, in dark. Coverslips were rinsed with dH20. Samples were mounted by dropping 200 ul o f 50% glycerol onto the cells. The drained coverslips were positioned onto glass microscopic slides and examined by fluorescent microscopy.
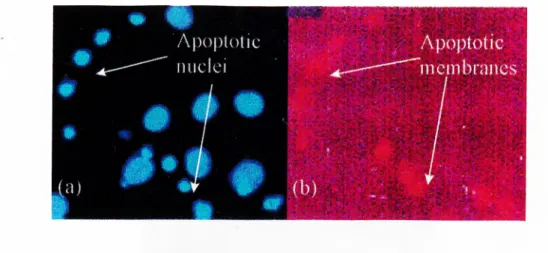
Annexin V is used to identify cells undergoing apoptosis. It relies on the property o f cells to lose membrane as5nnmetry in the early phases o f apoptosis. In
apoptotic cells, the membrane phospholipid phosphotidylserine (PS) is translocated from the inner leaflet o f the plasma membrane to the outer leaflet, thereby exposing PS to the external environment. Annexin V is a Ca^^-dependent phospholipid-binding protein that has a high affinity for PS, and is useful for identifying apoptotic cells with exposed PS. It is conjugated to the fluorochrome Phycoerythrin (PE).
Cells were prepared for in situ staining as described in section 2.2.3.1. The culture medium was aspirated away and the cells were washed with 1 ml PBS. After rinsing with 1 ml binding buffer the coverslips were removed from the wells and placed on a stretched parafilm. 100 ul o f 10 % Annexin V-PE diluted in binding buffer was placed onto each coverslip. The cells were incubated for 20 minutes in dark at room temperature. After this step, the procedure was performed under dim light and the samples were avoided from direct light exposure. The coverslips were replaced into the wells and washed with 1 ml binding buffer. The cells were fixed in 1 ml 70 % cold ethanol for 30 minutes, on ice. Hoechst 33258 staining protocol was exactly followed after this step. Samples were observed by fluorescent microcopy. Cells undergoing apoptosis were positively stained for PE.
2.2.3.3 Annexin V Assay
2.2.3.4 TUNEL (Terminal Deoxynucléotidyl Transferase Mediated dUTP Nick
End Labeling) Assay
Endonucleolysis is considered as the key biochemical event o f apoptosis, resulting in cleavage o f nuclear DNA. Cleavage o f genomic DNA during apoptosis may yield double-stranded, low molecular weight DNA fragments as well as single strand breaks (nicks) in high molecular weight DNA. Those DNA strand breaks can be identified by labeling free 3'-OH termini with fluorescein-conjugated nucleotides in an enzymatic reaction. Terminal deoxynucléotidyl tranferase (TdT), which catalyzes polymerization o f nucleotides to free 3'-OH DNA ends in template-independent manner, is used to label DNA strand breaks. The "In Situ Cell Death Detection Kit" (Boehringer Mannheim) was used in this study.
Cells were prepared for in situ staining as described in section 2.2.3.1. After removing the culture medium, wells were washed with 1 ml PBS and the samples were air dried. The cells were fixed in 1 ml 4% paraformaldehyde for 30 minutes at room temperature. After rinsing with 1 ml PBS once, the cells were permeabilized by keeping in 1 ml permeabilization solution on ice for 2 minutes. The coverslips were rinsed with 1 ml PBS twice and placed on a stretched parafilm. 50 ul o f TUNEL reaction mixture was placed onto each coverslip. 50 ul o f label solution was used for the negative control. A coverage was provided on the samples, to avoid evaporation. The cells were incubated in a 37°C humidified chamber for 60 minutes. The coverslips replaced into the wells were rinsed with 1 ml PBS, three times and (IH2O, once.
Counterstaining with Hoechst 33258 and mounting in 50% glycerol was performed as described in Hoechst 33258 staining procedure. Samples were observed by fluorescent microscopy. The apoptotic cells were identified as positively stained for fluorescein (FITC).
2.2.3.5 Comet Assay
The electrophoretic profiles o f fragmented apoptotic genomic DNA and normal DNA o f intact cells were determined by comet assay.
2.5 X 10^ cells were plated into 60 mM petri dishes and grown in 3 ml control medium overnight. Cells were rinsed with 3 ml PBS, once and supplemented with 5 ml
experimental medium (Se-repleted, Se-deficient and control mediums) and grown for 72 hours. lO’“* M H2O2 was placed into appropriate samples. After 4 hours, cells were
detached by trypsinization, and collected in 5 ml cold PBS. After counting the cells by a haemocytometer, 10^ cells were placed into eppendorfs, spinned down at 13000 rpm, 1 min at 4°C and kept on ice. A piece o f autoclave band was sticked to glass microscopic slides to form a frame around them, leaving a spare area o f a coverslip size in the middle. 120 ul o f 0.5% agarose in PBS was placed on this spare area on the microscopic slide, a coverslip was overlayed and cooled until the agarose polymerized. The coverslip was then removed without disturbing the thin layer o f agarose. The cells in the eppendorfs were resuspended in 100 ul o f 0.5% low melting point agarose in PBS and placed over the thin agarose layer. A coverslip was overlayed on the cell
suspension and cooled for polymerization. The coverslips were removed, similarly. The microscopic slides were immersed into cold lysis buffer for 1.5 hours. The slides were incubated in a midi-electrophoresis tank filled with the electrophoresis buffer for 30 minutes and electrophoresed in the same buffer for 20 minutes at 300 mA. The slides were soaked into neutralization buffer, once. Cells were stained by placing 20 ul o f 2 ug/ml ethidium bromide over the agarose layer. The cell layer was overlayed with a coverslip and the samples were examined by fluorescent microscopy. Apoptotic cells were identified by their comet-like appearance, while non-apoptotic cells remained intact. Fragmented DNA o f apoptotic cells migrated faster forming the tail o f the comet-like profile.
2.2.4 Fluorescent Microscopy
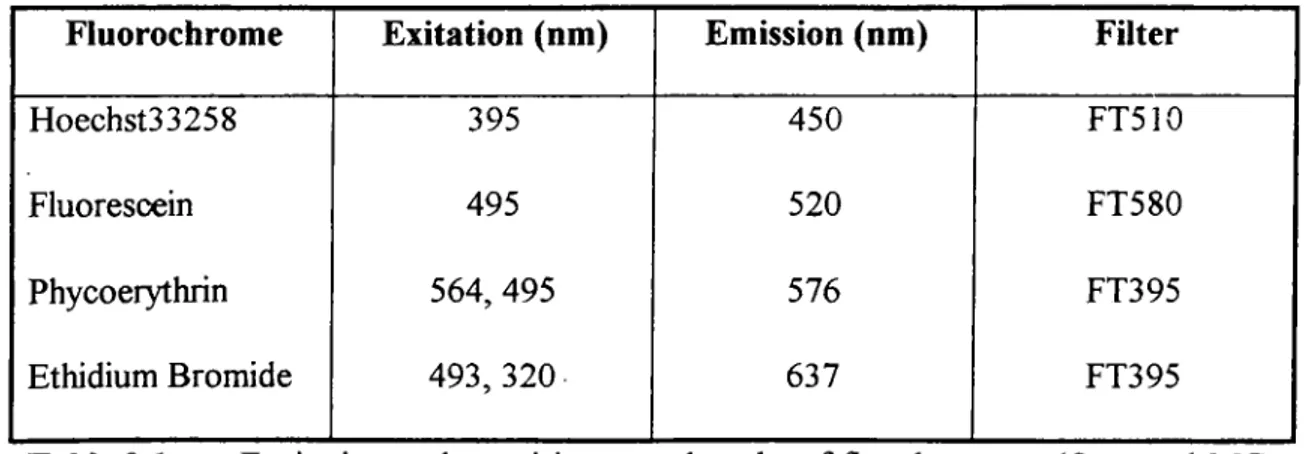
Fluorsecent images were exposed to slide films by the automated system. All photographs were taken under 40x magnification, unless stated otherwise. The excitation and emission wavelengths o f the fluorochromes used and the filters utilized to monitor them are as follows;
Fluorochrome
Exitation (nm)
Emission (nm)
Filter
Hoechst33258 395 450 FT510
Fluorescein 495 520 FT580
Phycoerythrin 564, 495 576 FT395
Ethidium Bromide 493, 320 637 FT395
Table
2.1. Excitation and emmision wavelengths o f fluochromes. (Ormerod MG,1994)
2.2.5 Native Polyacrylamide Gel Electrophoresis
The enzymatic activity o f the Gpx enzyme in cell lysates was measured on a native polyacrylamide gel (Sun et al, 1988). This method is specific for the visualisation o f the glutathione peroxidase activity bands which are not contaminated by catalase or other peroxidases. Catalase is inhibited when the gel is soaked into reduced glutathione with concentrations higher than 1 mM. Also, the staining method has been shown not to stain other peroxidases.
2.2.5.1 Sample Preparation and Cell Lysis
7.5 X 10^ cells were plated into 100 mm petri plates and grown overnight in 4 ml control medium. Cells were washed with 5 ml PBS and supplemented with 8 ml
experimental medium (Se-deficient, Se-repleted and control mediums) and grown for 96 hours, until the Se-Gpx activity is totally lost. After aspirating the culture medium
the cells were washed with 10 ml PBS. Cells were scrapped in 1 ml PBS, pipetted
gently and collected in eppendorfs. 0.5 ml PBS, used to rinse the plates was combined with the cell suspensions. Suspensions were centrifuged at 13000 rpm for 3 min at 4°C and the supematent was discarded. The pellets were left at -20°C for 48 hours prior to lysis. Cell pellets, resuspended in 2 volumes o f lysis buffer were incubated for 30 minutes on ice. Clear supematents obtained by centrifugation at 13000 rpm for 15 min at 4°C, were used to measure Gpx activity by native polyacrylamide gel electrophoresis.
The mouse liver lysate, used as the positive control, was prepared by freshly homogenizing the whole mouse liver in 3 ml PBS, in ice, 5 times for 20 seconds each.
The homogenate was ultra-centrifuged at 26000 rpm, at 4°C, for 1 hour and the supemantent was used. The homogenate was frozen in liquid nitrogen and stored in -80°C.
2.2.S.2 Protein Concentration Analysis
Protein concentrations were determined by the Bradford method. A standard curve o f OD595 versus protein concentration was prepared by using bovine serum
albumin (BSA) at known concentrations in 1 ml o f Bradford working solution and the
unknown protein concentrations o f the lysates was calculated from this curve.
2.2.5.3 Pouring Native Polyacrylamide Gel and Electrophoresis
The 7.5% resolving gel was prepared by mixing 1.56 ml o f acrylamide:bisacrylamide (24%:0.64%), 2.5 ml o f lower buffer, 938 ul o f sterile double-distilled H2O, 50 ul o f 10% APS and 3 ul o f TEMED and pouring in a mini-gel
apparatus. Distilled H2O was layered over the resolving gel and discarded after the gel
polymerized. The 5% stacking gel was prepared by mixing 410 ul o f acrylamide:bisacrylamide (24%;0.64%), 1 ml o f upper buffer, 590 ul o f sterile double distilled H2O, 40 ul o f APS and 3 pi o f TEMED. 200 ug total cell protein was mixed
with 5 pi o f loading buffer and loaded onto the dry gel, by leaving blank wells between the samples, in the cold room. 200 ug o f protein from mouse liver homogenate was used as a positive control. The gel was electrophoresed at 100 V, until the samples reached the resolving gel and at maximum 200 V, such that the current would not exceed 10 mA, until the gel front reached the bottom o f the gel.
2.2.5.4 Detection of Peroxidase Activity Bands
After removing the gel carefully it was soaked into three changes o f freshly prepared, washing buffer 1 for 15 minutes each, at room temperature and then washed in washing buffer2, similarly for 10 minutes. The gel rinsed was then rinsed with distilled water, twice and stained in 20 ml staining solution until a dark green background appeared with yellow activity bands. At the bands where the enzyme was active, GSH bound to the gel was consumed by the peroxidase enzyme to catalyse the
conversion o f H2O2 to H2O, whereas if GSH was not used up and remained bound to
the gel, it produced a green product when reacted with ferric-chloride and potassium- ferricyanide.
3.
RESULTS
3.1 SELEN IU M D EFIC IEN C Y IM PA IR S IN V IT R O G R O W T H O F LIV ER -D ER IV ED C ELLS
3.1.1 G row th C urves
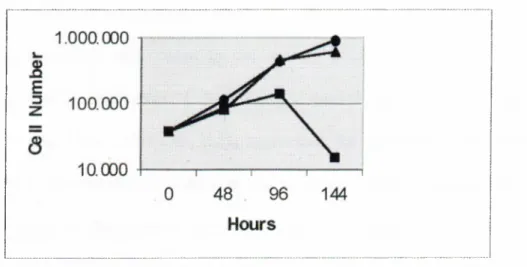
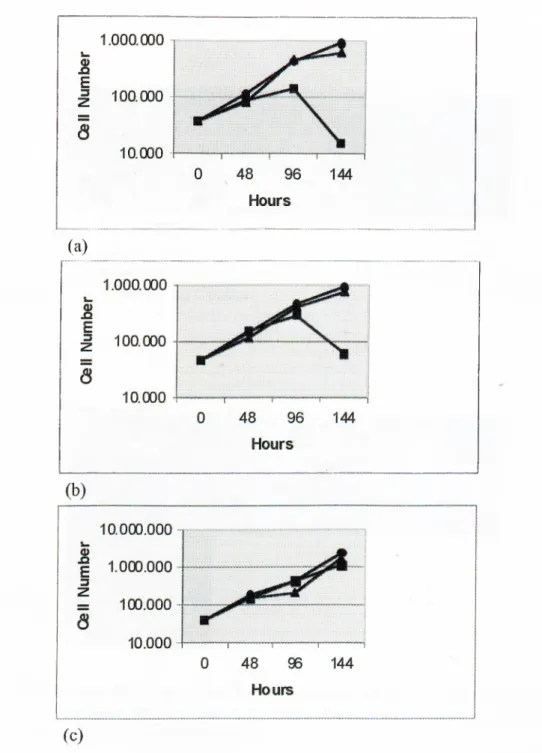
Huh7, which is a well-differentiated cell line sharing many features o f hepatocytes (Nakabayashi et al. 1982), was used to test the response to Se deficiency. The Huh7 cells were grown in Se-deficient, Se-repleted and control mediums, and counted every 48 hours until the 144*'* hour with a haemocytometer. Se deficiency led to a progressive growth inhibition in these cells. Also, Se repletion restored normal growth rates (Figure 3.1).
Figure 3.1 Growth curves Huh7 cells grown in control medium (·); Se-repleted medium (with 10*’ M Na2Se03)
(A);
Se-deficient medium (with 0.1% FCS) (■).3.1.2 Growth Inhibition Associated with Cell Death
Huh7, cells grown in Se-deficient conditions were observed every 24 hours. In vitro cell death was observed in these cells, starting from the 72"^ hour, with a progressive increase in the death rates. Repletion o f sodium selenite rescued the cells from death (Figure 3.2). Sodium selenite concentrations lower than 10 * M were not effective enough and concentrations up to 10'’ M were non-toxic.
3.2
SELENIUM-DEFICIENT CELLS UNDERGO CELL DEATH UPON
EXPOSURE TO OXIDATIVE STRESS.
3.2.1 Aggregation of Cell Death by Exogenous Hydrogen Peroxide Addition
Progressive cell death observed in Se-depleted cells suggested that this could be due to the accumulation o f endogenously produced ROS. To test this hypothesis, 10"* M hydrogen peroxide was added to the medium at different time intervals following the start o f Se deprivation. Cells growing in control medium tolerated well to exogenously added H2O2. However, H2O2 aggravated cell death starting from 48
hours under Se-deficient conditions, indicating that hydrogen peroxide added prior to this time point could be eliminated by active peroxide metabolizing enzymes, mainly Se-dependent Gpx. H2O2 added at 72 and 96 hours had increasingly greater effects on
72 hours 96 hours 120 hours C/3 Q> I / ) d o U
Figure 3.2. Light microscopy o f Huh7 cells grown in Se-deficient (with 0% PCS), Se- repleted (with 0% PCS, 10 * M Na2Se03) and control mediums at 72, 96 and 120 hours o f culture.
apoptosis induction, which can be explained by the time-dependent decrease o f Se- dependent antioxidant enzyme activities (Figure 3.3). The cell death inducing effect o f H2O2 was observed starting from 4 hours after its addition.
3.2.2 The Non-Immediate Protective Effect of Selenium
To question the mechanism o f Se protection, its time dependency was examined. Since Se is cotranslationally positioned into the selenoproteins, its protective effect would depend in a time period required for protein synthesis, as opposed to a metabolic effect. Se had to be repleted to deficient cultures prior to H2O2 to protect against cell death. Se added together with H2O2 could not rescue the
cells from death (Figure 3.4).
3.3
SELENIUM DEFICIENCY LEADS TO A LOSS OF GLUTATHIONE
PEROXIDASE ENZYME ACTIVITY.
To further support the involvement o f Se-dependent Gpx in the accumulation o f intracellular oxidative stress it was important to demonstrate the enzyme inability to detoxify H2O2 in Se-deprived cells. Lysates o f Huh7 cells, grown in Se-deficient and
repleted conditions were prepared at the 96*** hour. Cell lysates were electrophoresed on a native gel and treated with reduced glutathione and H2O2. After
48 hours 72 hours 96 hours
Figure
3.3. Light Microscopy o f Se-deficient cultures (with 0.1% FCS) at (a) 48hours, (b) 72 hours and (c) 96 hours. H2O2 was added 24 hours in advance, in each sample. H2O2 had a greater apoptotic effect when added later. Se-deficient cultures with no H2O2 addition, at (d) 48 hours, (e) 72 hours and (f) 96 hours.
100
080
4M CL60
040
a. CV20
0
(a)
—
— --- ^--- ^
024
48
A1
72
A S eX
H 2 0 2
96
120
hoursf igure 3.4. Percentages o f apoptotic cells as observed by 76 hours. 10' M H2O2 was added at 72 hour. Selenium (with 10'* M Na2Se03) was repleted to Se-deficient cultures (with 0% PCS) at (a) 48 hour or, (b) 72 hour.