IJISAE, 2015, 3(4), 131-135 | 131
An Artificial Neural Network Model for Wastewater Treatment Plant of
Konya
Abdullah Erdal TÜMER*
1, Serpil EDEBALİ
2Accepted 15th August 2015 DOI: 10.18201/ijisae.65358
DOI: 10.1039/b000000x
Abstract: In this study, modelling of Konya wastewater treatment plant was studied by using artificial neural network with different architectures in Matlab software. All data were obtained from wastewater treatment plant of Konya during daily records over four month. Treatment efficiency of the plant was determined by taking into account of input values of pH, temperature, COD, TSS and BOD with output values TSS. Performance of the model was compared via the parameters of Mean Squared Error (MSE), and correlation coefficient (R). The suitable architecture of the neural network model is determined after several trial and error steps. According to the modelling study, the ANN can predict the plant performance with correlation coefficient (R) between the observed and predicted output variable reached up to 0.96.
Keywords: Artificial Neural Network, Modelling, Wastewater Treatment Plant, Performance.
1. Introduction
In last two decades, Artificial Neural Network (ANN) methods have been applied to various areas of environmental issues such as wastewater treatment. The wastewater treatment process is quite complex. However the developments in intelligent methods make them possible to use in complex systems modelling [1]. It can be used for better prediction of the process performance owing to their high accuracy, adequacy and quite promising applications in engineering [2,3,4]. There are certain key descriptions of variables which can be used to assess the wastewater treatment plant performance. These variables consist of Chemical Oxygen Demand (COD), Biological Oxygen Demand (BOD) and Total Suspended Solids (TSSs). Until now, most of the available studies for modelling Waste Water Treatment Plants (WWTPs) used these variables. The ANN based models find out very satisfactory results. Some of these models based on ANNs are as follows. ANN model was developed for BOD removal process in horizontal subsurface flow constructed wetlands by Akratos et al. [5]. Farouq S et al. in [6] used neural network with single input and multi-input layers and gave comparable predictions of the plant performance criteria. To prediction of biological oxygen demand and suspended solid concentrations based on ANN were presented by Hamed et al. [7]. Total suspended solid (TSS) is an indication of plant performance. A simple prediction models based on neural network for TSS was demonstrated in [8].
Many other ANNs model for wastewater treatment have been
proposed either in the past [9-13] or more recently [14- 18]. In this work, an effort has been made to model the wastewater treatment data using the artificial neural networks to predict the performance of Konya Wastewater Treatment Plant. The data set was consist of flow rate, COD, BOD, TSS and ph at 25 0C temperature as input layer variables and TSS as output layer variables. The samples collected on a day during for a period of 4 month. The results of the modelling study expressed briefly high correlation coefficient (R) between the measured and predicted output variables reaching up to 0.9.
2. Materials and Methods
2.1. Artificial Neural Network
Artificial Neural Network (ANN) is an information processing system derived from biological nervous systems of brain. The goal of an ANN is to compute between output and input values with some internal calculations [19]. There is a two-stage operation mode of artificial neural networks. One of them is training the other testing stage. Once it must be trained to use an
artificial neural network. The training is carried out using some of the inputs and outputs data set. ANN makes a generalization of these data. Artificial neural networks consists of three layers, including inputs, output and hidden layers, and there are many neurons in each layer as shown (Figure.1).
_______________________________________________________________________________________________________________________________________________________________ 1 Computer Engineering Department, University of Necmettin Erbakan, Konya, Turkey
2 Chemical Engineering Department, University of Selçuk, Konya, Turkey * Corresponding Author: Email: [email protected]
Note: This paper has been presented at the International Conference on Advanced Technology&Sciences (ICAT'15) held in Antalya (Turkey), August 4-7, 2015
International Journal of
Intelligent Systems and Applications in Engineering
ISSN:2147-67992147-6799 www.ijisae.org Original Research Paper
Figure 1. Architecture of ANN
A neuron is consist of five main elements including; inputs, weights, summing function, activation (transfer) function and output. Neurons can have multiple inputs, but it can only have one output. Inputs information comes from outside networks or other neurons. In some cases, neurons can create self-input with feedback. A neuron usually receives many simultaneous inputs. Each input has its own relative weight which gives the input the impact that it needs on the processing element's summation function. Weights are adaptive coefficients within the network that determine the intensity of the input signal as registered by the artificial neuron. They are a measure of an input's connection strength. These strengths can be modified in response to various training sets and according to a network's specific topology or through its learning rules. The first step in a processing element's operation is to compute the weighted sum of all of the inputs. Summing function operation sums all of the inputs from the processing elements. The formula is as follows:
𝑓(𝑥) = ∑𝑛𝑖=1(𝑊𝑖𝑥+ 𝑎𝑖) (1)
Where w is the weight factor and a is the input values.
Transfer function or activation function is a simple function that uses the net value to generate an output. This output is then propagated to the neurons in the next layer.
We used various types of transfer functions as shown table 1. Also there are many different types of training algorithms. One of the most common training algorithms is Feed Forward Back Propagation algorithm (FFBP) [20].
2.2. Konya WastewaterTreatment Plant
Increasing water need in Konya closed basin, which has a large agricultural area, make it necessary to reuse wastewater by refining as a result of drought, major decreases in ground water level. For this purpose, Konya Wastewater Treatment Plant (KWWTP) set into operation in 2010. KAAT is designed for 200.000 m3/day flow and 1.000.000 equivalent population. The Plant is designed according to carbon removal and partial nitrogen removal biological treatment method. Exiting water is discharged by passing through UV disinfection system. KWWTP consists of 4 different units as seen in (Figure. 2).
1. Preliminary Treatment Units:
Wastewater inlet structure coarse grid, entrance pump station,
Coarse and fine grids
Aeration Grid and Grease Removal Unit
Preliminary settling pool 2. Biological Treatment Units:
Aeration Tanks/ Activated Sludge Reactors (Bardenpho Process)
Secondary Sedimantation Tanks
3. Sludge Treatment, Biogas Production and Energy Recovery Units:
Sludge Dewatering Tanks
4. Mesophilic Anaerobic Sludge Digesters:
Biogas Storage Tanks
Heating plant and energy recycling unit.
Sludge Dehydratation Plant (Decanter Centrifuge) 5. Disinfection:
Open Channel UV disinfection system. Figure 2. Flow Diagram of the KWWTP
2.3. Data Collection
Measurements of the COD, BOD, and TSS were collected 4 month period. This period was satisfactory as it covers all probable seasonal variations in the studied variables. Influent and effluent parameters and their statistic are given table 2. Artificial Neural Network ANN model was developed to modeling a WWTP with the collected data.
And in order to obtain convergence within a reasonable number of cycles, the input and output data should be usually normalized. Normalization method as follows:
(2) Table 1. Transfer Function s Used in Algorithms
Transfer Function Algorithm
Tansig tansig(n) = 2/(1 + exp (-2n)) – 1 Purelin purelin(n) = n, for all n logsig logsig(n) = 1(1 + exp (-n))
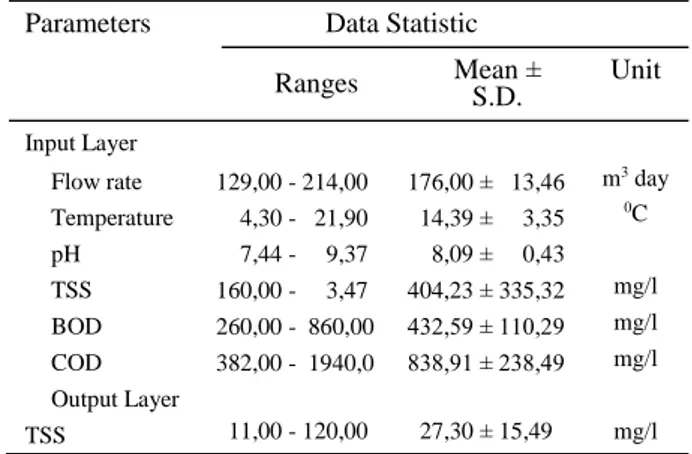
Table 1. The range of data set and their statistic
Parameters Data Statistic
Ranges Mean ± S.D. Unit
Input Layer
Flow rate 129,00 - 214,00 176,00 ± 13,46 m3 day Temperature 4,30 - 21,90 14,39 ± 3,35 0C pH 7,44 - 9,37 8,09 ± 0,43 TSS 160,00 - 3,47 404,23 ± 335,32 mg/l BOD 260,00 - 860,00 432,59 ± 110,29 mg/l COD 382,00 - 1940,0 838,91 ± 238,49 mg/l Output Layer TSS 11,00 - 120,00 27,30 ± 15,49 mg/l
where x′ is the normalized value, x is the original data, xmax and xmin, respectively, is the maximum and minimum values, thus the scaled data ranging between 0,1 and 0,9.
2.4. Network Properties
The neural network model was created in MATLAB. MATLAB Toolbox opens the Network/Data Manager window, which allows the user to import, create, use, and export neural networks and data [21].
The Network properties are as follows:
Network inputs: flow rate, pH, COD, BOD, Temperature and TSS.
Network outputs: TSS.
Network type: Feed-Forward
Back-Propagation.
Training function: TRAINLM.
Adaption learning function: LEARNGDM. Performance function: MSE.
Number of hidden layers: 1,2,3 used respectively
Input Layer Transfer function: logsig, purelin and tansig
Output Layer Transfer function: purelin
The architecture of an ANN model is defined by means of its number of layers and its number of neurons per layer. In this study, we used different numbers of hidden layers and neurons in each hidden layer for find out the best suitable model. Unfortunately, there are no well-developed rules to determine the most suitable values of these parameters for a specific problem. In this case, these values were determined by means of a trial and error method in which the performances of nine different architectures were compared. The architectures considered present the same number of neurons in each hidden layer, range from seven to eleven. These architectures as follows:
with one hidden layer were 7-1], 8-1], 9-1], [3-10-1] and [3-11-1];
with two hidden layers were [3-7-7-1], [3-8-8-1], [3-9-9-1], [3-10-10-1], and [3-11-11-1]
with three hidden layers were [3-7-7-7-1], [3-8-8-8-1], [3-9-9-9-1], [3-10-10-10-1], and [3-11-11-11-1].
In order to assess the performance of each architecture the correlation coefficient (R) and mean square error (MSE) were used. The MSE is given by the following expression,
(3)
where n is the number of data points, is the network
prediction,
is the experimental response and i is an index of the data [22].
3. Results and Discussion
Artificial Neural Network method, which is previously used in various modelling studies, is used in this study for estimating TSS values of treated wastewater in KWWTP. MATLAB program is used for executing the process. The model uses the trainlm - Levenberg–Marquardt function for training. The MATLAB program randomly divides input variables and target variables into three sets. 60 % of the samples are assigned to the training set, 20% to the validation set, and 20% to the test set. Many different functions such as ‘‘logsig”, “tansig”, and “purelin” were tested as transfer function for hidden layer and “purelin” function was used as the output layer transfer function.
Learngdm (gradient descent with momentum weight and bias learning function) function was used as the adaption learning function and MSE and R was determined as the performance function. The network models repeated with different neurons (7-11), transfer functions and number of ANN configuration mentioned section 2. The correlation coefficient (R) and MSE values belonging to these different ANN configuration’s results are presented in Table 3,4,5 respectively in detail.
Models were designed to generate the minimum mean squared error (MSE-it measures the network's performance according to the mean of squared errors) and maximum correlation coefficient (R) values with 7-11 neurons in hidden layers and tansig, logsig and purelin transfer functions.
The suitable training algorithm at different layers, the number of hidden layers, the number of neurons, determination of the transfer and training functions are highly responsive parameters in the design of artificial neural networks. So we tried different ANN architectures.
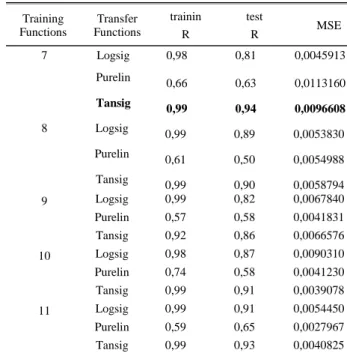
Table 3. 3-2-1 Summary of training and transfer functions used for removal efficiency
Training Functions Transfer Functions trainin R test R MSE 7 Logsig 0,98 0,81 0,0045913 Purelin 0,66 0,63 0,0113160 Tansig 0,99 0,94 0,0096608 8 Logsig 0,99 0,89 0,0053830 Purelin 0,61 0,50 0,0054988 Tansig 0,99 0,90 0,0058794 9 Logsig 0,99 0,82 0,0067840 Purelin 0,57 0,58 0,0041831 Tansig 0,92 0,86 0,0066576 10 Logsig 0,98 0,87 0,0090310 Purelin 0,74 0,58 0,0041230 Tansig 0,99 0,91 0,0039078 11 Logsig 0,99 0,91 0,0054450 Purelin 0,59 0,65 0,0027967 Tansig 0,99 0,93 0,0040825
IJISAE, 2015, 3(4), 131-135
The optimal network size was selected from the one which resulted in maximum R and minimum MSE in training and test data sets and the architecture of the best ANN models for the
prediction of the TSS of the KWWTP is shown in Table 3. According the 3-3-1 model, it was found Rtraining=0,99, Rtest=0,95 and MSE=0,002331. In this case, the network response is satisfactory.
4. Conclusions
The results of this study showed maximum correlation coefficient (R) between the measured and predicted output variables, reaching up to 0.99 with 3-3-1 ANN structure. Therefore, the model developed in this work has an satisfactory result and accuracy. As a result, the neural
network modeling could effectively predict the
performance of KWWTP.
It is concluded that, ANN provides an effective analyzing and diagnosing tool to understand and simulate the plant, and is used as a valuable performance assessment tool for plant operators and decision makers.
Acknowledgment
The authors would like to thank KOSKI, Konya, Turkey, for their help during the study and for providing KWWTP process data.
References
[1] D. Hanbay, I. Turkoglu, and Y. Demir, “Prediction of wastewater treatment plant performance based on wavelet packet decompositionand neural networks,” Expert Systems with Applications, vol. 34(2), pp.1038-1043, 2008. [2] R.S. Govindaraju, “Artificial neural network in hydrology.
II:hydrologic application, ASCE task committee application of artificial neural networks in hydrology,” Journal of Hydrologic Engineering vol 5, pp. 124–137, 2000.
[3] H.R. Maier, and G.C. Dandy, “Neural networks for prediction and forecasting of water resources variables: a review of modeling issues and applications,” Water Resources Research vol. 15, pp. 101–124, 2000.
[4] T.R. Neelakantan, T.R. Brion, and S. Lingireddy, “Neural network modeling of cryptoposporidium and giardia concentrations in Delware River, USA,” Water Science and Technology vol 43, pp. 125–132, 2001.
[5] C.S. Akratos, J.N. Papaspyros, and V.A. Tsihrintzis, “An artificial neural network model and design equations for BOD and COD removal prediction in horizontal subsurface flow constructed wetlands,” Chemical Engineering Journal, vol. 143(1), pp. 96-110, 2008.
[6] F.S. Mjalli, S. Al-Asheh, and H.E. Alfadala, “Use of artificial neural network black-box modeling for the prediction of wastewater treatment plants performance. Journal of Environmental Management,” vol. 83(3), pp. 329-338, 2007.
[7] M. M. Hamed, M. G. Khalafallah, and E. A. Hassanien, “Prediction of wastewater treatment plant performance using artificial neural Networks,” Environmental Modelling and Software, vol. 19, pp. 919–928, 2004.
[8] L. Belanche, J. J. Valde´s, J. Comas, I. R. Roda, and M. Poch, “Prediction of the bulking phenomenon in wastewater treatment plants,” Artificial Intelligence in Engineering, vol. 14(4), pp. 307–317, 2000.
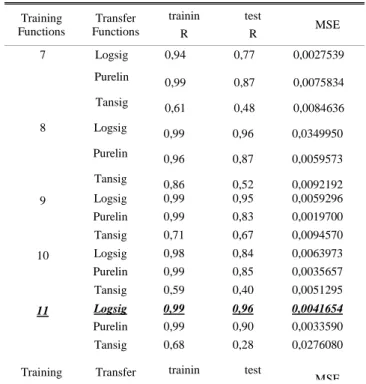
[9] D. J. Choi, and H. Park, “A hybrid artificial neural network as a software sensor for optimal control of a wastewater treatment process,” Water research, vol. 35(16), pp. 3959-Table 4. 3-1-1 Summary of training and transfer functions used for
removal efficiency Training Functions Transfer Functions trainin R test R MSE 7 Logsig 0,94 0,77 0,0027539 Purelin 0,99 0,87 0,0075834 Tansig 0,61 0,48 0,0084636 8 Logsig 0,99 0,96 0,0349950 Purelin 0,96 0,87 0,0059573 Tansig 0,86 0,52 0,0092192 9 Logsig 0,99 0,95 0,0059296 Purelin 0,99 0,83 0,0019700 Tansig 0,71 0,67 0,0094570 10 Logsig 0,98 0,84 0,0063973 Purelin 0,99 0,85 0,0035657 Tansig 0,59 0,40 0,0051295 11 Logsig 0,99 0,96 0,0041654 Purelin 0,99 0,90 0,0033590 Tansig 0,68 0,28 0,0276080 Training Functions Transfer Functions trainin R test R MSE 7 Logsig 0,98 0,81 0,0045913 Purelin 0,66 0,63 0,0113160 Tansig 0,99 0,94 0,0096608 8 Logsig 0,99 0,89 0,0053830 Purelin 0,61 0,50 0,0054988 Tansig 0,99 0,90 0,0058794 9 Logsig 0,99 0,82 0,0067840 Purelin 0,57 0,58 0,0041831 Tansig 0,92 0,86 0,0066576 10 Logsig 0,98 0,87 0,0090310 Purelin 0,74 0,58 0,0041230 Tansig 0,99 0,91 0,0039078 11 Logsig 0,99 0,91 0,0054450 Purelin 0,59 0,65 0,0027967 Tansig 0,99 0,93 0,0040825 Table 5. 3-3-1 Summary of training and transfer functions used for
removal efficiency Training Functions Transfer Functions trainin R test R MSE 7 Logsig 0,98 0,93 0,0078904 Purelin 0,89 0,58 0,0052331 Tansig 0,93 0,86 0,0044014 8 Logsig 0,99 0,87 0,0075730 Purelin 0,88 0,58 0,0058282 Tansig 0,96 0,57 0,0044315 9 Logsig 0,99 0,95 0,0023310 Purelin 0,61 0,38 0,0084474 Tansig 0,99 0,79 0,0058679 10 Logsig 0,99 0,86 0,0071530 Purelin 0,79 0,34 0,0049574 Tansig 0,99 0,83 0,0067905 11 Logsig 0,99 0,79 0,0067391 Purelin 0,61 0,50 0,0043681 Tansig 0,81 0,58 0,0443300 Training Functions Transfer Functions trainin R test R MSE 7 Logsig 0,94 0,77 0,0027539 Purelin 0,99 0,87 0,0075834 Tansig 0,61 0,48 0,0084636 8 Logsig 0,99 0,96 0,0349950 Purelin 0,96 0,87 0,0059573 Tansig 0,86 0,52 0,0092192 9 Logsig 0,99 0,95 0,0059296 Purelin 0,99 0,83 0,0019700 Tansig 0,71 0,67 0,0094570 10 Logsig 0,98 0,84 0,0063973 Purelin 0,99 0,85 0,0035657 Tansig 0,59 0,40 0,0051295
3967, 2001.
[10] K. P. Oliveira-Esquerre, M. Mori, and R. E. Bruns, “Simulation of an industrial wastewater treatment plant using artificial neural networks and principal components analysis,” Brazilian Journal of Chemical Engineering, vol. 19(4), pp. 365-370, 2001.
[11] A. G. El-Din, and D. W. Smith, “A neural network model to predict the wastewater inflow incorporating rainfall events,” Water research, vol. 36(5), pp. 1115-1126, 2002. [12] S. Geissler, T. Wintgens, T. Melin, K. Vossenkaul, and C.
Kullmann, “Modelling approaches for filtration processes with novel submerged capillary modules in membrane bioreactors for wastewater treatment,” Desalination, vol. 178(1), pp. 125-134, 2005.
[13] A.G. El-Din, D.W. Smith, and M.G. El-Din, “Application of artificial neural networks in wastewater treatment,” Journal of Environmental Engineering and Science, vol. 3(S1), pp. S81-S95, 2004.
[14] S. Yordanova, R. Petrova, N. Noykova, and P. Tzvetkov, “Neuro-fuzzy modelling in anaerobic wastewater treatment for prediction and control,” International Journal of Computing, vol. 5(1), pp. 51-56, 2014.
[15] Y. M. Guo, Y. G. Liu, G. M. Zeng, X. J. Hu, W. H. Xu, Y.Q. Liu, and H. J. Huang, “An integrated treatment of domestic wastewater using sequencing batch biofilm reactor combined with vertical flow constructed wetland and its artificial neural network simulation study,” Ecological Engineering, vol. 64, pp. 18-26, 2014.
[16] M. Bagheri, S. A. Mirbagheri, M. Ehteshami, and Z. Bagheri, “Modeling of a sequencing batch reactor treating municipal wastewater using multi-layer perceptron and radial basis function artificial neural networks,” Process
Safety and Environmental Protection, vol. 93, pp. 111-123, 2015.
[17] P. Kundu, A. Debsarkar, S. Mukherjee, and S. Kumar, “Artificial neural network modelling in biological removal of organic carbon and nitrogen for the treatment of slaughterhouse wastewater in a batch reactor,” Environmental technology, vol. 35(10), pp. 1296-1306, 2014.
[18] G. B. Gholikandi, S. Jamshidi, and H. Hazrati, H. “Optimization of anaerobic baffled reactor (ABR) using artificial neural network in municipal wastewater treatment,” Environmental Engineering and Management Journal, vol. 13(1), pp. 95-104, 2014
[19] V.N. Delgrange, N. Cabassud, M. Cabassud, L. Durand-Bourlier, and J.M. Laine, “Neural networks for prediction of ultrafiltration transmembrane pressure: application to drinking water production,” Journal of Membrane Science vol. 150, pp. 111–123, 1998.
[20] H. Demuth, M. Beale, and M. Hagan, “Neural Network Toolbox 5: Users Guide” Natick, MA, The MathWorks Inc., 2007.
[21] M.S. Nasr, M. A, Moustafa, H. A. Seif, and G. El Kobrosy, “Application of Artificial Neural Network (ANN) for the prediction of EL-AGAMY wastewater treatment plant performance- EGYPT,” Alexandria Engineering Journal, vol. 51(1), pp. 37-43, 2012.
[22] A.R. Khataee, G. Dehghan, A. Ebadi, M. Zarei, and M. Pourhassan, “Biological treatment of a dye solution by Macroalgae Chara sp.: effect of operational parameters, intermediates identification and artificial neural network modeling,” Bioresource Technol, vol. 101(7), pp. 2252-2258, 2010