*
Steady and transient flow structure in a rotameter with a ball
float
Eyub CANLI*, Ali ATES
Selcuk University, Mechanical Engineering Department, 42003 Konya, Turkey
Abstract. Dimensions and material specifications of a commercial rotameter were used for investigating steady and transient flow structure in a rotameter with a ball float. Since drag coefficient of sphere versus Reynolds number is well known and the range of the commercial rotameter is given, the investigation relies on strong validation data. An axially symmetric geometric model is used for steady analysis of the system as the initial step of the investigation. Assessing the proper mesh structure and turbulence model is aimed for this step. Then full three dimensional solid model is put into transient analysis with RANS and LES models. Vortex shedding frequency, Strouhal number and drag coefficient values are evaluated. Vortex induced vibrations are assessed according to transient results. The work is a preliminary study for future investigation on rotameter floats. The framework of future studies is also presented.
1 Introduction
Rotameters or variable area flowmeters are widely used instruments for measuring fluid flow rates and for indicating flow in the industry and in various sectors. They rely on the force balance on a float. The balancing forces are drag force due to the fluid flow and another force acting on the float by means of a mechanism. Usually the mechanism to form a balancing force is the gravitational force. A detailed explanation is given in the second section.
Drag force is highly depending on the float geometry and this leads to unlimited possibility for rotameter design. Considering the fact that rotameters are designed mostly for a single fluid specific gravity, compensation for various specific gravities and selecting the right rotameter also necessitate knowledge about drag force depending on float geometry. It can be easily said that there is a research potential.
Previously, some preliminary proceedings were done by the present authors [1-4] but only abstracts are available. Therefore this paper sums up the conducted work and presents details. Some significant conclusions of those works are: drag coefficient of a float has different values depending on the situation of the float as it is in the free stream or it is confined by walls parallel to the flow; 2D axisymmetric CFD simulation with RANS models can be used for drag coefficient determination with the aid of a coarse mesh and very cheap computational cost; there is still interest on the float and rotameter topic in terms of academic research, inferring from the literature survey; results and data of academic work are also useful for compensation of rotameter scales when the operation fluid and their properties change.
It is worth to mention some recent works from the literature before proceeding further. Since the topic is related with commerce activities, most of the reports are in international patents. 7480 patent results can be reached by using “rotameter” keyword in Google Patents [5]. 137000 and 32300 results can be reached for “variable area flow meter” and “float flow meter” keywords respectively. However some of the results are indicating same patent and most of the results are from patents in which a rotameter is used for measurement. For the recent patents, only 9 results are listed for “rotameter” keyword in 2006. It is very hard to find data on specific rotameter floats.
ScienceDirect platform of Elsevier reveals 13900 results for “rotameter” keyword [6]. However, most of them are the studies in which a rotameter is used. Only 14 direct studies can be detected among them. It is obvious that there are more studies but the ones that are viewed so far are enough to draw a frame for the topic. The works are summarized below.
Dijstelbergen reported and proposed an equation of motion for the float of a rotameter [7]. A sinusoidal pulsation is assumed in order to implement its possible effects on the reading. The calculated mean flow are compared with measurements. Float dimensions are said to have a reduction on the error amount of indicated mean flow. The float instability, especially for gases, are also investigated by means of theoretical and experimental means. Author emphasized the importance on defining dynamic behavior of the floats. The author focused to the flow passage narrowing due to the flow jet passing through the float in order to derive an equation of motion. By the pulsating flow, inertia of the float also has an effect on the operation. A motor was utilized in order to produce sinusoidal pulsations, while water in a tank flows due to potential energy. By means of a light
beam and a phototransistor, it could be possible to detect the instability of the float.
The work of Li et al. uses a very reliable flow rate validation tool, i.e. The Bell Gas Flow (Bell Prover) in order to assess the measurement of a rotameter; accompanied with a coil in order to transmit measurements by electrical signals [8]. When the float rises or changes its location, the inductance on the coil changes and this change is converted and recorded by means of auxiliary equipment. According to their results, electrical measurement setup and transmission for remote access are reliable and also improves accuracy.
A very significant and remarkable paper is reported by Bückle et al. [9]. They used Laser Doppler Anemometry (LDA) for their experimental investigation and they also used a CFD code. As a general conclusion of theirs, CFD means are found very useful before prototyping phase. Authors also suggested that CFD highlights the difficult parts of the experimentation. In order to overcome the optical issues of LDA considering the curvy surfaces of the rotameter glass and refraction due to the glass and the curvy surfaces, they used refractive index matching. Authors also emphasized that semi-empirical methods were widely used for flow metering previously when CFD means and advanced laboratory equipment was not exist or accessible. Rotameters are identified appropriate for pipe diameters smaller than 100 mm. In their literature survey, they underline that experimentally determined flow coefficients can be used for different rotameter tubes if geometric similarity exists. They also proposed that experimental studies are needed for laminar-turbulent flow transition and show LDA as a candidate for non-intrusive velocity measurement technique. They conducted the experiments for laminar flow. In the LDA experiments, they observed asymmetry in velocity profiles while there is also a difference of the velocity profile that is expected to be parabolic. Authors think that the conical shape of the tube and minor mounting issues may be the reasons. A good agreement of experimental and CFD results is said to be achieved. However there is a divergence in the wake region.
Another report from almost same authors, Bückle et al., in a technical note, gives information about further CFD work [10]. In this technical note, authors identify the responsible factors on the discrepancies between CFD and LDA results; which were previously suspected phenomena. Authors find previous number of nodes sufficient and detect the float axial rotation and minor flow asymmetry as the reasons of the discrepancies. However, for the commercial floats, 1 Hz rotation frequency is said to be used for float stability and this frequency value has insignificant effect on the discrepancy between CFD and LDA results. Inferring from these comments, it can be concluded that experimentation should be very carefully conducted for the wake region of the rotameter float and can be regarded as a difficulty for empiricism.
A specific and interesting experimental work is reported by Ordolff for float shape and specific gravity in rotameters for milk flow metering [11]. Milk metering with rotameters is interesting due to two reasons; float is
not visible in the milk and milk has variable specific gravity. Author suggests that rotameter placed after air-milk separation is affected less from the variable specific gravity. A float specific gravity around 0.7 g/cm3 is said
to give the most accurate results. If the rotameter is desired to be used before air separation, author proposes a float specific gravity around 0.5 g/cm3, a conical shape
and relatively longer vertical axis. Although relatively low specific gravity of the floats were proposed for aerated milk, a tradeoff between reading bias and accuracy is also reported.
Tanyildiz and Eren proposed a new technique for manufacturing rotameters, eliminating the need for machining for polycarbonate tubes [12]. The interesting point is the inner shape of the rotameter tube. It is rather parabolic, not conical. This makes area change steeper at the bottom parts and smoother at the upper parts. Authors claim that this enables linearity of the rotameter scale since the area change versus axial distance is different than quadratic due to the parabolic shape. However it is hard to find a specific information about the float and the work is an experimental one.
Singh et al. propose a horizontal float and an orifice in order to maintain the pressure drop due to the flow metering constant for different flow rates [13]. The justification for the constant pressure drop for different flow rates is said to be the specifications of some industrial installations. Authors use experimentation and also FLUENT CFD code in order to do their examination. During experiments, the proposed float was inserted in the orifice gap at different ratios in order to measure pressure differential and calculate discharge coefficient. The discharge coefficient is used for CFD validation and CFD results are used further in order to calculate drag coefficient of the float. However, the details of the CFD are not provided in the paper and a reference is given for only the formulation. It is not possible the view the mesh, flow domain etc. An interesting determination from the text is that literature about variable area flowmeters is found scant and the reason is explained as commercial confidentiality. While a displacement of the float is changing linearly with the flow rate for a limited range of displacement, this range is not the same range of displacement for the constant pressure differential. In overall, paper reveals that there is more work to be done in order to develop a device for the aimed purpose.
Belforte et al. reported a test bench in order to calibrate flowmeters and tested some commercially available rotameters [14]. They stress that some of the compensation formulas that are provided by the manufacturer lead to errors according to the test bench results. From this, it can be inferred that simple compensation may not be a good solution for a given application and deeper insight of the rotameter to be used can be beneficial to obtain a more accurate scale.
Perforated tube rotameter in which the conical tube is replaced with a normal cylindrical one is proposed by Danckwerts and Sikder [15]. Since the increasing upstream static pressure due to the increasing flow rate is compensated by the outflow from the pores on the perforated tube, flow rate can be measured by the
displacement of the usual rotameter float. They stated that a linear change for the displacement against changing flow rate is attainable for relatively low flow rates.
Harrison and Armstrong investigated the dynamic behavior of a rotameter float and proposed a simplified differential equation in order to calculate the response of the float [16]. As the angular velocity increases, float specific gravity decreases and viscosity increases, there is significant difference between the calculated and measured values. This work is a good reference for the transient CFD simulations because the response of the investigated floats should be taken into consideration for arranging time steps. Also, preparation for the investigations and preliminary work can use the proposed formula.
There are also standards, useful for developing understanding on the rotameters and their floats [17, 18]. Especially calibration and measurement procedures provide formulas and equations that can be used during various analyses relating to the rotameter and float research.
In this work, a CFD analysis of a ball float rotameter is conducted. It is a preliminary step forward to a more comprehensive work which is outlined in the next section. By the developed understanding using and evaluating presented results, some inference is done towards future work.
2 Outline of the investigation
In this section, the main goal and aims of the present research and its role on the future work are outlined. The details of the CFD approach are given.
2.1 Framework
Three topics that are highly depend on qualified human skills and knowledge related to utilization of rotameters can be identified as:
Compensation of the rotameter scale for changes of fluid and operation properties and sometimes fluid itself
Selecting the proper rotameter for a specific task
Design of the rotameter and float for a variety of ranges
Our previous surveys revealed that companies and individuals producing, selling and using rotameters are relying on engineers almost constantly. A software that could aid in decision making during the utilization, selection and production of the rotameters would be more than appreciated. However such a software would need a comprehensive and complex background data, algorithm and formulae in order to satisfy the desired specifications. To compile the needed data and to prepare the desired algorithm and mechanisms, a work plan was prepared. The plan can be summarized with the below list of work.
CFD analyses of common float geometries and newly introduced float geometries for wide range of Reynolds numbers in order to obtain drag coefficient data
o Statistical tools for reducing trial numbers
o Analytical means, regression & machine learning for correlating Re and drag coefficient
Analytical means in order to form an equation between balancing forces on the float by means of float characteristic length
Compiling properties of float materials and fluids for common applications
Preparing a scheme for building dimensions of the rotameter tube
o Including machine learning tools such as Fuzzy Logic and ANFIS
Algorithm and coding
The backbone of the work relies on the CFD simulations for correlating Reynolds number and drag coefficient but the preliminary works showed that confined float behavior is very different than the behavior of float in a free stream [1-4]. Float design and rotameter tube have big effects on the linearity of axial displacement of the float versus flow rate change. Also there are a lot of examples in the market, showing non-linear scales. It is also understood that wake of the floats are very different from the floats in free stream due to jet flow between the float and the walls of the rotameter tube. Therefore it is desired to make CFD simulations of a commercially available rotameter and evaluate the results for future work.
2.2 Commercially available rotameter
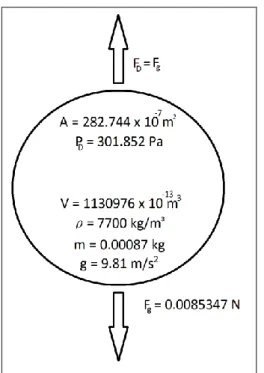
Ball floats and rotameters with ball floats are mostly used for low gas flow rates. They are generally used for medical installations. A ball float rotameter was obtained from a retailer in Konya industry. Its dimensions and float material was examined. Figure 1 is given in order to present the scale and the dimensions of the rotameter. The force balance is given in Figure 2 schematically.
Fig. 1. Schematic for the dimensions of the selected rotameter
Fig. 2. Schematic force balance at the float
As seen in Figure 2, the force balance is always the same for the scalable or measurable range of the rotameter.
1
22
D D D r D r
F
C
P
A
C
A
(1) WhereF
D is drag force,C
D is drag coefficient,P
D is net pressure value on the sphere surface,A
r is the smallest cross flow area between rotameter walls and sphere,
is fluid density,
is fluid velocity. Three parameters in eq. (1) are unknown for different flow rates of the scale. Those are drag coefficient, fluid velocity and density of the fluid if there is a significant effect of compressibility. One can think that a drag coefficient data of sphere can be used to calculate the two unknowns iteratively by assuming the density constant. However, previous works showed that the freestream drag coefficient is different than drag coefficient of confined sphere [1-4]. And it is very hard, if it is not impossible, to find a data for a specific confinement. Therefore, conducted CFD work reveals values of these unknowns.
Some photographs of the rotameter are given in Figure 3.
(a)
(b)
(c)
(d)
2.3 CFD setup
Steady and transient simulations are presented in this paper. Steady simulations target to find drag force while transient simulation focuses to vortex shedding frequency considering the vortex induced vibrations on the float.
Steady simulations were done first with RANS models. They are compared with each other. The favorable model was also used for transient simulation and then compared to Large Eddy Simulation (LES).
Since rotameters and their floats are axisymmetric and this is the case for the current rotameter, a 2D axisymmetric flow domain, containing only fluid part is enough to get the desired values. The measured dimensions of the commercially available rotameter are then used for the 2D geometry. The 2D geometry figures are given in Figure 4. The dimensions are already provided in the previous figures.
Fig. 4. 2D CFD geometry
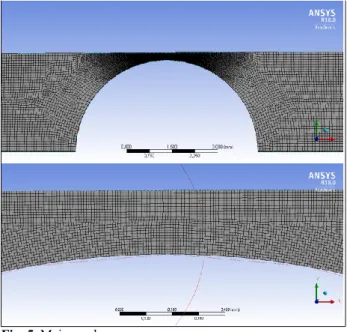
A zero thickness mesh was structured by using proximity function of the meshing module of the software. For the proximity function, number of cells between the gap was selected as 40. By using this function, the narrowest part of the domain is equipped with the finest cells. By making the relevance “100” and relevance center “fine”, 59215 cells and 60791 nodes are obtained. Some figures of the mesh are given in Figure 5.
Fig. 5. Main mesh
Mesh refinement for checking independency from the mesh is done by the mesh adaptation in FLUENT. It will be mentioned in the next section, alongside the obtained results, in the comparison of RANS models.
Viscous-Laminar (VL), k-ϵ, k-ω are used for 2D steady simulation. The mesh element number is four times bigger than the main mesh element number when the first mesh adaptation is done. Only mesh of k-ϵ was adapted again to get the finest mesh.
Solver was set to double precision and parallel computing option was selected. Steady, pressure based, axisymmetric 2D flow arrangements for each viscous flow model were ensured. Only boundary conditions to be inputted are inlet and outlet boundary conditions since no special arrangement is needed for wall and axis boundaries. 1.94 m/s uniform velocity inlet and 0 Pa gauge pressure outlet were inputted. Although schemes, numerical methods and relaxation factors were varied due to obtain a converged calculation, following arrangement was experienced to give better performance; SIMPLE scheme, Green Gauss node based, Second Order Pressure discretization and power law discretization for the convective and diffusive terms. The relaxation factors were lowered at the early parts of the iteration and when fluctuations on the residual plots can be viewed, they were returned to their default values.
Force acting on the sphere wall in flow direction and area weighted average of the static pressure acting on the sphere wall were calculated by the post processing of steady results. Contours of velocity magnitude and static pressure were also drawn.
K-ω and LES were selected for the transient analyses. LES necessitated 3D geometry and accordingly mesh. 3D geometry and mesh views are presented in Figure 6. It is actually the revolved 2D geometry. Again, only fluid exists in the domain and no solid volumes are modeled and meshed.
Fig. 6. 3D geometry and mesh
Triangular elements are seen due to the shape of the sphere. 2176446 cells and 820862 nodes are presented. Inflation was applied to the solid boundaries in order to resolve boundary flow. Additional to the indicators same with the steady analyses, FFT analyses were done in order to evaluate vortex shedding from the surfaces and in the wake of the sphere. The point where point data were collected is shown in Figure 7.
Fig. 7. Point from where the FFT data were collected Results are given in the next section.
3
Results
Drag force and area weighed average of the static pressure on the float surface according to mesh elements and viscous flow models are presented in Table 1.
Table 1. Drag force and static pressure on the float
Drag Force (N)
Ar. Weig. Av. St. Pressure
(Pa) V-L Ref. Mesh. Std. Mesh 0.00374 0.00372 41.60 41.95 k-ω Std. Mesh 0.00379 33.92 Ref. Mesh. 0.00375 33.89 k-ϵ Std. Mesh 0.00354 33.68 Ref. Mesh. 0.00339 30.36 Two times Ref. Mesh. 0.00320 26.25 k-ϵ Coarse Mesh 0.00207 16.22 k-ϵ
with Enhanced Wall Treatment
Std. Mesh 0.00353 30.04 Ref. Mesh. 0.00352 29.46
k-ω transient Std. Mesh 0.00291 53.44
LES Std. Mesh 0.00288 50.72
Referring to Table 1, the refined mesh has 236860 cells and 239949 nodes. When additional refinement is done by mesh adaptation, the cell number increases to 947440 and node number increases to 953369. Adaptation level was kept as 2. The figures of refined meshes are given in Figure 8.
a
b
Fig. 8. a. Refinement with one adaptation b. Refinement with two adaptations
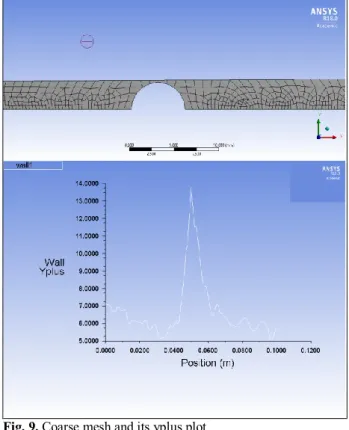
Since k-ϵ yielded results changing by the mesh refinement, a coarse mesh for increasing yplus values and enhanced wall treatment with standard mesh were tried. However they didn’t give accurate results. The coarse mesh and its yplus plot are given in Figure 9. The yplus plot of the enhanced wall treatment (EWT) is given in Figure 10. Coarse mesh has only 1003 cells and 1170 nodes. It is understood from the figures that relatively small diameter of the rotameter tube builds very high boundary flow in terms of yplus. Therefore using standard wall function necessitates a very coarse mesh; almost three elements in radial direction which is not appropriate for this CFD case.
Fig. 9. Coarse mesh and its yplus plot
a
b
Fig. 10. a. Standard mesh yplus plot with EWT b. Refined mesh yplus plot with EWT
Since drag force and static pressure results are consistent for steady and transient analyses, it is concluded that the specific gravity of the float must be lower than the suspected stainless steel specific gravity. Actually it is almost half of the 7700 kg/m3 value. The
calculated specific gravity of the float is 3335 kg/m3.
This reveals how manufacturers modify their equipment and produce special properties. Drag coefficient is not necessarily calculated since drag force can be directly calculated. However drag coefficient for this setup is about 0.84. The Reynolds number for the fluid velocity at the shortest gap between the float and the rotameter wall is 6410. The free stream drag coefficient for this Re is 0.4.
An instance point data for the FFT calculations is presented in Figure 11. This point data is then used for FFT. FFT plots are given in Figure 12.
k-ω FFT of first point data for 0.01 seconds time steps
k-ω FFT of second point data for 0.01 seconds time steps
k-ω FFT of first point data for 1 seconds time steps
k-ω FFT of second point data for 1 seconds time steps
LES FFT of first point data for 0.1 seconds time steps
LES FFT of second point data for 0.1 seconds time steps
Fig. 12. FFT plots of the point data
As it can be seen from Figure 12, k-ω FFT revealed 0.35 Hz frequency independent from time step size. The dominant frequency of LES revealed a value less than 0.01. However, concluding from the velocity contour animation, wake of the LES simulation seems more realistic and hence, the FFT results of LES may be found more proper. Wake of the k-ω transient simulation exhibit an asymmetry as it will be shown in the following figures. Strouhal number, when the dominant frequency of 0.35 that appears for all k-ω transient cases is used, can be calculated as 1.26 x 10⁻⁴. At this low
Strouhal numbers, oscillations are dominated by the high speed flow. Normally, Strouhal number for Reynolds numbers around 6000 is 0.2. For the frequency values lower than 0.01, which is the case for LES simulation, Strouhal number is very low. Therefore it is very hard to mention about vortex induced vibrations on the float. That should be the reason of ball floats used in low flow rates with very small angles of conical rotameter tubes.
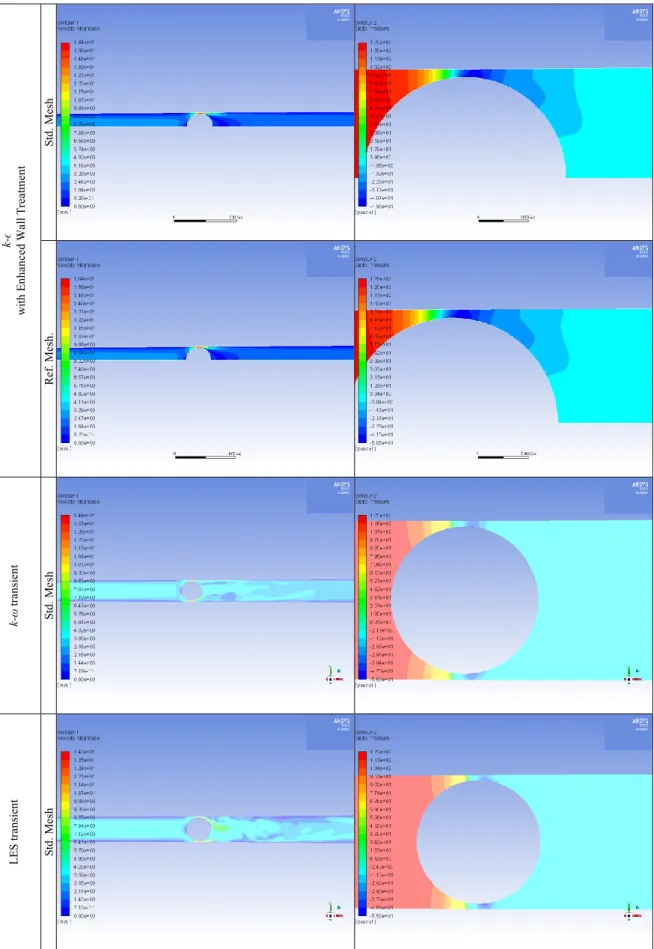
The velocity magnitude and static pressure contours are given for the conducted simulations in Figure 13.
L am in ar St d. M es h Re f. M es h. k-ω St d. M es h Re f. M es h.
k-ϵ St d. M es h Re f. M es h. T w o tim es Re f. M es h. k-ϵ Co ars e M es h
k-ϵ w ith E nh an ce d W al l T re at m en t St d. M es h Re f. M es h. k-ω tra ns ie nt St d. M es h L E S tra ns ie nt St d. M es h
Fig. 13. Velocity and static pressure
Contour images revealed similar trends for VL and k-ω steady cases. However k-ϵ yielded relatively different wake. The wake asymmetry in k-ω transient simulation remained almost all time steps while LES velocity
contours were more realistic through the simulation. Still, the pressure and velocity results of the transient analyses are consistent with each other. Velocity and
pressure results of the steady analyses are slightly higher than the transient analyses.
4 Conclusion
This work is a preliminary step towards a more comprehensive work, in which data of various rotameter floats are desired to be contained. The planned work outline introduced, literature reviewed and an initiation step CFD simulation is conducted by using commercially available rotameter dimensions and scale.
It is inferred from the obtained results that drag force can be obtained with the least effort and cost of CFD means. However the situation is very different for transient analysis and wake evaluation. It still remains costly in terms of computation power and storage space. Also transient analysis involves additional post processing steps.
The wake of the sphere confined by the rotameter walls is very different than the wake of a sphere immersed in a free stream. The jet flow through the narrowest annular and the secondary flow structures alter the wake.
The float density is found as 3335 kg/m3 according to
the calculated velocities and force. The drag coefficient is 0.84 and Strouhal number is about 1.26 x 10⁻⁴.
It is understood that future CFD work should be carefully designed and parameter values and steps should be lowered in order to reduce work load using statistical and analytical means.
The 3D LES simulation with better mesh structure, sufficiently small calculation residuals, highly resolved wake and multipoint data collection for different time step sizes are targeted for future work.
Authors would like to acknowledge the financial support of Selcuk University Scientific Projects Coordinatorship (S.U. BAP) with 17401147 and 18701552 numbered projects.
References
1. A. Ates, E. Canli, ICENTE’17, pp. 104, (2017) 2. E. Canli, A. Ates, ICENTE’17, pp. 110, (2017) 3. A. Ates, E. Canli, IMSMATEC’18, pp. 424, (2018) 4. A. Ates, E. Canli, IMSMATEC’18, pp. 432, (2018) 5. https://www.google.com/?tbm=pts
6. https://www.sciencedirect.com/
7. H.H. Dijstelbergen, Chemical Engineering Science, 19 (1964)
8. X. Li, Y. Liang, L. Fang, Q. He, Y. Zhang, AASRI Procedia, 3 ( 2012 )
9. U. Bückle, F. Durst, B. Howe, A. Melling, Flow Meas. Instrum., 3(4) (1992)
10. U. Bückle, F. Durst, H. Köchner, A. Melling, Flow Meas. Instrum., 6(1) (1995)
11. D. Ordolff, J. agric. Engng Res., 43 (1989) 12. V. Tanyıldızı, H. Eren, Measurement 39 (2006) 13. S.N. Singh, B.K. Gandhi, V. Seshadri, V.S.
Chauhan, Flow Measurement and Instrumentation 15 (2004)
14. G. Belforte, M. Carello, L. Mazza, S. Pastorelli, Measurement, 20(1), (1997)
15. P.V. Danckwerts, A.K. Sikder, Chemical Engineering Science, 13, (1960)
16. G.S. Harrison, W.D. Armstrong, Chemical Engineering Science, 1 (1960)
17. Anonymous, D3195/D3195M − 10 (Reapproved 2015)