Abstract
In this study, it was aimed to introduce the Bootstrap technique and to reveal the relationship between measurements of yolk color fan grades and digital colorimeter that is used for determining the yellow color of egg by utilizing this technique. For this purpose, a total of 1350 samples of 15 color grades of Roche yolk color fan and L* (lightness), a* (redness), b* (yellowness) values in the same samples were compared. The means, standard errors and confidence intervals for each color parameters of fan grades have been demonstrated by the Bootstrap technique. The grades of Roche yolk color fan in terms of L* values have been divided into 10 groups (P<0.01), while only divided into 9 groups in terms of b* values (P<0.01). According to the means of Redness (a*), all of the Roche yolk color fan grades (15 grades) have been determined as independent from each other (P<0.01). With the Bootstrap method, the standard error values of means were decreased by 42.03%, 35.38% and 30.24%, respectively, and the confidence intervals were narrowed by the ratio of 42.03%, 35.38% and 30.24%, respectively. The results of the study were compared with the results of the study that was conducted by using Roche yolk color fan which is cheaper but less reliable and by using digital colorimeter method which is expensive but reliable.
Keywords: Bootstrapping, Resampling, Egg yolk color fan, Digital colorimeter
Hayvancılık Alanında Bootstrap Tekniğinin Bir Uygulaması:
Yumurta Sarı Rengi Örneği
Özet
Bu çalışmada Bootstrap tekniğinin tanıtılması ve bu metottan faydalanarak yumurta sarı renginin belirlenmesinde kullanılan yumurta sarı renk yelpazesi ve dijital renk ölçüm cihazı ölçümleri arasındaki ilişkinin ortaya konulması amaçlanmıştır. Bu amaçla Roche sarı renk yelpazesinin 15 renk sınıfına ait toplam 1350 örnek ile aynı örneklerde ölçülen L* (parlaklık), a* (kırmızılık), b* (sarılık) değerleri karşılaştırılmıştır. Yelpaze sınıflarının her renk parametresine ait ortalamaları, standart hataları ve güven aralıkları Bootstrap tekniğiyle ortaya konulmuştur. L* değerleri bakımından Roche sarı renk yelpazesi 10 gruba ayrılırken (P<0.01), b* değerleri bakımından sınıflar sadece 9 gruba ayrılmıştır (P<0.01). Kırmızılık (a*) ortalamalarına göre ise Roche sarı renk yelpaze sınıflarının tümü (15 sınıf) birbirinden bağımsız olarak tanımlanabilmiştir (P<0.01). Bootstrap yöntemi ile L*, a* ve b* ortalamalarının standart hata değerleri sırasıyla 42.03%, 35.38% ve 30.24% azalmış, güven aralıkları 48.10%, 55.43%, 34.47% oranlarında daralmıştır. Araştırmadan elde edilen sonuçlar kullanılarak mevcut literatürde daha ucuz ama güvenilirliği düşük olan Roche sarı renk yelpazesi ile yapılan çalışmalar ve pahalı ama güvenilir yöntem olan dijital renk ölçüm cihazı kullanılarak gerçekleştirilen çalışma sonuçları karşılaştırılmıştır.
Anahtar sözcükler: Bootstrapping, Yeniden örnekleme, Yumurta sarı renk yelpazesi, Dijital renk ölçer
An Application of Bootstrap Technique in Animal Science: Egg
Yolk Color Sample
Doğan NARİNÇ
1
Ali AYGÜN
2Hande KÜÇÜKÖNDER
3Tülin AKSOY
4Eser Kemal GÜRCAN
51 2 3 4 5
Namık Kemal University, Faculty of Veterinary Medicine, Department of Genetics, TR-59100 Tekirdağ - TURKEY Selçuk University, Faculty of Agriculture, Department of Animal Science, TR-42100 Konya - TURKEY
Bartın University, Faculty of Economics and Admninistrative Sciences, TR-74100 Bartın - TURKEY Akdeniz University, Faculty of Agriculture, Department of Animal Science, TR-07100 Antalya - TURKEY Namık Kemal University, Faculty of Agriculture, Department of Animal Science, TR-59100 Tekirdağ - TURKEY
INTRODUCTION
In order to estimate the parameters of any population, a set of observations (sample) which is considered to represent the mass in question has been used. Since
obtaining all of the observations of the population is not possible most of the time, the sample set to make parameter estimations should be sufficient in quantity and quality [1]. There can be some problems related to
the sample size in statistical analysis especially in animal
İletişim (Correspondence)
+90 282 2504705
[email protected]science. Due to the failure to meet the assumptions in such cases, it is not possible to be able to obtain appropriate statistics or possible to obtain biased or erroneous results. By using resampling or Monte Carlo simulation methods, some solutions can be generated in the face of such problems. The data set is generated according to the assumptions and theoretical basis in Monte Carlo method, whereas the data set is created using real raw material in the resampling approaches [2]. Many resampling methods have
been reported in the literature, but the most used ones are Randomization Exact Test, Bootstrap, Jackknife and Cross-Validation methods. By using Bootstrapping developed by Efron [3], the Bootstrap samples are being created in varying
amounts and sizes by randomly changing the places of the observations in a data set of any size. Each sample in this method is treated as the actual population and an experimental distribution for the estimator is created by repeating this obtained sample many times [4].
The Bootstrap method is also advantageous to reduce the computational burden in solving intensive mathema-tical formulas. The Bootstrap method is quite useful in terms of demonstrating the reliability of an estimate based on sample data sets taken from the population and determining approximate confidence intervals of the para- meters [5]. In case that the assumptions made regarding the
error terms and the independent variables do not satisfy, the Bootstrap method which is used for the correction process. Bootstrap method has been developed in order to obtain the smaller estimation errors, and the reduction of the standard deviations, and accordingly to obtain more reliable parameter estimators and to create the confidence intervals [6]. Today, in parallel with the modern
developments in statistical calculations, some progress has been made in the Bootstrap method and its use in applied statistics has become widespread. The use of the Bootstrap method has increased highly especially in the areas of molecular genetics [7-9], population genetics [10],
phylogenetics [11] and virology [12].
There are limited studies conducted with the Bootstrap approach in the area of animal science. Adams and Anthony [13] who study animal behaviors analyzed their
data, which does not show a normal distribution, both with non-parametric methods and with resampling approach. The researchers have stated that the Randomization test is more powerful than the Kruskal-Wallis test. In another research on animal behaviors [14] the variability of hypo-
thesis testing results in the original data and the data obtained by resampling approach have been demonstrated. Robison et al.[15] utilized the Bootstrap method in the
genetic parameters estimated for some reproductive characteristics in sheep. In the study, it has been suggested that the standard errors of genetic parameters decrease with the Bootstrap method. Takma and Atıl [16] indicated the
confidence intervals of the means of egg weight of the 40th
week of laying hens with the Bootstrap method. The same
researchers suggested that there is a difference in terms of body weight of the 3rd week in broilers fed with two
different rations at 0.05 significance level; however, after the Bootstrap performed application they demonstrated that this difference results from the Type-I Error [16].
Yolk color is one of the interior egg quality characteristics and is the subject of scientific studies for many years. In some cultures, it is believed that dark colored eggs evoke natural egg and poultry feeding studies have been carried out in this respect. The egg yolk color preferred by consumers can be provided with natural colorants in forages (carotenoids in corn, green plants, peppers, various flowers) and artificial ingredients added to the forages [17]. In this study, it was aimed to demonstrate the
relationship between the two methods of yolk color fan and digital colorimeter measurements that are used in the determination of the yellow color of eggs. For this purpose, a total of 1350 samples of 15 color grades of yolk color fan have been associated with the values of L* (lightness), a* (redness), b* (yellowness). Then, the confidence intervals of the each color parameter of the scale values have been demonstrated by both the original data and the Bootstrap method.
MATERIAL and METHODS
The study was conducted at the Poultry Research Unit of Selcuk University, Faculty of Agriculture, Department of Animal Science in Konya. All color measurements were carried out in a non-air stream environment and under constant light intensity. The methods used to measure the color of the yolk and the statistical methods have been respectively indicated below.
Measurements of Egg Yolk Color
There are two approaches for the color. These are; the classification of different colors according to systems, the former approach that includes rankings and compliances and the scientific approach in which the presence of color is believed to be depended on the human eye and on light [18]. There are many color systems developed for
color measurement. These are divided into two systems including the systems that are dependent on a device (RGB, CMY, HSV, HLS etc.) and the ones that are independent from a device (CIE XYZ, CIE LUV etc.). The independent systems have been developed by CIE (Commission Inter-nationale de L’Eclairage). The scientists have produced a variety of methods for nearly 100 years to measure the color of the yolk. Some of them are “Heimann-Carver yolk color index”, “Fletcher color rings” and Roche yolk color fan (12 grades) [19]. Currently, the most widely used method is
the Roche yolk color fan (15 grades). The measuring system of Roche yolk color fan has been created on the basis of XYZ color system standardized by CIE. The X, Y and Z values are the total of the stimulations sent to the brain
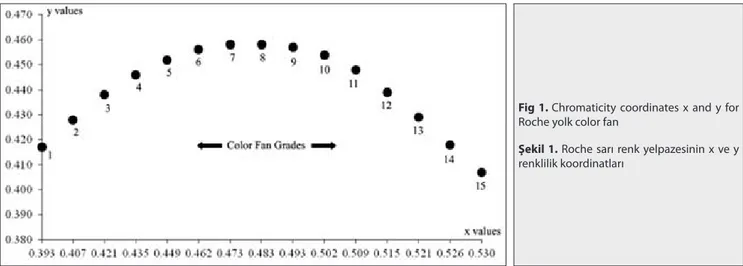
from the nerves providing the perception of to the three primary colors (red, green, blue). The ratio of all three stimulations to the total amount of each stimulation defines the color. Accordingly, the perception rate of red is x=X/(X+Y+Z), the perception rate of green is y=Y/(X+Y+Z), the perception rate of blue is z=Z/(X+Y+Z). Theoretically, the equation of x+y+z=1 is the basis, and the equation of x=y=z=1/3 refers to white color [18]. The Chromaticity
coordinate values of Roche yolk color fan are given in Fig. 1. Today, electronic devices called colorimeter are used in color measurement in foodstuffs. These devices analyze the color data of the object based on a standard color calibration. In this study, Minolta Chroma-meter (Minolta corp.) color measuring device has been used. As the CIE L* a* b*color system was often used for color measurement in recent years, the data of this system has been collected with this mentioned color measurement device. The color model of CIE L* a* b* was widely used in describing all the colors that can be detected by the human eye. It has been developed specifically for this purpose by CIE. Lab color theory; Munsell color system has been built on 1948 Hunter color space and 1976 CIE color space [18]. Three parameters
in the model indicate the luminousness of the color (L* refers to L*=0 black and L*=100 white values), its position between red and green (a*, negative values indicate green while positive values indicate red) its position between yellow and blue (b*, negative values indicate blue while positive values indicate yellow).
In this study, 90 samples were taken from each 15 grades of Roche yolk color fan constructed according to the XYZ color system and the samples were measured with Minolta Chroma-meter according to the CIE L* a* b* color system.
Statistical Analyses
An analysis of variance was carried out in order to compare the L*, a*, b* means of the samples taken from a total of 15 grades. The Tukey’s comparison test was applied in order to demonstrate the differences of the
L*, a*, b* means of the grades. After determining the distributions of the grades, the descriptive statistics and confidence intervals were obtained. After these steps, the same applications were repeated using 1000 Bootstrap samples. Each group in Bootstrap technique (n=90, N= 1350) were applied with the probability of 1/1000 by switching observations in order to obtain the S(xi) statistics within themselves. Thus, the randomized Bootstrap sample data set x*i=(x1, x2, x3,...,x1000) was obtained. The
above-mentioned statistics were applied in each Boot-strap sample. The statistical analysis was carried out using the SAS 9.3 program [20].
RESULT
The original L*, a*, b* means of Roche yolk color fan grades, the standard error values and confidence intervals are given in Table 1, Table 2, Table 3, respectively. According to the performed analysis of variance results, the differences between both L*, a* and b* means were found significant (for three parameters P<0.01). The compatibility of Roche yolk color fan grades with L*, a*, b* values measured with the help of a device were found 90.12%, 99.14%, 38.82%, respectively (P<0.01 for all three). The results for Tukey’s range test for L*, a*, b* means according to Roche yolk color fan grades are given in Table 1, Table 2, Table 3. As seen in Table 1, no statistically significant difference has been found between 1st-2nd, 4th-5th, 7th-8th grades in terms
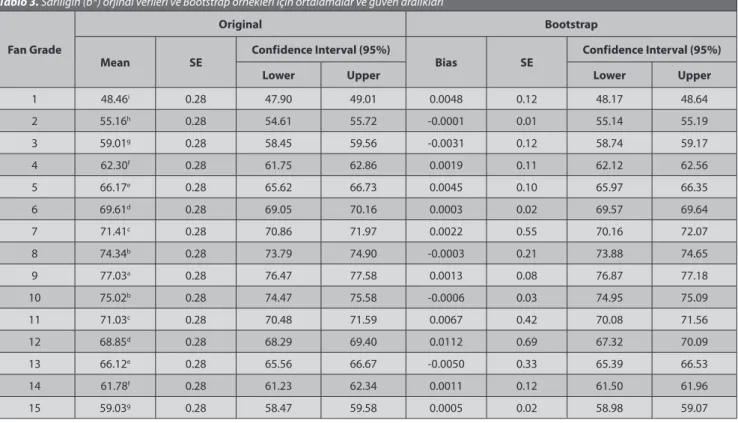
of L* means (P>0.01). The Roche yolk color fan grades are divided into 10 groups in terms of L* values, as well as in terms of b* values. As for yellowness (b*) values, the Roche yolk color fan grades were only divided into 9 groups (Table 3, P<0.01). On the contrary, all of the Roche yolk color fan grades (15 grades) according to the redness (a*) means can be identified independently of one another (Table 2, P<0.01).
The bias values of the means of the L*, a*, b* para- meters obtained by the Bootstrap application, the standard error values of the means and confidence intervals are given in Table 1, Table 2, Table 3, respectively. The bias
Fig 1. Chromaticity coordinates x and y for
Roche yolk color fan
Şekil 1. Roche sarı renk yelpazesinin x ve y
means of the obtained Bootstrap samples were found quite low. This means for the L*, a*, b* parameters were found -0.0013, -0.0004, 0.0017, respectively. It has been determined that the results of the variance analyses and Tukey’s range tests used original and Bootstrap data are the same.
DISCUSSION
As seen in Table 1 and Table 3, the Roche yolk color fan grades cannot be completely separated from each other in terms of L* and b* values. On the contrary, all of the 15 grades were found independent of each other in Table 1. LS means and confidence intervals for original data and Bootstrap samples of lightness (L*)
Tablo 1. Açık renkliliğin (L*) orjinal verileri ve Bootstrap örnekleri için ortalamalar ve güven aralıkları
Fan Grade
Original Bootstrap
Mean SE Confidence Interval (95%) Bias SE Confidence Interval (95%)
Lower Upper Lower Upper
1 83.04a 0.23 82.58 83.50 -0.0017 0.05 82.92 83.12 2 82.60a 0.23 82.14 83.06 -0.0005 0.03 82.54 82.64 3 81.59b 0.23 81.13 82.05 0.0005 0.08 81.41 81.73 4 79.69c 0.23 79.23 80.15 -0.0037 0.81 77.79 80.52 5 80.00c 0.23 79.54 80.46 -0.0005 0.22 79.49 80.25 6 78.25de 0.23 77.79 78.71 0.0003 0.02 78.22 78.29 7 76.93ef 0.23 76.47 77.39 -0.0014 0.05 76.81 77.02 8 77.40de 0.23 76.95 77.86 0.0001 0.08 77.22 77.53 9 76.27fg 0.23 75.81 76.72 0.0003 0.03 76.21 76.31 10 74.93h 0.23 74.47 75.39 -0.0003 0.02 74.90 74.96 11 73.12i 0.23 72.66 73.58 -0.0034 0.14 72.80 73.33 12 71.72j 0.23 71.26 72.17 0.0032 0.08 71.52 71.83 13 69.76k 0.23 69.31 70.22 0.0001 0.10 69.53 69.91 14 68.49l 0.23 68.03 68.95 -0.0131 0.21 68.23 68.99 15 66.23m 0.23 65.77 66.69 0.0011 0.08 66.04 66.35
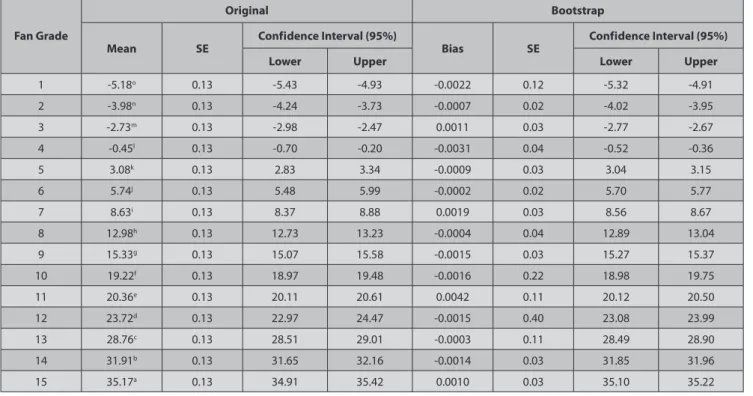
Table 2. LS means and confidence intervals for original data and Bootstrap samples of redness (a*) Tablo 2. Kırmızılığın (a*) orjinal verileri ve Bootstrap örnekleri için ortalamalar ve güven aralıkları
Fan Grade
Original Bootstrap
Mean SE Confidence Interval (95%) Bias SE Confidence Interval (95%)
Lower Upper Lower Upper
1 -5.18o 0.13 -5.43 -4.93 -0.0022 0.12 -5.32 -4.91 2 -3.98n 0.13 -4.24 -3.73 -0.0007 0.02 -4.02 -3.95 3 -2.73m 0.13 -2.98 -2.47 0.0011 0.03 -2.77 -2.67 4 -0.45l 0.13 -0.70 -0.20 -0.0031 0.04 -0.52 -0.36 5 3.08k 0.13 2.83 3.34 -0.0009 0.03 3.04 3.15 6 5.74j 0.13 5.48 5.99 -0.0002 0.02 5.70 5.77 7 8.63i 0.13 8.37 8.88 0.0019 0.03 8.56 8.67 8 12.98h 0.13 12.73 13.23 -0.0004 0.04 12.89 13.04 9 15.33g 0.13 15.07 15.58 -0.0015 0.03 15.27 15.37 10 19.22f 0.13 18.97 19.48 -0.0016 0.22 18.98 19.75 11 20.36e 0.13 20.11 20.61 0.0042 0.11 20.12 20.50 12 23.72d 0.13 22.97 24.47 -0.0015 0.40 23.08 23.99 13 28.76c 0.13 28.51 29.01 -0.0003 0.11 28.49 28.90 14 31.91b 0.13 31.65 32.16 -0.0014 0.03 31.85 31.96 15 35.17a 0.13 34.91 35.42 0.0010 0.03 35.10 35.22
terms of a* values. Thus, it is possible to say that the Roche yolk color fan grades constructed not on luminousness or yellowness but completely on redness. In addition, because actual color occurs by a combination of all three parameters when evaluating the yolk color it is necessary to take the L* and b* parameters into consideration.
In the study, it was found consistent with statements of Simon and Bruce [21] that the results of variance analysis
performed with the original data and the Bootstrap method and the results of multiple comparison tests were the same. Robison et al.[15] and Takma and Atil [16] reported
that a decrease occurred in the standard error value with the Bootstrap method. In the study, the standard errors of the L*, a* and b* means with the Bootstrap method decreased by 42.03%, 35.38% and 30.24%, respectively. The results of the study have been found consistent with the findings reported by Robison et al.[15] and Takma and
Atil [16]. A similar situation took place for the confidence
intervals. In the confidence intervals of L*, a* and b* means obtained with Bootstrap technique narrowed by the rates of 48.10%, 55.43%, 34.47% respectively. For example, it has been seen in Table 1 that the confidence intervals determined by the original data set for yolk color fan grade 1 and 2 are 82.58-83.50 and 82.14-83.06, respectively. The confidence intervals calculated for these grades overlap with each other, while no overlapping occurred in the Bootstrap confidence intervals (in Table 1, 82.92-83.12 and 82.54-82.64, respectively). This is important especially for the researchers comparing the yolk color fan and the L*, a*, b* values.
The Roche yolk color fan is used in great majority of the studies on egg yolk color. However, the L* a* b* values were obtained by measuring with the help of a device in fewer studies. Dotas et al.[22] investigated the effects of
adding different proportions of dried tomato pulp and carophyll to the diets of laying hens on egg yolk color. In the study conducted in two laying periods, the Roche color fan score means of the egg yolks in the control group with no additives were found 11.32 and 10.39. The scores determined with only carophyll containing diet increased to 14.53 and 14.35. The yolk color scores of the chickens fed with diets that include dried tomato pulp and carophyll at various proportions were determined between 11.35 and 12.13. Jafari et al.[23] who conducted a
similar study reported that Roche color fan score means of hen eggs fed with diets that dried tomato pulp were added at various proportions were between 4.62 and 4.79. In a study conducted by Şamlı et al.[24], the effect of the
use of gluten meal and red pepper in different proportions on yolk color was investigated. It has been reported that the mean of the Roche color fan grade of the control group fed with a diet without any additives was 11.4 [24]. The
reason why the egg yolk color scores of the control groups of these similar studies are quite different from each other can be the genetic difference of the flocks as well as it can be the fact that the color measurements are not objective. As is known, the Roche color fan scores are related to the perception of the human eye. It should be taken into account that the people making measurements under different light intensities can do different evaluations in such applications.
Table 3. LS means and confidence intervals for original data and Bootstrap samples of yellowness (b*) Tablo 3. Sarılığın (b*) orjinal verileri ve Bootstrap örnekleri için ortalamalar ve güven aralıkları
Fan Grade
Original Bootstrap
Mean SE Confidence Interval (95%) Bias SE Confidence Interval (95%)
Lower Upper Lower Upper
1 48.46i 0.28 47.90 49.01 0.0048 0.12 48.17 48.64 2 55.16h 0.28 54.61 55.72 -0.0001 0.01 55.14 55.19 3 59.01g 0.28 58.45 59.56 -0.0031 0.12 58.74 59.17 4 62.30f 0.28 61.75 62.86 0.0019 0.11 62.12 62.56 5 66.17e 0.28 65.62 66.73 0.0045 0.10 65.97 66.35 6 69.61d 0.28 69.05 70.16 0.0003 0.02 69.57 69.64 7 71.41c 0.28 70.86 71.97 0.0022 0.55 70.16 72.07 8 74.34b 0.28 73.79 74.90 -0.0003 0.21 73.88 74.65 9 77.03a 0.28 76.47 77.58 0.0013 0.08 76.87 77.18 10 75.02b 0.28 74.47 75.58 -0.0006 0.03 74.95 75.09 11 71.03c 0.28 70.48 71.59 0.0067 0.42 70.08 71.56 12 68.85d 0.28 68.29 69.40 0.0112 0.69 67.32 70.09 13 66.12e 0.28 65.56 66.67 -0.0050 0.33 65.39 66.53 14 61.78f 0.28 61.23 62.34 0.0011 0.12 61.50 61.96 15 59.03g 0.28 58.47 59.58 0.0005 0.02 58.98 59.07
In a study carried out by Anderson et al.[25], L* a* b*
values were determined by measuring the changes in egg yolk color by means of a device by adding carophyll red, carophyll yellow and the both to the laying hen diets. In the study, there was no significant differences in terms of L* values measured on 15th day, and it has been reported
that the mean of the control group is 61.5, the means of the trial group are between 61.3 and 61.8. While some changes occur in the L* values on the 45th and 60th days of
the experiment, significant differences in a* and b* means of the groups emerged. The a* means of the control group were found 10.1, 4.0, 2.8, respectively, on the 15th, 45th
and 60th days of the experiment while the means of
groups that were given carophyll red and yellow were found 9.8, 16.7, 16.2, respectively. The b* means of the control group were found 61.4, 53.7, 51.1, respectively on the 15th, 45th and 60th days of the experiment, while
the means of groups that were given carophyll red and yellow were found 61.0, 59.8, 57.6 , respectively. The a* values determined by Anderson et al.[25] in the trial groups
is consistent with the 5th and 8th grades of the Roche yolk
color fan according to the classification given in Table 2. Accordingly, it can be said that the color of egg yolks of the control group reported by Anderson et al.[25] is lower
than the values reported by Dotas et al.[22], but is higher
than the values reported by Jafari et al.[23]. Anderson
et al.[25] naturally preferred to compare the results of
their study with the L*, a* and b* results of the studies conducted by Gonzales et al.[26] and Akiba et al.[27]. The
similar situation is also true for the studies that used Roche yolk color fan. Generally, if the researchers used the Roche yolk color fan, they compare their results with the studies that used Roche yolk color fan. However, in this study it is possible to associate the results with the mentioned grades and the corresponding L*, a*, b* means and the confidence intervals.
In several studies, the L*, a*, b* values were used to determine the yolk color through both Roche yolk color fan and a device [28,29]. In the study conducted by Kırkpınar
and Erkek [28] yolk color fan grade means were found 1.25,
4.08, 6.50, 6.08, not available, 7.00, 8.71, 8.54, respectively in 8 trial groups created by using some natural and synthetic pigment materials. In the study, the* values were reported as –4.25, –3.02, 4.08, 3.57, 31.61, 3.44, 18.15, 11.75 with the same order. It has been seen that there are quite close matches when the results reported by Kırkpınar and Erkek [28] compared with the results in Table 2. The
negative bias is thought to be caused by the differences in L* and b* values which are the other color parameters and the error probability in the sensory analysis. Kırkpınar and Erkek [28] reported that a bad-looking pink-red color is
obtained in the 5th group in which paprika meal used as
a source of xanthophylls. The researchers stated that the RCF value could not be determined in this group, because there was no standard suitable for this color in the Roche color fan. When Table 2 is analyzed, it has been seen that
the Roche color fan grade that corresponds to this mean is 14. However, when the L* and b* values (59.05 and 31.64) are analyzed, it has been seen that the 14th grade
does not comply with the confidence intervals, and as reported by Kırkpınar and Erkek [28] the egg yolk is far from
the usual color. In another study conducted by Kırkpınar and Erkek [29] the a* values of the group that used paprika
meal were found to be higher than the other groups, and reported that the Roche color fan grade had the highest mean within the groups. Kırkpınar and Erkek [29] reported
that the Roche color fan and a* means of the group that used paprika meal 12.17 and 23.98, respectively. The values that reported by Kırkpınar and Erkek [29] have been found
consistent with the values in Table 2 in our study.
The egg yolk color fan is a method that easy to obtain, inexpensive method and provides simple application. There- fore, many researchers today also have been using the Roche yolk color fan grades to measure the egg yolk color. However, the reliability is low since it is evaluated by the human senses. Nevertheless, the color measuring devices obtaining the L*, a*, b* values are quite expensive and there are several difficulties in their use. However, it is a reliable method because it demonstrates numerical values. Through this study, associating both these methods was put into practice, and the L*, a*, b* values and confidence intervals corresponding to the Roche yolk color fan grades were determined. In addition to this, the Bootstrap method which has considerably less use in the scientific studies in the field of animal science has been introduced.
REFERENCES
1. Mendeş M, Akkartal E: Comparison of ANOVA F and welch tests
with their respective permutation versions in terms of type I error rates and test power. Kafkas Univ Vet Fak Derg, 16, 711-716, 2010. DOI: 10.9775/ kvfd.2009.1507
2. Manly BFJ: Randomization, Bootstrap and Monte Carlo Methods in
Biology. 2nd ed., Chapman and Hall, London, UK, 1997.
3. Efron B: Bootstrap methods: Another look at the jackknife. Ann Stat,
7, 1-26, 1979.
4. Efron B, Tibshirani R: An Introduction to the Bootstrap. Chapman
and Hall, London, UK, 1993.
5. Lahiri SN: Resampling methods for dependent data. In, Lahiri SN
(Ed): Bootstrap Methods. 13-47, Springer, New York, USA, 2003.
6. DiCiccio TJ, Efron B: Bootstrap confidence intervals. Statist Sci, 11 (3):
189-228, 1996.
7. Douglas KC, Halbert ND, Kolenda C, Childers C, Hunter DL, Derr JN: Complete mitochondrial DNA sequence analysis of Bison bison
and bison-cattle hybrids: Function and phylogeny. Mitochondrion, 11, 166-75, 2011. DOI: 10.1016/j.mito.2010.09.005
8. Karaman M, Kırdağ N: Mitochondrial DNA D-loop and 12S regions
analysis of the long-crowing local breed Denizli fowl from Turkey. Kafkas
Univ Vet Fak Derg, 18, 191-196, 2012. DOI: 10.9775/kvfd.2011.5248 9. Güven E, Avcıoğlu H, Balkaya I, Hayırlı A, Kar S, Karaer Z: Prevalence
of Cryptosporidiosis and molecular characterization of Cryptosporidium
spp. in calves in Erzurum. Kafkas Univ Vet Fak Derg, 19, 969-974, 2013.
DOI: 10.9775/kvfd.2013.9187
10. Huang YB, Chi H: Assessing the application of the Jackknife and
reproductive rate and gross reproductive rate: a case study in Bactrocera
cucurbitae (Coquillett). J Agri For, 61 (1): 37-45, 2012.
11. Cai Z, Zhang Y, Ye X: Phylogenetic relationships of the genus
Eurytrema from domestic and wild animal based on 18S rRNA sequences.
Parasitol Res, 111, 1637-1644, 2012. DOI: 10.1007/s00436-012-3002-y 12. Alkan F, Timurkan MÖ, Karayel İ: Rotavirus diarrhea outbreaks in
arabian thoroughbred foals in a stud farm, Turkey. Kafkas Univ Vet Fak
Derg, 19 (Suppl-A): A141-A145, 2013. DOI: 10.9775/kvfd.2012.8186 13. Adams DC, Anthony CD: Using randomization techniques to
analyse behavioural data. Anim Behav, 51, 733-738, 1996. DOI: 10.1006/ anbe.1996.0077
14. Peres-Neto PR, Olden JD: Assessing the robustness of randomization
tests: examples from behavioural studies. Anim Behav, 61, 79-86, 2001. DOI: 10.1006/anbe.2000.1576
15. Robison OW, PALA A, Leymaster KA, McCraw RL, Young LD:
Genetic parameters in 6-month breeding systems. In, Proceedings 7th
World Congress on Genetics Applied to Livestock Production, August 19-
23, Montpellier, France, 2002.
16. Takma Ç, Atıl H: Bootstrap metodu ve uygulanışı üzerine bir çalışma
2. Güven aralıkları, hipotez testi ve regresyon analizinde Bootstrap metodu.
Ege Üniv Ziraat Fak Derg, 43 (2): 63-72, 2006.
17. Nys Y: Dietary carotenoids and egg yolk coloration - A review. Arch Geflugelkd, 65 (2): 45-54, 2000.
18. Polat HH: Grafik tasarım sürecinde kullanılan aygıtların renk modelleri. İdil, 1 (3): 116-127, 2012.
19. Vuilleumier JP: The “Roche Yolk Color Fan” - An instrument for
measuring yolk color. Poult Sci, 48, 767-779, 1969. DOI: 10.3382/ps. 0480767
20. SAS: SAS/STAT User’s Guide. Version 9.3 Cary, North Carolina, SAS
Institute Inc, 2009.
21. Simon JL, Bruce P: Resampling: A tool for everyday statistical work. Chance, 4 (1): 22-32, 1991.
22. Dotas D, Zamanidis S, Balios J: Effect of dried tomato pulp on
the performance and egg traits of laying hens. Br Poult Sci, 40, 695- 697, 1999. DOI:10.1080/00071669987106
23. Jafari M, Pirmohammadi R, Bampidis V: The use of dried tomato
pulp in diets of laying hens. Int J Poult Sci, 5(7): 618-622, 2006.
24. Şamlı HE, Senkoylu N, Akyurek H, Agma A: Effects of natural
pigments on old hens yolk. Tekirdağ Zir Fak Derg, 2 (3): 281-285, 2005.
25. Anderson DM, MacIsaac JL, Daniel MA, MacKinnon TL, Budgell KL: Evaluating the effects of crab meal, Carophyll Red®, and Carophyll
Yellow® in laying hen diets on egg yolk pigmentation and production performance. Can J Anim Sci, 88, 637-640, 2008. DOI: 10.4141/CJAS08063
26. Gonzales M, Castano E, Avila E, de Mejia EG: Effect of capsaicin
from red pepper (Capsicum sp) on the deposition of carotenoids in egg yolk. J Sci Food and Agric, 79, 1904-1908, 1999. DOI: 10.1002/(SICI)1097-0010(199910)79:13<1904::AID-JSFA452>3.0.CO;2-S
27. Akiba Y, Sato K, Takahashi K, Takahashi Y, Furuki A, Konashi S, Nagao H: Pigmentation of egg yolk with yeast Phaffia rhodozyma
containing high concentration of astaxanthin in laying hens fed on a low-carotenoid diet. J Poult Sci, 37 (1): 77-85, 2000.
28. Kırkpınar F, Erkek R: 1. Beyaz mısır ve buğday temeline dayalı karma
yemlere ilave edilen bazı doğal ve sentetik renk maddelerinin yumurta sarısının rengi ve verim üzerine etkileri. Turk J Vet Anim Sci, 23 (1): 9-14, 1999.
29. Kırkpınar F, Erkek R: 2. Sarı mısır temeline dayalı karma yemlere ilave
edilen bazı doğal ve sentetik renk maddelerinin yumurta sarısının rengi ve verim üzerine etkileri. Turk J Vet Anim Sci, 23 (1): 15-21. 1999.