A v a i l a b l e o n l i n e a t w w w . s c i e n c e d i r e c t . c o m
j o u r n a l h o m e p a g e : w w w . e l s e v i e r . c o m / l o c a t e / v h r i
Economic Impact and Complications of Treated and Untreated
Hepatitis C Virus Patients in Turkey
Onur Baser, MS, PhD1,2,3,*, Akif Altinbas, MD4, Erdem Baser, MS5, M. Furaha Kariburyo, MPH6 1Department of Surgery, Center for Innovation and Outcomes Research, Columbia University, New York, NY, USA;2Department of Economics, MEF University, Istanbul, Turkey;3STATinMED Research, New York, NY, USA;4Diskapi Yildirim Beyazit Education and Research Hospital, Gastroenterology Clinic, Ankara, Turkey;5Department of Economics, Gazi University, Ankara, Turkey; 6STATinMED Research, Ann Arbor, MI, USA
A B S T R A C T
Background: According to the Turkish Ministry of Health’s guidelines, standard double therapy, a combination of pegylated interferon-alpha and ribavirin, was the only treatment option for patients with hepatitis C virus (HCV) infection until the end of 2011. Objective: The primary objective was to compare risk-adjusted clinical and economic outcomes between treated and untreated patients with HCV infection. Methods: Patients with HCV infection were identified from the Turkish National Health Insurance Database (2009–2011) using Interna-tional Classification of Diseases, 10th Revision, Clinical Modification codes. Thefirst prescription date was designated as the index date. Mortality and hepatocellular carcinoma (HCC) rates and health care costs of treated and untreated patients were compared using propensity score matching. Baseline demographic and clinical factors were controlled in the models. Subgroup analysis was conducted for patient groups with and without a cirrhosis diagnosis. Results: Out of 12,990 patients included in the study, 1,583 were treated for HCV infection. Out of 2,467 patients who had a cirrhosis diagnosis, 231 were treated,
whereas out of 10,523 patients without cirrhosis, 1,352 patients were treated. Treated patients were younger, less likely to be diagnosed with comorbid conditions, and less likely to reside in Central or Eastern Anatolia. After adjusting for baseline demographic and clinical factors, mortality (2.27% vs. 5.31%; Po 0.001) and HCC rates (0.69% vs. 1.96%; P o 0.001) were found to be lower for treated patients. Differences were more significant among patients diagnosed with cirrhosis. Treated patients incurred higher risk-adjusted annual costs (€6172 vs. €1680; P o 0.001), mainly because of pharmaceutical costs (€4918 vs. €583; P o 0.001). Conclusions: HCV infection treat-ment, although costly, significantly reduces mortality and HCC rates in Turkey.
Keywords: complications, health care costs, health care utilization, hepatitis C, treatment.
Copyright& 2015, International Society for Pharmacoeconomics and Outcomes Research (ISPOR). Published by Elsevier Inc.
Introduction
Hepatitis C virus (HCV) is a major global public health concern. It is estimated that 2% to 3% of the population in the world (130–170 million people) is infected with HCV infection [1]. With higher incidence in the southern and eastern regions, there are approximately 9 million patients with HCV infection in Europe
[2–6].
Most acute HCV infections (60%–70%) are asymptomatic; therefore, many chronically infected patients do not know that they have been infected with HCV [7,8]. Individuals at an increased risk of HCV infection are injectable drug users, chronic hemodialysis patients, and recipients of blood or blood product transfusions before the 1990 s (up to 70%, 15%, and 10%, respec-tively) [9–11]. Other risk factors for HCV transmission include unprotected sex, perinatal transmission, needle stick injury, and receipt of immunoglobulin[12].
In Turkey, HCV has a 2.2% seroprevalence [8]where almost 90% of the patients are infected with HCV genotype 1b, except in the city of Kayseri and its vicinity, where HCV genotype 4 accounts for 35% of the patients admitted to hospitals [13,14]. In 2005, Turkey had the lowest HCV infection treatment rates among European countries[15].
Treatment possibilities have improved dramatically over the past decade. As much as 51% of patients infected with HCV genotypes 1 or 4 and 90% of patients infected with HCV geno-types 2 or 3 can be cured after 24 to 48 weeks of antiviral treatment[16]. The main goal of treatment in chronic hepatitis C is the prevention of cirrhosis and hepatocellular carcinoma (HCC) by suppressing the virus to undetectable levels, and the efficacy of antiviral HCV treatment is measured through sus-tained virologic response (SVR).
The standard treatment for chronic HCV infection includes the double therapy combination of pegylated interferon-alpha
2212-1099$36.00 – see front matter Copyright & 2015, International Society for Pharmacoeconomics and Outcomes Research (ISPOR). Published by Elsevier Inc.
http://dx.doi.org/10.1016/j.vhri.2015.08.004
Conflict of interest: The authors have indicated that they have no conflicts of interest with regard to the content of this article. E-mail:[email protected].
* Address correspondence to: Onur Baser, Department of Surgery, Center for Innovation and Outcomes Research, 145 Hudson Street, Suite 200, New York, NY.
(Peg-IFN-α) and ribavirin in patients infected with genotype 1[17]. Two treatment strategies are being evaluated, which include adding one or two direct-acting antiviral agents to the standard double therapy and an oral direct-acting antiviral agent combi-nation designed to inhibit different steps of the HCV life cycle
[15,18,19]. According to the Turkish Ministry of Health’s guide-lines, standard double therapy is the only option to treat naive patients with HCV infection[20]. Although combination therapy of Peg-IFN-α and ribavirin significantly increases SVR and the probability of reaching SVR by 50%, the degree of response depends on various factors.
The clinical and economic burden of HCV is significant. Approximately 80% of the individuals exposed to HCV develop chronic infections, and 3% to 11% of those with chronic HCV infections will develop cirrhosis within 20 to 30 years[21,22]with the associated risk of liver failure and HCC[23,24]. HCV infection causes approximately 365,000 deaths annually as a result of complications [15]. In 2002, the number of estimated HCV-related deaths in Europe was 86,000[3]. HCV doubles the risk of depression, increases the risk of HCC 25-fold, the risk of needing a liver transplant more than 60-fold, and the risk of cirrhosis 80-fold[25]. Existing literature indicates that chronic HCV infection lowers work productivity, increases health care utilization, and is associated with an elevated risk of liver-related morbidity and mortality[15].
There is limited research on the total economic burden of HCV on the Turkish health care system. To generate real-world evidence on the HCV-related economic burden and its resulting
complications in Turkey, this study aimed to compare health care outcomes between patients with HCV infection who were pre-scribed Peg-IFN-α with or without ribavirin and those who were not prescribed these medications.
Methods
Law 5502, by the Turkish Grand National Assembly, unified three existing social security and health insurance systems (e.g., Sosyal Sigortalar Kurumu (SSK), Bag-kur, and Emekli Sandigi) into a single system under the Social Security Institute (SSI) in 2006. Enrollment in the current existing Universal Health Insurance Fund within the SSI is mandatory, and contribution rates are determined by patients’ ability to pay. All beneficiaries under the system are entitled to the same benefits package.
Payment by a health insurance fund is based on both a fee-for-service system and a bundled payment system, depending on disease category and services related to the particular disease. For example, laboratory services can be paid separately through the bundled payment system. Payment procedures are outlined by health budget law as access to HCV medications determined by the Ministry of Health protocol. Payment is determined by the health budget laws of the SSI.
Recognizing the importance of health information technology and health technology assessment, Turkey has invested in a nationwide integrated system to collect health care utilization outcomes electronically during the last few years. A claims and Fig. 1– Patient selection criteria. HCV, hepatitis C virus; Peg-IFN-α, pegylated interferon-alpha.
utilization management system was established under the 2007 Health Budget Law (SUT). All public and private facilities under contract with the SSI must submit claims through this system, which covers 80% of the population in Turkey, comprising pharmacy, inpatient, outpatient, and laboratory claims from 17,800 pharmacies, 5600 general practitioners, 4500 medical centers, 1200 government hospitals, and 338 private hospitals. The remaining 20% of the population not included in the data consists of those whose contribution rates were paid by the government due to their income levels. In addition, members of the Turkish Grand National Assembly and the Supreme Court, as well as foreign insurance policy holders and some military personnel, were excluded from the Universal Health Insurance Fund in the SSI; therefore, their data are not in the system. The data have been used in several outcomes research studies
[26–30].
The study period was from January 1, 2009, through December 31, 2011. Using appropriate diagnosis codes from the International Classification of Diseases, 10th Revision, Clinical Modification, all patients with an HCV infection diagnosis were identified for the identification period (January 1, 2010, to December 31, 2010). Peg-IFN-α therapy use was identified after HCV infection diagnosis. The first prescription date was designated as the index date. Patients with Peg-IFN-α therapy before HCV infection diagnosis and those who were pregnant during the study period were excluded from the study sample. All patients had continuous health insurance enrollment during the 1-year preindex (base-line) and the 1-year postindex (follow-up) periods.
Our main cohort included patients with HCV who were categorized into two groups: treated and untreated. Subgroup analysis was also conducted for patients with and without a cirrhosis diagnosis. Demographic factors including age, sex, and
Table 1– Baseline descriptive characteristics for patients with HCV with/without peginterferon and ribavirin treatment.
Characteristic Untreated HCV cohort Treated HCV cohort P value (N ¼ 11,407 ) (N ¼ 1,583)
N/Mean %/SD N/Mean %/SD
Age (y) 53.30 15.79 51.52 12.21 o0.0001*
0–17 157 1.38% 5 0.32% 0.0004* 18–29 954 8.36% 115 7.26% 0.1361 30–39 1,123 9.84% 156 9.85% 0.9901 40–49 1,709 14.98% 284 17.94% 0.0022* 50–59 2,969 26.03% 582 36.77% o0.0001 60þ 4,495 39.41% 441 27.86% o0.0001 Sex Female 6,523 57.18% 868 54.83% 0.0767
Geographic location (Turkey)
Aegean 1,187 10.41% 173 10.93% 0.5244 Black Sea 2,776 24.34% 390 24.64% 0.7939 Central Anatolia 2,785 24.41% 339 21.42% 0.0089 Eastern Anatolia 917 8.04% 102 6.44% 0.0269 Marmara 1,831 16.05% 291 18.38% 0.0187 Mediterranean 1,279 11.21% 174 10.99% 0.7941 Southeastern Anatolia 632 5.54% 114 7.20% 0.0078 Comorbidities Cirrhosis 1,359 11.91% 105 6.63% o0.0001 Biliary disease 564 4.94% 85 5.37% 0.4668 Hepatitis B 1,814 15.90% 275 17.37% 0.1358 HIV 27 0.24% 5 0.32% 0.5516
Chronic artery disease 1,634 14.32% 185 11.69% 0.0046
Congestive heart failure 395 3.46% 27 1.71% 0.0002
Dialysis 141 1.24% 33 2.08% 0.0059 Respiratory diseases 1,912 16.76% 228 14.40% 0.0178 Liver cancer 234 2.05% 17 1.07% 0.0081 Other cancer 701 6.15% 77 4.86% 0.0441 Hypertension 4,273 37.46% 555 35.06% 0.0641 Diabetes 2,309 20.24% 270 17.06% 0.0029 Psychological disorders 1,909 16.74% 304 19.20% 0.0144 Liver transplant 65 0.57% 5 0.32% 0.1959 Hepatic encephalopathy 7 0.06% 0 0.00% 0.3242 Anemia 1,950 17.09% 256 16.17% 0.3594 Rash 11 0.10% 0 0.00% 0.2164 Pruritus 343 3.01% 49 3.10% 0.8471 Nausea 494 4.33% 81 5.12% 0.1541 Diarrhea 863 7.57% 108 6.82% 0.2922
HCV, hepatitis C virus; HIV, human immunodeficiency virus. * Significant at 10%.
region were available in the data. To control for clinical charac-teristics, we identified individual comorbidities, such as biliary disease, hepatitis B, human immunodeficiency virus, chronic artery disease, congestive heart failure, dialysis, respiratory dis-eases, liver cancer, other cancers, hypertension, diabetes, psy-chological disorders, liver transplant, hepatic encephalopathy, anemia, rash, pruritus, nausea, and diarrhea. Means and SDs were calculated for all continuous measures, and frequencies and percentages were computed for categorical variables. For the follow-up period, mortality and HCC diagnosis were identified as clinical outcomes. In addition to overall costs, inpatient, outpatient, and pharmacy costs were calculated from reimburse-ment amounts as economic outcomes.
To compare these clinical and economic outcomes, risk adjustment is necessary. When evaluating treatment groups, selection bias may occur, as treatment and control groups differ in terms of age, sex, region, and comorbidities. We applied propensity score matching (PSM) to eliminate differences between the groups. PSM uses the prediction probability of group membership and isolates the bias resulting from observed differ-ences. A patient’s propensity score is the probability of being treated on the basis of the condition of the patient’s covariate values, such as demographic and clinical factors. Two patients, one treated and the other untreated, with the same or similar propensity score can be considered similar for all observed factors controlled in the predicted probability. The only differ-ence is that one patient is treated and the other is untreated.
Following the guidelines to choose the most appropriate matching technique for this study data, radius, kernel, mahala-nobis, and one-to-one matching were compared, and ultimately, one-to-one matching was applied[31]. Patient age, sex, region, and baseline individual comorbidities were used as covariates in the PSM model. The analysis was conducted using SAS version 9.3 (SAS Institute, Inc., Cary, NC) and STATA version 11 software (Stata-Corp LP, College Station, TX).
Results
A total of 12,990 patients were included in the study, 2,467 of whom were diagnosed with cirrhosis and satisfied all inclusion and exclusion criteria. In the patient population, 12.2% (N¼ 1583) of the treated patients and 9.4% (N¼ 231) of the patients with cirrhosis in study I and study II, respectively, and 12.8% (N¼ 1352) of the patients without cirrhosis in study II underwent standard double therapy during the study period (Fig. 1).
Treated versus Untreated Patients with HCV Infection
Patients treated for HCV infection were younger (age 51.52 vs. 53.30 years; Po 0.01) and less likely to reside in Central (21.42% vs. 24.41%; Po 0.01) or Eastern Anatolia (6.44% vs. 8.04%; P o 0.03) but more likely to reside in Marmara (18.38% vs. 16.05%; Po 0.02) or Southeastern Anatolia (7.20% vs. 5.54%; P o 0.01). Female patients were less likely to be treated for HCV infection (54.83% vs. 57.18%; Po 0.08), but the difference was marginally significant (Table 1).
Comorbidity rates for cirrhosis (11.91% vs. 6.63%), chronic artery disease (14.43% vs. 11.69%), congestive heart failure (3.46% vs. 1.71%), respiratory diseases (16.76% vs. 14.40%), liver cancer (2.05% vs. 1.07%), and diabetes (20.24% vs. 17.06%) were significantly higher among untreated patients during the baseline period (Po 0.01 for all;Table 1). More untreated patients were diagnosed with hypertension (37.46% vs. 35.06%; P o 0.07), though the difference was marginally significant. There were no significant differences between the groups for the following comorbid conditions: biliary disease, hepatitis B, human immu-nodeficiency virus, liver transplant, hepatic encephalopathy, anemia, rash, pruritus, nausea, and diarrhea. More dialysis patients were treated for HCV infection (2.08% vs. 1.24%; P o 0.001). To eradicate HCV infection before renal transplantation, patients undergoing hemodialysis may have been more likely to be treated for HCV (Table 1).
The primary objective was to compare the clinical and economic outcomes between treated and untreated patients with HCV. Because a descriptive comparison of outcomes was founded by differences in age, region, sex, and comorbid con-ditions, as outlined previously, PSM was used.
Table 2 presents the results after PSM. A total of 1583
patients in the untreated cohort were matched with compa-rable patients in the treated cohort on the basis of demo-graphic and clinical factors. Annual health care costs, mortality, and the likelihood of HCC were calculated and compared. This risk-adjusted comparison isolated patient differences in terms of demographic and clinical character-istics, as outlined inTable 1.
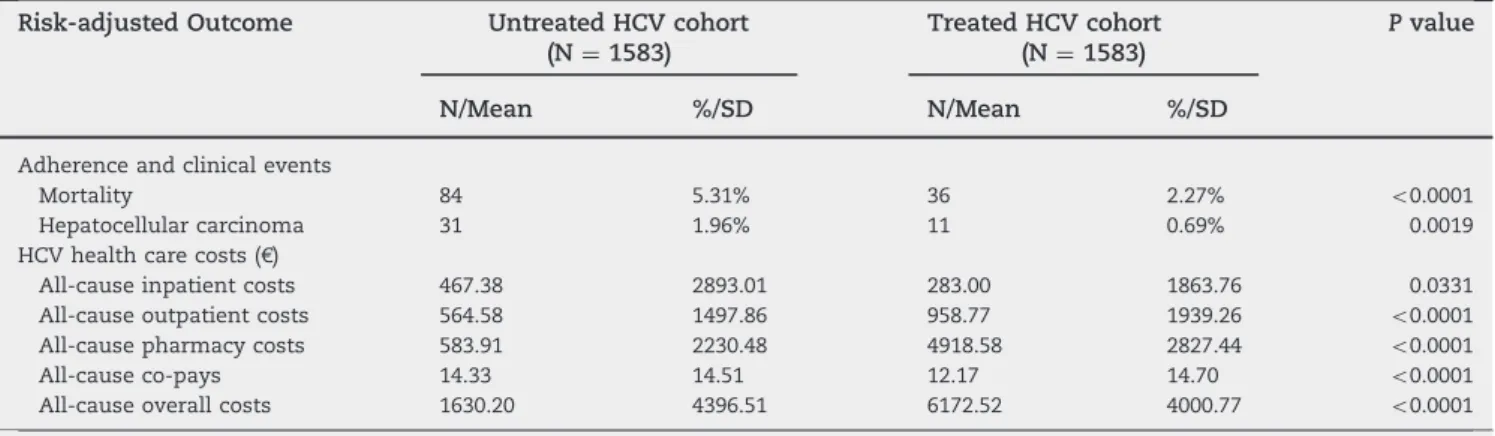
Risk-adjusted mortality rates (2.27% vs. 5.31%; Po 0.001) and HCC rates (0.69% vs. 1.96%; Po 0.001) were significantly lower for treated patients with HCV infection. Total risk-adjusted annual costs were significantly higher for treated patients (€6172 vs. €1680; P o 0.001), mainly due to higher pharmacy (€4918 vs. €583; P o 0.001) and outpatient (€958 vs. €564; P o 0.001) costs. Inpatient costs for treated patients were lower than for untreated patients (€283 vs. €467; P o 0.001).
Table 2– Risk-adjusted outcomes for patients with HCV with/without peginterferon and ribavirin treatment.
Risk-adjusted Outcome Untreated HCV cohort Treated HCV cohort P value (N ¼ 1583) (N ¼ 1583)
N/Mean %/SD N/Mean %/SD
Adherence and clinical events
Mortality 84 5.31% 36 2.27% o0.0001
Hepatocellular carcinoma 31 1.96% 11 0.69% 0.0019
HCV health care costs (€)
All-cause inpatient costs 467.38 2893.01 283.00 1863.76 0.0331
All-cause outpatient costs 564.58 1497.86 958.77 1939.26 o0.0001
All-cause pharmacy costs 583.91 2230.48 4918.58 2827.44 o0.0001
All-cause co-pays 14.33 14.51 12.17 14.70 o0.0001
All-cause overall costs 1630.20 4396.51 6172.52 4000.77 o0.0001
Cirrhosis versus No Cirrhosis Diagnosis
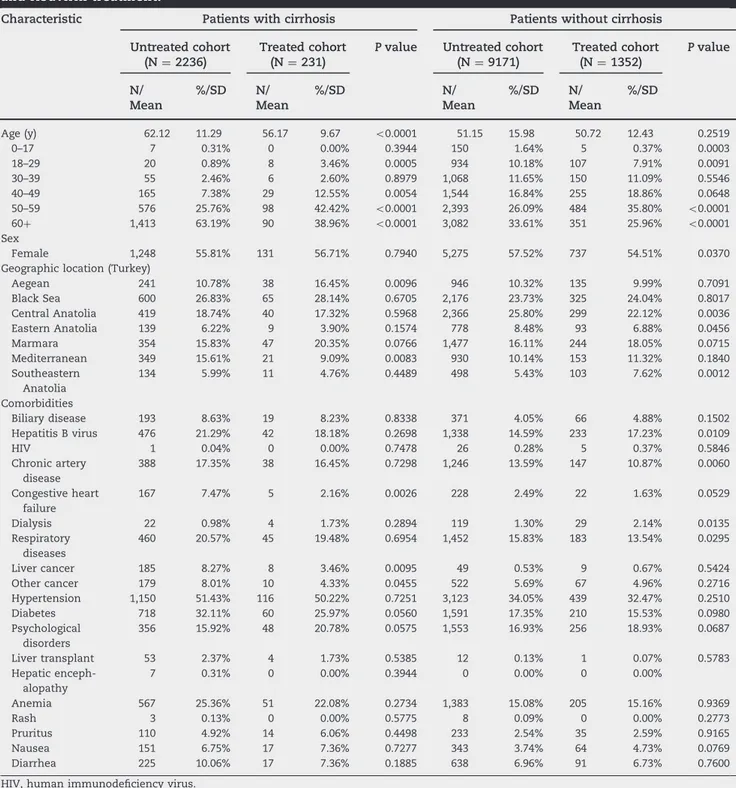
As a subgroup analysis, we examined patients with and without cirrhosis separately. Treated patients in the cirrhosis cohort were younger (56.17 vs. 62.12 years; Po 0.001) and more likely to reside in the Aegean region (16.45% vs. 10.78%; Po 0.001) but less likely to reside in the Mediterranean region (9.09% vs. 15.61%; Po 0.001). Similar to the overall population, patients with cirrhosis with prior congestive heart failure (2.16% vs. 7.47%; P o 0.001), liver cancer (3.46% vs. 8.27%), and other
cancers (4.33% vs. 8.01%) were less likely to be treated for HCV infection (Table 3).
There were no age differences between treated and untreated patients without cirrhosis (P ¼ 0.2519). Female patients, however, were less likely to be included in the treated cohort (54.51% vs. 57.52%; Po 0.001). Treated patients without cirrhosis were less likely to reside in Central Anatolia (22.12% vs. 25.80%; Po 0.01) or Eastern Anatolia (7.62% vs. 5.43%; P o 0.01) but more likely to reside in Marmara (18.05% vs. 16.11%;
Table 3– Baseline descriptive characteristics for patients with/without cirrhosis with/without peginterferon and ribavirin treatment.
Characteristic Patients with cirrhosis Patients without cirrhosis
Untreated cohort Treated cohort P value Untreated cohort Treated cohort P value (N ¼ 2236) (N ¼ 231) (N ¼ 9171) (N ¼ 1352) N/ Mean %/SD N/ Mean %/SD N/ Mean %/SD N/ Mean %/SD
Age (y) 62.12 11.29 56.17 9.67 o0.0001 51.15 15.98 50.72 12.43 0.2519
0–17 7 0.31% 0 0.00% 0.3944 150 1.64% 5 0.37% 0.0003 18–29 20 0.89% 8 3.46% 0.0005 934 10.18% 107 7.91% 0.0091 30–39 55 2.46% 6 2.60% 0.8979 1,068 11.65% 150 11.09% 0.5546 40–49 165 7.38% 29 12.55% 0.0054 1,544 16.84% 255 18.86% 0.0648 50–59 576 25.76% 98 42.42% o0.0001 2,393 26.09% 484 35.80% o0.0001 60þ 1,413 63.19% 90 38.96% o0.0001 3,082 33.61% 351 25.96% o0.0001 Sex Female 1,248 55.81% 131 56.71% 0.7940 5,275 57.52% 737 54.51% 0.0370
Geographic location (Turkey)
Aegean 241 10.78% 38 16.45% 0.0096 946 10.32% 135 9.99% 0.7091 Black Sea 600 26.83% 65 28.14% 0.6705 2,176 23.73% 325 24.04% 0.8017 Central Anatolia 419 18.74% 40 17.32% 0.5968 2,366 25.80% 299 22.12% 0.0036 Eastern Anatolia 139 6.22% 9 3.90% 0.1574 778 8.48% 93 6.88% 0.0456 Marmara 354 15.83% 47 20.35% 0.0766 1,477 16.11% 244 18.05% 0.0715 Mediterranean 349 15.61% 21 9.09% 0.0083 930 10.14% 153 11.32% 0.1840 Southeastern Anatolia 134 5.99% 11 4.76% 0.4489 498 5.43% 103 7.62% 0.0012 Comorbidities Biliary disease 193 8.63% 19 8.23% 0.8338 371 4.05% 66 4.88% 0.1502 Hepatitis B virus 476 21.29% 42 18.18% 0.2698 1,338 14.59% 233 17.23% 0.0109 HIV 1 0.04% 0 0.00% 0.7478 26 0.28% 5 0.37% 0.5846 Chronic artery disease 388 17.35% 38 16.45% 0.7298 1,246 13.59% 147 10.87% 0.0060 Congestive heart failure 167 7.47% 5 2.16% 0.0026 228 2.49% 22 1.63% 0.0529 Dialysis 22 0.98% 4 1.73% 0.2894 119 1.30% 29 2.14% 0.0135 Respiratory diseases 460 20.57% 45 19.48% 0.6954 1,452 15.83% 183 13.54% 0.0295 Liver cancer 185 8.27% 8 3.46% 0.0095 49 0.53% 9 0.67% 0.5424 Other cancer 179 8.01% 10 4.33% 0.0455 522 5.69% 67 4.96% 0.2716 Hypertension 1,150 51.43% 116 50.22% 0.7251 3,123 34.05% 439 32.47% 0.2510 Diabetes 718 32.11% 60 25.97% 0.0560 1,591 17.35% 210 15.53% 0.0980 Psychological disorders 356 15.92% 48 20.78% 0.0575 1,553 16.93% 256 18.93% 0.0687 Liver transplant 53 2.37% 4 1.73% 0.5385 12 0.13% 1 0.07% 0.5783 Hepatic enceph-alopathy 7 0.31% 0 0.00% 0.3944 0 0.00% 0 0.00% Anemia 567 25.36% 51 22.08% 0.2734 1,383 15.08% 205 15.16% 0.9369 Rash 3 0.13% 0 0.00% 0.5775 8 0.09% 0 0.00% 0.2773 Pruritus 110 4.92% 14 6.06% 0.4498 233 2.54% 35 2.59% 0.9165 Nausea 151 6.75% 17 7.36% 0.7277 343 3.74% 64 4.73% 0.0769 Diarrhea 225 10.06% 17 7.36% 0.1885 638 6.96% 91 6.73% 0.7600
Po 0.07) or Southeastern Anatolia (7.62% vs. 5.53%; P o 0.01;
Table 3).
Baseline comorbidity rates for chronic artery disease (10.87% vs. 13.59%), congestive heart failure (1.63% vs. 2.49%), and respi-ratory diseases (13.54% vs. 15.83%) were significantly lower among treated patients without cirrhosis (Table 3). There were more dialysis (2.14% vs. 1.30%; Po 0.001) and hepatitis B patients (17.23% vs. 14.59%; Po 0.001) in the treated group (Table 3).
Although there were no significant differences in risk-adjusted mortality and HCC rates for treated and untreated patients without a cirrhosis diagnosis (P ¼ 0.4879 and P ¼ 0.1567, respectively), mortality rates decreased more than four-fold. HCC rates decreased more than twofold for patients treated for HCV infection in the cirrhosis cohort (5.19% vs. 22.94% and 3.90% vs. 10.39%, Po 0.001, respectively;Table 4).
Risk-adjusted total health care costs were significantly higher for treated patients in the populations with and without cirrhosis (€6279 vs. €2484 and €6154 vs. €1470; P o 0.001). The difference was mainly due to higher pharmaceutical costs in both cohorts (€4482 vs. €756 and €4993 vs. €716; P o 0.001). There were no significant differences in inpatient and outpatient costs between treated and untreated patients who were diagnosed with cirrho-sis. The difference in outpatient costs between treated and untreated patients without cirrhosis, however, was significant.
Discussion
Although the economic burden and complications of HCV infec-tion have been increasingly recognized, relatively little informa-tion is available regarding health care costs, mortality, and complications among patients with HCV in Turkey. Nationally representative claims data from Turkey were used for thefirst time for this outcomes assessment of patients with HCV infec-tion. Annual direct medical costs for treated (Peg-IFN-α with or without ribavirin) and untreated patients with HCV infection as
well as mortality and HCC rates were estimated. Treated and untreated patients were further stratified according to cirrhosis diagnosis.
HCV-induced liver diseases and complications were associ-ated with significant morbidity and mortality due to the extended period of HCV infection. We showed that after controlling for baseline demographic and clinical factors, treatment significantly reduces mortality and HCC rates among patients with cirrhosis in Turkey but has no effect on these rates among those without the disease. This is important to note because some expect that cirrhosis and HCC rates will increase by approximately 80% by the year 2020[32].
HCV-related costs are associated with not only HCV infection complications resulting from the advanced disease stages but also HCV antiviral medications that are extremely expensive[33]. Current data reveal that main cost drivers in the overall costs were inpatient and pharmacy expenditures. The share of out-patient costs was relatively small. Vietri et al.[34]recently found that overall direct costs of patients with HCV infection (sum of physician visit, emergency department visit, and hospitalization costs) were €934 on average, among five European countries (France, Germany, United Kingdom, Italy, and Spain). Menzin et al. [35] estimated inpatient costs at $2649 in patients with cirrhosis, whereas costs were $337 among patients without cirrhosis ($1¼ €0.75). Our results were similar (€1518 vs. €286; P o 0.001; data not shown).
Standard antiviral therapy consisting of Peg-IFN-α and riba-virin can be expensive. Helsper et al.[16]estimated that the cost of adverse effects, excluding antiviral treatment costs, were as high as €15,104. It has been shown that adding a hepatitis C protease inhibitor (such as telaprevir and boceprevir) to standard double therapy has greatly improved SVR rates (up to 80%–90%) in patients infected with HCV genotype 1, but the therapy remains costly [5,36]. Similarly, using a Markov model, Cure et al.[37] reported higher health care costs but improved SVR rates. Because protease inhibitors were not prescribed for HCV
Table 4– Risk-adjusted outcomes for patients with/without cirrhosis with/without peginterferon and ribavirin treatment.
Risk-adjusted outcome
Patients with cirrhosis Patients without cirrhosis
Untreated cohort Treated cohort P value Untreated cohort Treated cohort P value (N ¼ 231) (N ¼ 231) (N ¼ 1352) (N ¼ 1352) N/ Mean %/SD N/ Mean %/SD N/ Mean %/SD N/ Mean %/SD
Adherence and clinical events
Mortality 53 22.94% 12 5.19% o0.0001 29 2.14% 24 1.78% 0.4879
Hepatocellular carcinoma
24 10.39% 9 3.90% 0.0067 6 0.44% 2 0.15% 0.1567
Health care costs (€) All-cause inpatient costs 1066.84 3828.93 898.98 4554.41 0.6683 192.78 1246.81 177.76 678.42 0.6972 All-cause outpatient costs 645.07 1469.57 883.11 1638.74 0.1009 547.63 1457.71 971.70 1986.31 o0.0001 All-cause pharmacy costs 756.22 1092.55 4482.96 2513.66 o0.0001 716.74 4286.99 4993.01 2871.87 o0.0001 All-cause co-pays 16.56 13.31 14.41 19.27 0.1632 13.74 14.39 11.78 13.75 0.0003 All-cause overall costs 2484.69 4663.04 6279.47 5703.06 o0.0001 1470.89 4971.55 6154.24 3633.66 o0.0001
infection treatment in Turkey during our study period, we were unable to assess any impact of triple therapy on HCV infection costs in Turkey.
There were also study limitations typical for any retrospective claims database study, and any results should be interpreted with these caveats in mind[38]. First, the analysis was based on administrative claims data. Although claims data are extremely valuable to analyze treatment effect, they are collected for administrative purposes rather than research. Presence of diag-nosis codes on medical claims may not necessarily prove the presence of the disease because diagnoses may be incorrectly coded or included as rule-out criteria rather than actual disease. Occurrence of a prescription drugfill does not guarantee actual consumption of the drug by the patient. For example, the efficacy of HCV therapy is highly dependent on treatment compliance; therefore, this study implicitly assumed that the compliance rate did not vary across patients, other than the factors controlled in the regression models. Also, claims data do not contain measures of disease activity, health status, patient lifestyle, or genotype. Although we used individual comorbidities to proxy for health status, further studies linking claims data outcomes to hospital charts are warranted to determine the relationship among dis-ease activity scores, genotyping, and outcomes.
Conclusions
Although imperfect, claims analysis plays an important role in health care services research. Claims are a source of information regarding real-world practices across different regions and practi-ces and have variations that may be difficult to assess using trial, survey, expert opinion, and other data sources. Treated patients incurred significantly higher costs, mainly due to pharmaceutical expenditures. The literature reveals that standard and triple therapies are cost-effective because of their probability of halting the progression of underlying liver disease. This study showed that there was a significant reduction in mortality and HCC rates due to treatment among patients with cirrhosis in Turkey.
Acknowledgment
Editorial support was provided by Elizabeth Vivier of STATinMED Research, Ann Arbor, MI.
R E F E R E N C E S
[1]Kuntz E, Kuntz H-D. Hepatology: Textbook and Atlas. Springer, 2009.
[2]Hatzakis A, Wait S, Bruix J, et al. The state of hepatitis B and C in Europe: report from the hepatitis B and C summit conference. Berlin, Germany. J Viral Hepatitis 2011;18(Suppl. 1):1–16.
[3]Mühlberger N, Schwarzer R, Lettmeier B, et al. HCV-related burden of
disease in Europe: a systematic assessment of incidence, prevalence,
morbidity, and mortality. BMC Public Health 2009;9:34.
[4]Palitzsch KD, Hottenträger B, Schlottmann K, et al. Prevalence of
antibodies against hepatitis C virus in the adult German population. Eur J Gastroenterol Hepatol 1999;11:1215–20.
[5]Poordad F, McCone J Jr, Bacon BR, et al. Boceprevir for untreated chronic
HCV genotype 1 infection. N Engl J Med 2011;364:1195–206.
[6]Sy T, Jamal MM. Epidemiology of hepatitis C virus (HCV) infection. Int J
Med Sci 2006;3:41.
[7]Bruno S, Facciotto C. The natural course of HCV infection and the need
for treatment. Ann Hepatol 2008;7:114–9.
[8]Lavanchy D. Evolving epidemiology of hepatitis C virus. Clin Microbiol
Infect 2011;17:107–15.
[9]Alter HJ, Purcell RH, Shih JW, et al. Detection of antibody to hepatitis C virus in prospectively followed transfusion recipients with acute and
chronic non-A, non-B hepatitis. N Engl J Med 1989;321:1494–500.
[10]Fissell RB, Bragg-Gresham JL, Woods JD, et al. Patterns of hepatitis C
prevalence and seroconversion in hemodialysis units from three
continents: the DOPPS. Kidney Int 2004;65:2335–42.
[11]Sutton AJ, Higgins JP. Recent developments in meta‐analysis. Stat Med
2008;27:625–50.
[12]Karaca Ç, Çakalog˘lu Y, Demir K, et al. Risk factors for the transmission of hepatitis C virus infection in the Turkish population. Dig Dis Sci 2006;51:365–9.
[13]Abacioglu YH, Davidson F, Tuncer S, et al. The distribution of hepatitis
C virus genotypes in Turkish patients. J Viral Hepat 1995;2:297–301.
[14]Ciccozzi M, Zehender G, Polat C, et al. Phylogenetic analysis of HCV‐4d
in Turkey: the curious case of Kayseri province. J Med Virol 2014;86:454–60.
[15]Taylor LE, Swan T, Mayer KH. HIV coinfection with hepatitis C virus:
evolving epidemiology and treatment paradigms. Clin Infect Dis 2012;55(Suppl. 1):S33–42.
[16]Helsper CW, Hellinga HL, van Essen GA, et al. Real-life costs of hepatitis
C treatment. Neth J Med 2012;70:145–53.
[17]Sunbul M, Sugiyama M, Kurbanov F, et al. Specific mutations of basal
core promoter are associated with chronic liver disease in hepatitis B virus subgenotype D1 prevalent in Turkey. Microbiol Immunol 2013;57:122–9.
[18]Lawitz E, Mangia A, Wyles D, et al. Sofosbuvir for previously untreated
chronic hepatitis C infection. N Engl J Med 2013;368:1878–87.
[19]Zeuzem S, Berg T, Gane E, et al. Simeprevir increases rate of sustained
virologic response among treatment-experienced patients with HCV genotype-1 infection: a phase IIb trial. Gastroenterology
2014;146:430–41, e6.
[20] Turkiye Cumhuriyeti Sosyal Guvenlik Kurumu. Available from:http://
www.sgk.gov.tr/wps/portal/tr/mevzuat. [Accessed May 20, 2014].
[21]Poynard T, Bedossa P, Opolon P. Natural history of liverfibrosis
progression in patients with chronic hepatitis C. Lancet 1997;349:825–32.
[22]Wiese M, Berr F, Lafrenz M, et al. Low frequency of cirrhosis in a
hepatitis C (genotype 1b) single-source outbreak in Germany: a 20-year
multicenter study. Hepatology 2000;32:91–6.
[23]Akcam FZ, Uskun E, Avsar K, Songur Y. Hepatitis B virus and hepatitis C
virus seroprevalence in rural areas of the southwestern region of Turkey. Int J Infect Dis 2009;13:274–84.
[24]Nelson PK, Mathers BM, Cowie B, et al. Global epidemiology of hepatitis
B and hepatitis C in people who inject drugs: results of systematic
reviews. Lancet 2011;378:571–83.
[25]McCombs JS, Yuan Y, Shin J, Saab S. Economic burden associated with
patients diagnosed with hepatitis C. Clin Ther 2011;33:1268–80.
[26]Altinbas A, Baser E, Burkan A, et al. Retrospective analysis of total
direct medical costs associated with hepatitis B patients with oral antiviral versus pegylated interferon therapy in Turkey. J Viral Hepat 2014;21:794–801.
[27]Baser O, Baser E, Altinbas A, Burkan A. Severity index for rheumatoid
arthritis and its association with healthcare costs and biologic therapy
use in Turkey. Health Econ Rev 2013;3:1–7.
[28]Baser O, Burkan A, Baser E, et al. PSU16 High cost patients for
cardiac surgery and hospital quality in Turkey. Value Health 2012;15: A405.
[29]Baser O, Burkan A, Baser E, et al. High cost patients for cardiac surgery
and hospital quality in Turkey. Health Policy 2013;109:143–9.
[30]Baser O, Burkan A, Baser E, et al. Direct medical costs associated with
rheumatoid arthritis in Turkey: analysis from National Claims
Database. Rheumatol Int 2013;33:2577–84.
[31]Baser O. Too much ado about propensity score models? Comparing
methods of propensity score matching. Value Health 2006;9:377–85.
[32]Davis GL, Alter MJ, El–Serag H, et al. Aging of hepatitis C virus (HCV)-infected persons in the United States: a multiple cohort model of HCV
prevalence and disease progression. Gastroenterology 2010;138:513–21.
[33]Mathis AS. Economic burden and current managed care challenges
associated with hepatitis C. Am J Manag Care 2012;18(Suppl. 14):S350–9.
[34]Vietri J, Prajapati G, El Khoury AC. The burden of hepatitis C in Europe
from the patients’ perspective: a survey in 5 countries. BMC Gastroenterol 2013;13:16.
[35]Menzin J, White LA, Nichols C, Deniz B. The economic burden of
advanced liver disease among patients with hepatitis C virus: a large
state Medicaid perspective. BMC Health Serv Res 2012;12:459.
[36]Jacobson IM, McHutchison JG, Dusheiko G, et al. Telaprevir for
previously untreated chronic hepatitis C virus infection. N Engl J Med 2011;364:2405–16.
[37]Cure S, Diels J, Gavart S, et al. Efficacy of telaprevir and boceprevir in treatment-naive and treatment-experienced genotype 1 chronic hepatitis C patients: an indirect comparison using Bayesian network
meta-analysis. Curr Med Res Opin 2012;28:1841–56.
[38]Benson K, Hartz AJ. A comparison of observational studies and