Contents lists available atScienceDirect
International Journal of Forecasting
journal homepage:www.elsevier.com/locate/ijforecast
Expertise, credibility of system forecasts and integration
methods in judgmental demand forecasting
Jorge Alvarado-Valencia
a,∗,
Lope H. Barrero
a,
Dilek Önkal
b,
Jack T. Dennerlein
caDepartment of Industrial Engineering, Pontificia Universidad Javeriana, Colombia bFaculty of Business Administration, Bilkent University, Turkey
cDepartment of Physical Therapy, Movement, and Rehabilitation Sciences, Bouvé College of Health Science, Northeastern University, Boston, MA, United States
a r t i c l e i n f o
Keywords:
Judgmental forecasting Expert selection Expert elicitation method Credibility of system forecasts
a b s t r a c t
Expert knowledge elicitation lies at the core of judgmental forecasting—a domain that relies fully on the power of such knowledge and its integration into forecasting. Using experts in a demand forecasting framework, this work aims to compare the accuracy improvements and forecasting performances of three judgmental integration methods. To do this, a field study was conducted with 31 experts from four companies. The methods compared were the judgmental adjustment, the 50–50 combination, and the divide-and-conquer. Forecaster expertise, the credibility of system forecasts and the need to rectify system forecasts were also assessed, and mechanisms for performing this assessment were considered. When (a) a forecaster’s relative expertise was high, (b) the relative credibility of the system forecasts was low, and (c) the system forecasts had a strong need of correction, judgmental adjustment improved the accuracy relative to both the other integration methods and the system forecasts. Experts with higher levels of expertise showed higher adjustment frequencies. Our results suggest that judgmental adjustment promises to be valuable in the long term if adequate conditions of forecaster expertise and the credibility of system forecasts are met. © 2016 International Institute of Forecasters. Published by Elsevier B.V. All rights reserved.
1. Introduction
Forecasts are critical inputs to decision-making pro-cesses, and experts play a vital role in introducing special-ized knowledge that is not captured by statistical models. The issue of effectively integrating the abilities of comput-ers to model historical patterns with the expertise of hu-mans for monitoring and assessing contextual information has been attracting vast amounts of attention, primarily
within the domain of judgmental forecasting (Lawrence,
∗Corresponding author.
E-mail address:[email protected]
(J. Alvarado-Valencia).
Goodwin, O’Connor, & Önkal, 2006). Volatile business dynamics and issues with access to reliable domain infor-mation make it extremely difficult to rely solely on statis-tical forecasting methods, particularly in situations such as product demand forecasting, when decisions can have large impacts and uncertainty is high (Sanders & Manrodt, 2003). As a result, expert knowledge needs to be incorpo-rated systematically into the process of demand forecast improvement—a process in which expertise plays a key role in today’s competitive business setting.
Expert knowledge elicitation poses a number of chal-lenging questions to researchers and practitioners in the areas of judgmental demand forecasting and a range of other decision-making domains. These include questions
http://dx.doi.org/10.1016/j.ijforecast.2015.12.010
as to the way in which the responses elicited may be af-fected by (i) the choice of elicitation method within a spe-cific context (Bolger & Rowe, 2014, 2015;Cooke,1991); (ii) the selection and number of experts (Aspinall, 2010); (iii) experts’ personal attributes (Budnitz et al.,1997;Morgan,
2014); and (iv) the presentation of relevant information in order to overcome biases (Martin et al.,2012;Morgan,
2014). The judgmental forecasting context offers a good platform from which to study such issues, given the ap-parently conflicting research findings on the contribution of expertise (Lawrence et al., 2006).
In particular, a comparison of various techniques (i.e., judgmental integration methods) for integrating sys-tems advice and human judgment is an important step in assessing how demand forecasting processes can be improved, and better use made of the expert knowledge elicited. Comparisons among such methods are quite un-common, as the extant research has usually focused on each technique separately (Webby & O’Connor, 1996), leadingGoodwin(2002) to call for more direct compar-isons. Exploring the performance of judgmental integra-tion methods is important both for the efficient design of forecast support systems (FSS) and for gaining an un-derstanding of the conditions required for the effective elicitation and use of expert knowledge, in order to im-prove the functioning of these systems. For instance, the credibility of FSS-generated forecasts might affect expert forecasters’ behaviors, while frequently ignoring system advice may lead to poor performances for judgmental fore-casting (Alvarado-Valencia & Barrero, 2014; Goodwin & Fildes, 1999). Also, the timing of expert intervention may be of critical importance, since not all judgmental adjust-ments contribute equally to the accuracy (Trapero, Pedre-gal, Fildes, & Kourentzes, 2013). That is, expert adjustments to FSS forecasts may not always be advantageous, and the particular benefits may be a function of when and how the expert judgment is integrated into the forecasting process. Focusing on these issues, this paper reports a field experiment that systematically compares three methods for the integration of expert judgment with system-generated forecasts. In addition, formal mechanisms for assessing the relative expertise of forecasters and the relative credibility of system forecasts are evaluated in companies under real settings. Finally, instances in which corrections are needed (i.e., when system forecasts are less accurate and there is room for improvement) are compared with instances in which corrections are not needed (i.e., when adjustments have a greater potential to lead to a deterioration in the accuracy of the system-generated predictions because there is little room for improvement).
2. Literature review and research hypotheses
2.1. Comparison of integration methods
Judgmental integration methods are pervasive, partic-ularly in supply chains, where large numbers of demand forecasts must be performed in order to minimize in-ventory costs and achieve better service levels (Syntetos, Boylan, & Disney, 2009). Companies’ operations can often benefit from the integration of computer-based forecasting
methods with the wider organizational context, in which judgment plays an important role (Fildes, Nikolopoulos, Crone, & Syntetos, 2008).
A typical approach to judgmental integration is to first set an automatic baseline (produced by a system using sta-tistical forecast procedures based on historic data), then judgmentally modify these initial forecasts to incorpo-rate contextual knowledge, a process that is referred to as judgmental adjustment (Fildes, Goodwin, Lawrence, & Nikolopoulos, 2009). In judgmental adjustment, the fore-caster is usually given the historical time series (in a table, a graph or both) and the system forecast, and is asked to produce a final forecast.
Judgmental adjustment may improve the accuracy, par-ticularly when the expert judgment incorporates informa-tion about special events and contextual knowledge into unstable series (Fildes et al.,2009;Goodwin,2002;Webby & O’Connor, 1996). However, such adjustments may be in-fluenced by several biases, including overconfidence in the expert’s own judgment (Friedman et al.,2001;Lawrence et al.,2006; Lim & O’Connor, 1996;Sanders, 1997); an-choring and adjustment (i.e., anan-choring the forecast to a single cue like the last point or the system forecast, and then making insufficient adjustments to this cue; see Ep-ley & Gilovich, 2006;Fildes et al., 2009;Goodwin, 2005;
Lawrence & O’Connor, 1995); and a predisposition to ad-just (forecasters making many small harmful adad-justments to the system forecasts without any specific reason, lead-ing to a deterioration in accuracy; seeFildes et al., 2009;
Lawrence et al., 2006; Önkal, Gönül, & Lawrence, 2008;
Sanders & Manrodt, 1994). Usually, large and negative ad-justments tend to perform better because they show less bias than positive adjustments (Fildes et al., 2009).
Several other integration methods have also been pro-posed in the literature as alternatives to judgmental adjust-ment. The basic combination method consists of a simple mathematical aggregation of the human and system fore-casts. This combination is typically a simple average (here-after called 50–50 combination) that has been shown to be robust in several contexts (Blattberg & Hoch, 1990;Franses & Legerstee, 2011). In this method, the forecaster is usually given the historical time series of the product (in a table, a graph or both) and asked to produce a final forecast. Typi-cally, the forecaster does not know that his/her forecast is going to be combined with a system forecast. Combination has been shown to perform well when the inputs are based on independent information sets (Goodwin,2000,2002), but the same cognitive biases that are present in judgmen-tal adjustment may also appear.
Finally, the divide-and-conquer method is based on the notion that the system forecast is already based on historical information, and therefore, forecasters should avoid re-assessing the historical information because this would lead to an inefficient overweighting of past data. The divide-and-conquer method restricts/prevents human access to this previously computer-modeled information (i.e., the forecaster is not given either the time series or the system forecast, but is told how the system forecast is gen-erated), and simply asks the forecaster whether s/he would like to modify the system forecast (in light of additional in-formation possessed by the forecaster), and if so, by how much.
In divide-and-conquer, decision makers delegate the process of modeling the available structured information to the system, and focus their own efforts on important unmodeled information that may require changes to the system advice (Jones & Brown, 2002). Consequently, this may reduce biases such as anchoring and adjustment. However, the lack of information availability might offset this advantage. Although this method has been suggested for forecasting tasks (Jones, Wheeler, Appan, & Saleem, 2006;Wright, Saunders, & Ayton, 1988), its applicability to the specific case of demand forecasting has not been tested. Comparisons of expert elicitation methods have found that the advantages of specific methods may be task-dependent; i.e., a direct comparison of various elicitation methods on different problems showed that no single ap-proach consistently performed best across all tasks ( Flan-doli, Giorgi, Aspinall, & Neri, 2011). For instance, conjoint analysis might be preferred when the task is framed as a comparison, while probability elicitation might perform better when a different task structure is used (Dalton, Brothers, Walsh, White, & Whitney, 2013). To the best of our knowledge, very few studies have attempted direct comparisons among judgmental integration methods us-ing real experts in a demand forecastus-ing task. In particular, a formal comparison of judgmental adjustment and divide-and-conquer showed that (a) providing the statistical base-line for a judgmental adjustment can lead to more weight being given to statistical information as the forecaster tries to incorporate contextual and historical informa-tion simultaneously, while (b) encouraging the divide-and-conquer strategy leads to a better performance (Jones et al., 2006). Along similar lines,Franses and Legerstee (2013) demonstrated that incorporating judgment formally may prove helpful when the model performance is poor. In an extensive demand forecasting study,Fildes et al. (2009) showed that 50–50 combination (also known as the Blat-tberg–Hoch method) improves the accuracy by decreas-ing the harmful impact of unjustified large (and usually positive) adjustments. These results are also echoed using non-expert participants (e.g., in extrapolation tasks with-out contextual information, seeWebby & O’Connor, 1996). The current study aims to fill this research gap through a formal comparison of these three integration methods via a demand forecasting task with real experts in their natural settings. It should be noted that, although group integra-tion methods such as Delphi have been shown to improve the forecast accuracy (Armstrong,2006;Rowe & Wright, 2001), our focus is on individual judgmental integration methods that allow us to isolate the effects of individual expertise and the credibility of system forecasts within an expert knowledge elicitation framework.
The three aforementioned methods exemplify trade-offs between information availability and well-known cog-nitive biases at an individual level. It may be argued that, while judgmental adjustment provides the most informa-tion of the three approaches, it may also be more subject to the anchor and adjustment bias, precisely because of the amount of information available. 50–50 combination with-holds a piece of information from the forecaster (namely the system forecast), and the forecaster is prevented from performing the final integration, so as to reduce biases. Fi-nally, divide-and-conquer tries to avoid two biases in the
forecaster, namely anchoring in past demand/system fore-casts and making unjustified adjustments to the system forecast; however, it carries the associated cost of signif-icantly less information being available.
Previous work has shown that attempting to remove bi-ases by restricting forecasters’ access to information is dif-ficult (Goodwin, Fildes, Lawrence, & Stephens, 2011). On the other hand, having access to relevant information, par-ticularly information from different/independent sources, can improve the accuracy if it is integrated well by either the methods or the judges (Bolger & Wright, 2011; Good-win, 2002; Van Bruggen, Spann, Lilien, & Skiera, 2010). Therefore, we hypothesize:
H1: Judgmental adjustment will yield the greatest improve-ment in accuracy among the methods evaluated for demand forecasts.
However, we expect that the divide-and-conquer meth-od might have some measurable effect for debiasing. In particular, we expect that there would be less anchoring to the system forecast when corrections are needed (be-cause the anchor value is not provided), and fewer adjust-ments made when no correction to the system forecast is needed (by focusing the forecasters initially on whether or not they have any rationale for an adjustment). Note that this comparison can only be made against the judg-mental adjustment method, because the 50–50 combination method does not provide the experts with system forecasts (thus preventing any corrections to such forecasts).
Accordingly, our hypotheses are as follows:
H2: The ‘‘divide-and-conquer’’ method will lead to ments being less frequent than for the ‘‘judgmental adjust-ment’’ method when the system forecast does not require correction.
H3: The ‘‘divide-and-conquer’’ method will lead to larger ad-justments than the ‘‘judgmental adjustment’’ method when the system forecast does require correction.
2.2. Expertise and credibility of system forecasts
When integration methods are used in demand fore-casting, the resulting forecasts may be affected by both the individual’s expertise and the perceived credibility of the system forecast suggestions (Alvarado-Valencia & Barrero, 2014;Lawrence et al.,2006).
The importance of expertise demands an adequate def-inition and a measurement of this critical construct. The definitions found in the literature usually refer to at least three components of expertise: first, a field of special-ized knowledge in which expertise is observable (domain knowledge); second, an outstanding expert’s performance in this field; and third, the consistency (i.e., time-lasting and reproducibility) of such a performance. The measure-ment of expertise usually involves comparisons (novice vs. expert), peer recognition or objective measures of
ef-ficiency, and effectiveness in domain knowledge (
Char-ness & Tuffiash, 2008;Germain & Tejeda, 2012). In expert elicitation, a priori selection (based on publication record, group membership or résumé), co-nomination and peer suggestions are frequent (Butler, Thomas, & Pintar, 2015;
Loveridge, & Cameron, 1996), because it is quite difficult to develop tailored tests of knowledge domain effectiveness. Expertise in the demand-forecasting domain has been related primarily to intimate product knowledge (Lawrence et al., 2006). This intimate product knowledge allows the expert to be in contact with environmental information that is not captured by statistical models, such as special promotions (Trapero et al., 2013), sudden and unexpected changes in the market, competitors’ behaviors, and supply-related constraints (Lee, Goodwin, Fildes, Nikolopoulos, & Lawrence, 2007;Webby, O’Connor, & Edmundson, 2005). Therefore, experts in demand forecasting are likely to be found in job positions that are in permanent contact with such unmodeled environmental information.
However, access to information is not enough. It is also necessary to have (i) the ability to integrate this informa-tion into the final forecast, and (ii) the motivainforma-tion to do such integration (Gavrilova & Andreeva, 2012). The review byWebby and O’Connor(1996) showed that experiential knowledge of the cause–effect relationships encountered in the industry may not be a good predictor of superior
accuracy. Another study, byEdmundson, Lawrence, and
O’Connor(1988), showed that intimate domain knowledge elicited from experts was useful only for the most impor-tant products, not for the others.
In sales and operations areas, there are several positions in which an important part of an employee’s job is to assess or forecast demand, either formally or informally, based on contextual information. For instance, supply chain managers make decisions about when to order different products, and in what quantities. Thus, success in these po-sitions depends largely on individuals’ correct assessments of future demand, based on information about product ro-tation and the possible sizes of orders from key clients. Marketing and sales managers are expected to take ac-tion to modify the demand and to counteract competitors, which requires the ability to correctly foresee the effects of their actions.
If sales and operations experts have different levels of relative expertise, contingent on their job positions, and their job performance is related to adequate forecasting, it follows that their job expertise will be related partially to an ability to integrate information into forecasts. This abil-ity would be particularly useful when system forecasts lack this information, and, as a consequence, the system fore-cast requires correction. As a result, our fourth hypothesis is:
H4: A higher employee expertise will improve the accuracy when a correction to the system forecast is needed.
Note that we expect to verify H4 only if job expertise directly or indirectly requires an assessment of the future demand, as has been explained, and only where a correc-tion to the system forecast is really needed.
In both judgmental adjustment and divide-and-conquer, experts relate their expertise to the advice provided by sys-tem forecasts. Although it is expected that experts will ex-hibit overconfidence in their own judgment, and therefore discount the advice (Bonaccio & Dalal, 2006), it can also be expected that individuals will show different levels of ad-vice discounting, due to different levels of source credibil-ity.
Source credibility is related to a general assessment of the trustworthiness of the trustee outside the context of specific advice or suggestions (Mayer, Davis, & Schoorman, 1995), and results from a combination of prior information that might be based on the source’s reputation, second-hand information on past performance, recent experience with the source, and various organizational and contextual factors (Alvarado-Valencia & Barrero, 2014). Extant work suggests that the credibility of human sources may be as-sessed differently to that of expert systems. Expert systems are believed to be more consistent and less prone to biases than humans. However, as expert systems are expected to be less adaptable than human sources, they are perceived to be unable to capture all aspects of reality. Expert sys-tems also raise higher performance expectations than hu-mans, meaning that errors from expert systems affect their
credibility more severely than human errors (Madhavan
& Wiegmann, 2007;Sundar & Nass, 2000). In the expert systems literature, the same advice has been found to be discounted less when is believed to come from a human expert rather than an expert system (Lerch, Prietula, & Ku-lik, 1997;Waern & Ramberg, 1996). Similar results have been found in the judgmental forecasting literature (Önkal et al.,2008;Önkal, Goodwin, Thomson, Gönül, & Pollock, 2009).
At least three mechanisms for the influence of source credibility on the discounting of system forecast advice are plausible. First of all, research has shown source credibil-ity to be an important factor for persuasive power ( Porn-pitakpan, 2004), and a higher persuasive power may lead to reduced advice discounting. Second, source credibility is one of the constituents of trust, and higher levels of trust in a system’s advice have been found to reduce advice dis-counting (Goodwin, Gönül, & Önkal, 2013). Finally, if advi-sors feel that they are relatively less task-expert than the expert system, then we would expect less advice discount-ing (Rieh & Danielson, 2007).
Therefore, we constructed the following hypothesis: H5: In both the ‘‘divide-and-conquer’’ and ‘‘judgmental ad-justment’’ methods, there will be an interaction between the credibility of system forecasts and forecaster expertise, such that:
H5a: larger adjustments will be made when a higher fore-caster expertise is accompanied by a low credibility of system forecasts.
H5b: more frequent adjustments will be made when a higher forecaster expertise is accompanied by a low credibility of system forecasts.
3. Methods
We conducted a longitudinal field study that was de-signed to assess the differences in accuracy improvement among three human–computer integration methods: judg-mental adjustment, 50–50 combination and divide-and-conquer. The study assessed the relative expertise and credibility of system forecasts and participants, and com-pared instances where correction of the system forecast was needed to those where it was not.
3.1. Sample selection and characteristics
Companies: Four companies provided access and con-sent for this field study. We required the companies to
Table 1
Participants, products and data-point distribution among companies. Sector Company
A B C D
Chemical Technology Food and beverages Office products retailer Aggregation level Product reference Product family and client type Product and client type Product family
Participants 6 10 9 6
Products 4 5 4 4
Collected forecasts 104 248 91 95
Missed forecasts (drop-outs) 4 10 8 7
be large enough to have at least three different prod-ucts and to be willing to participate in the study. In each company, a key contact person provided assistance with logistics, the selection of products, and the identification of potential participants to be included in the study. This con-tact person was not included as a participant in the study. The participating companies belonged to different indus-trial sectors (Table 1). Companies A & C were branches of large multinationals, and Companies B & D were local com-panies, with yearly sales of around US$ 100 million and US$2 million respectively.
Products: When considering products for inclusion in the study, the following restrictions were applied: (a) the product needed to be important for forecasters in terms of volume or value; (b) no new products or products close to being discontinued were considered; (c) a historical track availability (of at least two years) with non-zero demand was required; (d) each product must be forecast on a monthly basis; and (e) at least three participants with extensive product knowledge must be available for each product. Meaningful units and aggregation levels were selected for each product based on consultations with the key contacts in each company (Table 1), as different companies might need different aggregation levels for decision making (Alvarado-Valencia & García Buitrago,
2013). The final numbers of products selected for each
company were quite similar (Table 1). The final selected products had historical training tracks of between two and eight years, with coefficients of variation in a broad range from 0.32 to 1.31 (Table 2).
Participants: The participants selected typically worked within the broad sales and operations area (S&OP). All of the participants were required to have hands-on experience with their assigned products and to have information on these products that could help to evaluate and forecast the demand based on contextual information, whether formally or informally (although they did not necessarily need experience in forecasting within the company). The potential participants were then contacted by email, and an initial interview was arranged to explain the purpose, scope and research methods, including the individual’s right to drop out of the study at any time. All of the potential participants accepted our invitation and provided informed consent prior to starting the data collection. All of the procedures were approved by the Research and Ethics Committee of the School of Engineering at Pontificia Universidad Javeriana.
The participants then completed a survey that con-tained instruments for measuring expertise (Germain & Tejeda, 2012) and the credibility of system forecasts
(Meyer, 1988). Details of these instruments are provided in Section3.5. Finally, demographic information was col-lected and a pilot test was performed with each final par-ticipant prior to starting the field study, in order to clarify the procedures for the data-collection session. The num-ber of participants per company ranged from six to ten ( Ta-ble 1). The participants from Company A exhibited higher average ages and experience levels, while those in Com-pany C showed the lowest variability in age and experience (Table 3).
3.2. Data collection procedures
Each month, an automatic exponential smoothing model was fitted to each product, based on the complete historical track available, in order to generate forecasts and their 95% confidence intervals for the following month. The models, forecasts and confidence intervals were all produced using the automatic features of the SPSS 20 software, including only exponential smoothing methods. Information about the system forecast fits are presented in
Table 2, including the automatic fitting method selected by the software and the variation coefficient of the residuals after fitting the selected method, which gives an indication of the residual volatility of the series. With a single exception, all of the demands were seasonal in nature.
The participants were assigned randomly to one of the three methods, following Latin squares randomization, in blocks of three months for each group of three forecasters assigned to each product. Information from at least one time block of three months with a minimum of three forecasters was collected for each product. A single participant might be selected for more than one product in the same company.
Company B accounted for roughly 45% of the forecasts collected, and the remaining forecasts were distributed evenly among the other three companies. Some forecasts were missing due to vacations, meetings, or participants’ lack of time (Table 1). Details of the forecasts collected for each product are given inTable 2, including the number of forecasters, number of months collected, and total forecasts collected for each product.
Forecast collection was performed over the first ten days of the month within another administration office in each company. For each month of the study, the researcher provided instructions from a script (Appendix A) to each participant, according to the treatment assigned randomly for the given month. None of the forecasts produced were used for decision making or any other purpose within the company. In all treatments, the participants were
Table 2
Product features and data collection.
Company Series Training length (months) CV Fitted method Residuals CV Participants Months Collected forecasts
A 1 29 0.64 Seasonal ES 0.74 3 6 18 A 2 29 0.91 Seasonal ES 1.11 3 6 18 A 3 29 0.81 Winters additive 0.55 3 6 18 A 4 44 0.93 Winters additive 0.82 6 9 50 B 5 44 0.73 Seasonal ES 0.94 6 8 48 B 6 44 0.32 Winters additive 0.90 6 8 48 B 7 44 1.11 Seasonal ES 1.11 6 9 51 B 8 44 1.27 Winters additive 1.02 6 9 51 B 9 44 0.72 Seasonal ES 0.75 6 9 50 C 10 41 1.28 Seasonal ES 0.93 3 5 13 C 11 44 0.81 Simple ES 1.00 6 9 49 C 12 41 0.35 Seasonal ES 0.83 3 5 15 C 13 41 0.42 Seasonal ES 0.99 3 5 14 D 14 82 0.42 Seasonal ES 1.03 4 6 23 D 15 82 1.31 Seasonal ES 0.83 4 6 23 D 16 82 0.46 Winters multiplicative 1.11 5 6 27 D 17 82 0.57 Winters additive 1.15 4 6 22 ES=exponential smoothing; CV=Coefficient of variation.
Table 3
Participant demographics.
Sector Company
A (N=6) B (N=10) C (N=9) D (N=6)
Chemical Technology Food and beverages Office products retailer Age (years) M=46.16 M=36.80 M=29.44 M=33
SD=7.08 SD=7.99 SD=3.33 SD=6.72
Experience in the company (years) M=9.58 M=2.88 M=3.14 M=3.25
SD=7.18 SD=1.92 SD=1.75 SD=3.06
Experience with the product (years) M=20.33 M=8.48 M=1.57 M=5.25
SD=7.66 SD=6.86 SD=0.93 SD=5.60
Gender (M–F) 5–1 5–5 5–4 5–1
M=mean; SD=standard deviation.
encouraged to include their knowledge of the product in their forecast, and to give reasons for their final forecast after delivering it.
In the judgmental adjustment and 50–50 combination treatments, graphs and tables of historical information were produced using default spreadsheet (Excel) settings, in order to improve the external validity, and the lay-outs were kept as similar as possible across treatments and periods, to avoid format effects. The graphs and tables for judgmental adjustment also included system forecasts. The divide-and-conquer participants did not receive any of these graphs/tables. All of the graphs and tables were pre-sented on a computer screen. The interviewer registered the final demand forecasts obtained and produced an au-dio recording of each session.
3.3. Independent variables
The main independent variable was the human–com-puter integration method: judgmental adjustment, 50–50 combination and divide-and-conquer. This variable was collected from the treatment assigned to each forecaster for each product each month.
The credibility of the system forecasts was measured using Meyer’s scale (Meyer, 1988). Of all of the indexes that have been developed for assessing source credibility,
Meyer’s scale is one of the most validated, and is used in newspaper credibility research (Roberts, 2010). Although it was developed in the context of newspapers, it has been applied successfully to other fields too, such as advertis-ing and online information (Choi & Lee, 2007;Greer,2003;
Oyedeji,2007), showing that the questions of the scale are of a general usefulness for source credibility. The scale, as adapted to the purpose of the present study, is presented inAppendix B. The results of Meyer’s scale were then con-verted into a binary variable. Participants with scale values from zero to two were classified as having a low credibility of system forecasts (SF credibility); participants with scale values from three to five were classified as having high SF credibility.
Expertise scores were provided by the key contact per-son in each company using the Germain and Tejeda scale (Germain & Tejeda, 2012). Because this study used exper-tise as a possible independent variable that might affect the accuracy, using the accuracy results to determine expertise was not considered appropriate. It appears that there are no scales in the scientific literature that are capable of mea-suring intimate product knowledge expertise, and only a few expertise-measuring methods that can be applied or adapted to different contexts (Kuchinke, 1997). However, the knowledge subscale of theGermain and Tejeda(2012) general scale of expertise recognition was deemed suitable
for this research. This subscale is intended to measure an employee’s expertise at his job. As was explained in Sec-tion2.2, employee expertise in jobs where information in-tegration and foresight are constituents of job performance can serve as a proxy for individuals’ ability to improve fore-casts. The knowledge expertise subscale includes general purpose questions relating to an expert’s field knowledge in her job from a colleague’s point of view (Appendix C), and is therefore an expertise measure that is based on peer recognition. The reliability of the knowledge subscale was high (
α =
0.
92), and the factor structure validity was good(comparative fit index
=
0.93). It should be noted thatmore general reliability and validity tests in different con-texts are still needed, due to the recent development of this measure.
After collection, the expertise scores were normalized within each company in order to avoid potential key contact biases. Participants with standard values over zero were classified as high-expertise participants, whereas those with standard values below or equal to zero were classified as low-expertise participants.
The system forecasts’ need for correction was also an independent variable of interest. If the realized demand value for a product was outside the prediction inter-vals calculated previously using system forecasts (see Sec-tion3.2.), that particular period was labeled as ‘‘correction needed’’. In contrast, if the actual value was located within the 95% prediction interval, the period was marked as ‘‘cor-rection not needed’’.
Lastly, the audiotapes of forecast reasons were catego-rized independently by two researchers, and any differ-ences were reconciled posteriorly.
3.4. Dependent variables
The improvement in average percentage error (APE) was used as the dependent variable, and is defined as follows:
APEt
=
100∗
|
Yt−
Ft|
Yt
.
As a consequence,
APEIMP
=
APEsystem forecast−
APEintegrated forecast,
where Ytis the actual observed demand outcome at time
t, and Ftis the final forecast for the product demand
pro-duced previously for time t.
APE is a measure of accuracy with a widespread use in industry (Mentzer & Kahn, 1995), although it has sev-eral weaknesses. We did not use scaled error measures such as the average scaled error (ASE) because the data in this study were all positive and greater than zero. Con-sequently, the advantages of scaled measures were re-duced, and APE could be selected due to its simplicity and widespread use (Hyndman & Koehler, 2006).
In addition, adjustment response measures were also estimated in order to obtain in-depth information about forecasters’ behaviors when performing judgmental adjust-ment or divide-and-conquer. The measures calculated were the adjustment size in absolute value (scaled by the ac-tual demand) and adjustment direction (positive/negative or none).
Table 4
Expertise and SF credibility of participants.
SF credibility Low High
Expertise Low 7 7
High 8 9
3.5. Statistical analyses
A four-way ANOVA was conducted for estimating dif-ferences in accuracy improvement with APE. Expertise and SF credibility were between-participant variables, whereas the need for correction and the integration methods were within-participant variables. Bonferroni corrected pair-wise comparisons were used for post-hoc comparisons.
For the methods of divide-and-conquer and judgmental adjustment, chi square contingency tables were performed for assessing the effects of independent variables on the adjustment frequency, and a two-way ANOVA was per-formed for assessing the effect of SF credibility and exper-tise on the absolute adjustment size (scaled by the actual demand).
Also, chi square contingency tables were performed to investigate the relationships between rationale types, fore-caster behavior and integration methods.
4. Results
4.1. Descriptive results
The expertise and SF credibility levels were distributed evenly across our 31 participants (Table 4). In addition, the distribution of integration methods was even, but there were four times more points in the ‘‘correction not needed’’ treatment, due to the nature of the study, in which the need for correction was not known until one month after the data were collected (Table 5).
4.2. Accuracy improvement results
Judgmental adjustment was the method with the great-est accuracy improvement, supporting H1 (p
<
0.
05, Ta-ble 6). Bonferroni-corrected pairwise comparisons show that judgmental adjustment was significantly better than either the 50–50 combination (p=
0.
045) or divide-and-conquer (p<
0.
01) for APE improvement (Table 7). How-ever, significantly higher-level interactions suggest that the accuracy of judgmental adjustment should be qualified based on different levels of expertise, SF credibility and the need for correction (Table 6).The interaction between expertise and the need for
correction was significant for APE improvement (p
=
0
.
018), supporting H4 (Table 6). Higher-level interactions also suggest that this interaction should be qualified on different levels of SF credibility and integration methods.The fourth-level interaction indicated that the judgmen-tal adjustment method was superior when high expertise and low SF credibility were present, and correction was needed (Table 8). The effect size of this interaction was
Table 5
Data-point distribution among treatments.
Integration method Total
Judgmental adjustment 50–50 combination Divide-and-conquer
Correction needed No 140 137 137 414
Yes 42 40 42 124
Total 182 177 179
Table 6
APE improvement related to treatments.
Source APE
improvement
F p-value
Main effects
Need for correction 26.778 <0.001
Expertise 5.381 0.021
SF credibility 2.584 0.109
Integration method 6.187 0.002
2-way interaction terms
Need for correction * expertise 5.603 0.018 Need for correction * SF credibility 1.428 0.233 Need for correction * integration method 3.723 0.025 Expertise * SF credibility 5.483 0.020 Expertise * integration method 2.450 0.087 SF credibility * integration method 1.467 0.232
3-way interaction terms
Need for correction * expertise * SF credibility 3.283 0.071 Need for correction * expertise * integration method 3.911 0.021 Need for correction * SF credibility * integration method 1.854 0.158 Expertise * SF credibility * integration method 7.429 <0.001
4-way interaction term
Need for correction * expertise * SF credibility * integration method 9.269 <0.001 Note: Grey values are significant at the 5% level.
Table 7
Differences in APE improvement by method.
Method (I) Method (J) Estimated mean difference (I – J) Standard error p-value 95% confidence interval Lower bound Upper bound
Judgmental adjustment 50–50 combination 0.11 0.045 0.045 0.002 0.218
Judgmental adjustment Divide-and-conquer 0.149 0.043 0.002 0.045 0.253
50–50 combination Divide-and-conquer 0.039 0.043 N.S. −0.065 0.143
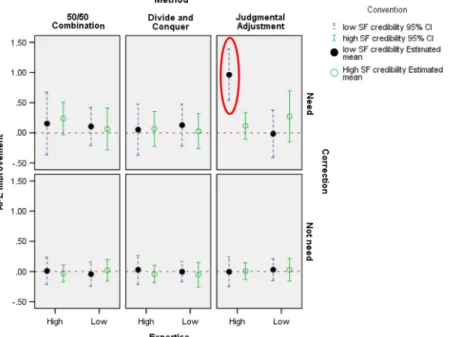
large enough to make a difference for expertise and meth-ods in the main effects, and it was the only treatment with a confidence interval for APE improvement that was clearly above zero. Therefore, it was the only combination of fac-tors that clearly overcame the system forecast and added value to the final forecast (Fig. 1). The effect was smaller for improvements in the median of the APEs, but still held (Table 8), indicating that the results were robust, although their effect size was reduced when the effects of extreme improvements (or deteriorations) were removed. When separate ANOVAs were run on the no-need-for-correction and need-for-correction data, the former did not generate any significant effect on the rest of the independent vari-ables, whereas the latter showed a significant effect in the three-way interaction (p
<
0.
01).Regarding the three-way interaction when correction is needed, it is important to highlight that expertise and
SF credibility did not generate any significant differences in accuracy improvement for the 50–50 combination and divide-and-conquer methods. However, in the judgmental adjustment method, a specific combination of low SF credibility and high expertise generated improvements in APE that surpassed all other treatment combinations that estimated APE improvement by more than 80% (Fig. 1).
Given that the use of APE in averages (as is done in ANOVA) might raise concerns about the known biases of this measure, and due to the high positive skewness and high kurtosis in our APE improvement results, we repeated the analysis using the median of APEs as the estimator (MedAPE) and average scaled errors (ASE) as the accuracy measure. Our findings on significance remained the same, although the size effects changed.
To reduce the chance of spurious p-values and concerns about the sample size, we conducted two additional analy-ses. First, a four-fold random cross-validation showed that
Table 8
Estimated means and medians of errors for field study treatments. Need for
correction
Expertise SF credibility Method Estimated MAPEimp Estimated MdAPEimp Standard error 99.9% confidence interval Lower bound Upper bound No Low Low Judgmental 0.029 0.000 0.055 −0.152 0.210
Combination −0.045 0.004 0.060 −0.245 0.156 Divide −0.004 0.000 0.051 −0.173 0.164 High Judgmental 0.029 0.000 0.056 −0.158 0.215 Combination 0.019 −0.005 0.055 −0.162 0.200 Divide −0.054 0.000 0.062 −0.258 0.149 High Low Judgmental −0.005 0.011 0.074 −0.250 0.240 Combination 0.009 0.041 0.069 −0.217 0.236 Divide 0.028 0.001 0.072 −0.211 0.266 High Judgmental 0.005 0.000 0.042 −0.133 0.142 Combination −0.030 −0.012 0.042 −0.171 0.110 Divide −0.043 0.000 0.043 −0.186 0.100 Yes Low Low Judgmental −0.016 0.000 0.119 −0.409 0.377 Combination 0.105 0.027 0.095 −0.208 0.419 Divide 0.127 0.000 0.105 −0.219 0.474 High Judgmental 0.272 0.211 0.128 −0.152 0.696 Combination 0.063 0.000 0.105 −0.283 0.410 Divide 0.026 0.000 0.087 −0.262 0.315 High Low Judgmental 0.962 0.338 0.128 0.537 10.386
Combination 0.154 0.095 0.157 −0.366 0.674 Divide 0.052 0.086 0.128 −0.373 0.476 High Judgmental 0.116 0.070 0.067 −0.106 0.337 Combination 0.237 0.143 0.081 −0.032 0.505 Divide 0.067 0.000 0.087 −0.222 0.355 Table conventions:
Judgmental=judgmental adjustment.
Combination=50–50 combination. Divide=divide-and-conquer.
Fig. 1. Estimated means and 95% confidence intervals for SF credibility, expertise, need for correction and integration method. The circle shows the only
treatment with a significant APE improvement over zero.
the results were robust; second, a time-based analysis of the data showed that relevant p-values appeared when ap-proximately half the sample had been collected, and did
not oscillate between significance and non-significance af-ter two thirds of the sample had been collected, supporting convergence over the current sample size.
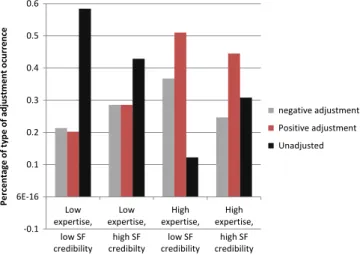
Fig. 2. Percentage of adjustment type occurrences by expertise and SF credibility groups.
Fig. 3. Adjustment size by SF credibility and expertise (divide-and-conquer and judgmental adjustment treatments only).
4.3. Adjustment behavior results
The method was not related either to the adjustment frequency when a correction was not needed (p
=
0.
433) or to the adjustment size when a correction was needed (p=
0.
567); therefore, there is no support for H3 or H2.The interactions between expertise and SF credibility
for the absolute size (p
=
0.
016) and adjustmentfre-quency direction relations were found to be significant (p
<
0.
001 for expertise in low SF credibility, but p>
0.
05 for expertise in high SF credibility). As is shown inFig. 2, participants in the high expertise/low SF credibil-ity condition tended to make more positive adjustments
(standardized residual
=
2.5), whereas participants inthe low expertise, low SF credibility condition tended to avoid making changes to the suggestions (standardized
residual
=
2.4), supporting H5b. However, although theymade adjustments less frequently than expected, partici-pants with low expertise and low SF credibility tended to
perform larger adjustments, as is shown inFig. 3, yielding a result contrary to that expected for H5a.
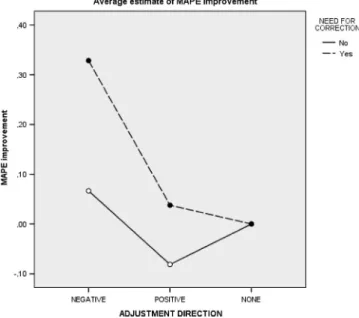
The best adjustments were negative ones when they were really needed, 95% CI [0.30, 0.49], asFig. 4shows. However, negative adjustments also improved the accu-racy significantly over positive adjustments when correc-tion was not needed, 95% CI [0.04, 0.13].
4.4. Expert rationales
For 28.6% of the forecasts collected, the experts gave no reasons for their final forecasts. A single causal force to justify the final forecast was elicited in 62.4% of cases, and multiple causal forces were elicited in only 9% of cases. When rationales were provided, the average length was 29 words, with a high variability (ranging from 1 to 260 words).
Five main types of reasons were elicited from experts when asked for rationales to produce their final forecasts
Fig. 4. MAPE improvement by adjustment direction vs. need for correction.
in all companies. First, historical reasons were quoted (40.4%). These reasons included seasonality on an annual basis and long-term trends of ascent or descent, and were usually elaborated further in the 50–50 combination method, with specific figures being compared, whereas the historical reasons given in the other methods were generally shorter and more direct.
Second, marketing actions were mentioned (25.5%). In addition to specific promotions, there were also adver-tising plans, brand awareness strategies, new strategic deals that were close to being sealed, and new distribu-tion strategies that made experts believe that the forecast should be changed.
Third, supply chain reasons were given specific impor-tance in judgmental forecasting (17.7%). These reasons in-cluded both sides of the supply chain. The main reasons were current inventory levels, whether in the distributor or in the company, but previously settled pre-orders and lead times were also cited.
Fourth, reasons related to organizational goals and job performance were cited (9.4%). These reasons for settling a forecast included quarter or end-of-year deadlines and job responsibilities to comply with target sales, linked to perceived control.
Finally, business environment reasons outside the com-pany’s control were mentioned, including economy and market trends, legal decisions, and competition actions (7%).
There were also reasons related to the specific industry and sector. For example, product life-cycle reasons were cited frequently in the technology company, whereas the weather was mentioned as an important causal force in the chemical company. These were included in the previous analysis under appropriate labels.
Rationales were found to be significantly related to the integration method used (p
<
0.
01). For instance, his-torical reasons were quoted more than expected in 50–50 combination, whereas they were quoted less than expectedin divide-and-conquer. There was also a relationship be-tween the type of rationale and the adjustment direction (p
<
0.
01). Negative adjustments were more frequent with supply and business environment reasons, whereas positive adjustments were more frequent when marketing and organizational goal rationales were quoted.5. Discussion
This study aimed to compare the accuracy improve-ment and adjustimprove-ment behaviors of three human–computer integration methods that can be used to generate demand forecasts with real products and practitioners. The study considered the potential effects of three important vari-ables on the resulting forecast accuracy and forecaster be-havior, namely the system forecast’s need for correction, the relative expertise of the forecaster, and the relative credibility of the system forecast. We observed improve-ments in accuracy for forecasters with higher relative ex-pertise and a low credibility of system forecasts when the system forecast required correction and the judgmental ad-justment method was applied. We also observed different adjustment behavior patterns for different levels of exper-tise and credibility of system forecasts.
Our study proposed and tested the use of a general scale of employee job expertise as a proxy for discriminating be-tween levels of demand forecasting domain knowledge. Al-though we strongly encourage further studies to test the validity and reliability of this scale, the preliminary results are promising. The scale is based on peer ratings, and there-fore is subject to power biases in organizations; however, it is clearly an improvement on the widely used, largely unstructured methods of selecting experts based on public recognition or co-nomination. It could be combined with the development of short questionnaires that were tailored to the specific domain knowledge, or with the measures of personal characteristics that have been found recently to improve forecasting in other fields (Mellers et al., 2015).
However, our results show that the development of a more structured mechanism for distinguishing expertise in de-mand forecasting judgmental adjustments is a task worth attempting.
Although it is reasonable to expect higher levels of ac-curacy among employees with more expertise, it is also true that the evidence found in research so far has been mixed (Lawrence et al., 2006). These mixed results might be due to the hidden interaction effects of other vari-ables that have not been considered simultaneously in previous studies. In this research, we have studied three variables (i.e., credibility of system forecasts, integration method and need for correction) that may explain why experts sometimes perform better and sometimes do not. We found that experts generally perform well, but partic-ularly when the perceived credibility of system forecasts is low. One possible explanation is that low levels of con-fidence in the system’s suggestions allow experts to de-tach themselves from the system forecast enough when this is really needed, thus avoiding the anchor and adjust-ment heuristic. This explanation suggests that a healthy skepticism about system forecasts may reduce the possible anchoring effects of such forecasts, with such bias reduc-tion becoming particularly useful when the experts believe that they need to modify the system forecast by a substan-tial amount. A possible subsequent laboratory experiment could evaluate the strength of the anchor and adjustment heuristic under different levels of system forecast credibil-ity, presenting the system forecast simultaneously with ra-tionales for modifying it substantially.
A second explanation could be that a low credibility reduced forecasters’ complacency about the support sys-tem’s suggestions (Goddard, Roudsari, & Wyatt, 2012), thus motivating them to add their knowledge and feel account-able for the results (Fildes, Goodwin, & Lawrence, 2006;
Wright, Lawrence, & Collopy, 1996). In support of this, fore-casters with relatively high levels of expertise tended to make adjustments in almost all cases. This may be because they think that they need to contribute to the forecast somehow (Gönül, Önkal, & Goodwin, 2009). In our study, this pattern of highly frequent adjustments increased if the perceived credibility of the system forecasts was low.
In additionally, the benefit to accuracy of having an ex-pert was observed only when the judgmental adjustment method of integration was used. One possible explanation could be that judgmental adjustment was the only method in this study that allowed the forecaster to access all rele-vant information, and none of the other methods reduced the biases sufficiently to overcome this information loss. The 50–50 combination method made the forecasters fo-cus on the detection of historical trends (as revealed in their forecast rationales), thus effectively underweighting any additional contextual knowledge that they may have had. In this way, the system and forecaster inputs were not independent; and therefore, 50–50 combination under-performed relative to judgmental adjustment. In contrast, a lack of access to system forecasts in the divide-and-conquer method made it difficult for experts to assess either the quality of the system advice or the amount of correction needed. The divide-and-conquer method did not appear to either reduce the frequency of adjustment when correc-tion was not needed, or increase the adjustment size when
correction was needed. Overall, our results imply that try-ing to reduce the forecasters’ bias through information re-strictions did not work, whereas providing experts with access to all relevant information helped them to assess the need for change. In addition, allowing access to infor-mation may offer the forecaster more control, which may result in a sense of satisfaction or comfort in doing the task. A follow-up study could test whether providing only the system forecast would be enough to give the forecaster ac-cess to all relevant information, since the system forecast can be regarded as a summary of the historical track.
The judgmental integration task can be regarded as a joint effort between support systems and experts to de-velop a better forecast. In this regard, an analysis of pro-cess gains versus expert knowledge elicitation losses can be conducted (Bedard, Biggs, Maroney, & Johnson, 1998;
Rowe, Wright, & Bolger, 1991). Divide-and-conquer was un-able to deliver process gains through bias reduction, and may have generated process losses by forbidding partic-ipants access to relevant information. 50–50 combination generated expertise overlap by focusing the expert on in-formation that the support system was already assessing, thus reducing the chance of diverse inputs and knowl-edge being included in the task. As a consequence, this integration procedure did not generate process gains that surpassed the sum of the parts. Meanwhile, judgmental ad-justment was closer to a group process in which an expert is faced with another suggestion (the system advice) and can potentially generate a process gain through knowledge pooling and sharing. However, the presence of possible bi-ases, such as anchor and adjustment, requires experts to exhibit healthy skepticism in order to avoid process losses. Finally, our results indicate that when corrections were not needed, negative adjustments led to an improvement in accuracy, whereas positive adjustments led to a deterioration, leading to a net sum of no improvement. Thus, expertise still contributed on occasions when small adjustments were required (i.e., adjustments when the realized value falls inside the 95% interval of the system forecast), but its effects were obscured by overoptimism and a predisposition to adjust. When corrections were needed, the overall result of the adjustments was an improvement in accuracy, due to the benefits of well-sized adjustments that were usually negative.
We observed associations between negative adjust-ments and business environment or supply chain reasons in the companies studied. Supply chain and business envi-ronment reasons can reflect a current state of affairs that is outside company control (while clearly affecting possi-ble demand outcomes), whereas market actions and goal-oriented reasons may be related more to a bet into the future, depending partly on business actions and being mediated by illusion of control. These results led us to sug-gest that the elicitation of knowledge be focused on situa-tions that are outside the company’s control, rather than on plans or promotions that are under the company’s control and can be modeled through statistical analysis (Trapero et al., 2013).
At least three limitations of the study should be dis-cussed. First, the participants changed methods randomly
every month and were not given feedback on their perfor-mances, thus precluding the evaluation of possible learn-ing effects. However, a previous study found small or no learning effects from outcome feedback (Lim & O’Connor, 1995). Second, the forecasts elicited had no consequences for either the company’s decision making or the partici-pants’ performance evaluations; therefore, we do not ex-pect political pressures or organizational cultures to have any major effects on their responses. Although the nature of our task did not allow a complete investigation of such effects, the presence of adjustment reasons related to goals and perceived control indicates that such pressures played at least a partial role in our task. We believe that the impli-cations of our results will be valid in real settings.
Finally, the study included a set of specific companies and selected products. Differences among industries, though not evaluated in this study, could be an interesting avenue for future research. In addition, the participants in the study were asked to focus on only a few products, whereas in real settings, forecasters are typically required to forecast huge numbers of products in specific locations. The consequences of this are twofold. First, we believe that the application of intimate product knowledge – and therefore judgmental adjustment expertise – for every disaggregation level is practically impossible in such a large task with the usual time restrictions. We selected experts and aggregation levels for each product for which environmental and product knowledge could be elicited, and the same would need to be done in order to apply our results in real settings. A possible future research direction could relate to best practices in selecting the products and aggregation levels for which expertise can most clearly make a difference. Second, intermittent demand was not considered, given the aggregation level. The next step would be to evaluate possible extensions of the present study to explore this important forecasting problem.
Although it is true that no generalizations outside this context should be made, we believe that our efforts to work with companies in different sectors, with participants who have a wide range of demographic characteristics and ex-perience, in physical settings that resemble the day-to-day conditions of forecasters in their workplaces, and with products that are important to their positions within their companies, provide a desirable backdrop for forecasting expertise and related processes. Therefore, our results may be viewed as providing a robust starting point for explor-ing the issues of expertise and system forecast credibility for forecasters in similar industrial sectors.
6. Implications for forecasting practice
Using experts in a demand forecasting field study, the current work addresses important issues of expert knowl-edge elicitation in a real (and ecologically valid) forecast-ing framework. Our findforecast-ings contribute to the discussion of four important questions that are discussed widely in fore-casting practice.
The first question relates to the conditions for selecting forecasters when adjusting system forecasts. Our results show that an expertise in key job positions is a necessary but not sufficient condition for a good forecasting perfor-mance. In order to be able to modify the system forecast by
the right amount when it is really needed, such expertise needs to be combined with a healthy skepticism about the credibility of system forecasts.
Second, should companies invest to improve adjust-ment processes, or is it better (for accuracy) to rely on sys-tem projections? Our results suggest that, in the long run and with a proficient selection of experts, the accuracy is improved by using judgmental adjustment when useful in-formation is incorporated into the adjustment process. If a greater gain is sought, group processes that are managed effectively so as to avoid political and organizational pres-sures and integrate individual adjustments (such as Del-phi) will definitely prove valuable. The categorization of adjustment rationales proposed in this study might be a good starting point for the construction of scenarios to as-sist such processes, particularly encouraging the analysis of causal forces that are outside business control.
Another possible mechanism for increasing the gain is the use of bias-reduction techniques for expert forecast-ers. Restricting the information available to experts does not appear to be a desirable method for avoiding biases. In-stead, a healthy skepticism towards system forecasts could be reinforced by highlighting the limitations of system forecasts in situations such as inventory shortages or en-vironmental/structural changes, emphasizing the poten-tial negative effects. Overoptimism could be reduced by challenging attempted positive adjustments (e.g., based on company plans and promotions), while letting negative ad-justments go unchallenged. Periodic training and the use of feedback mechanisms for tracking and combating well-known cognitive biases (e.g., overconfidence, desirability bias) may also prove effective (Benson & Önkal, 1992).
A third question relates to whether or not system fore-casts should be given to forecasters. Despite the biases that may be generated by the presence of a system forecast, such as anchoring and an excessive weighting of past data, it appears that the availability of the system forecast im-proves the accuracy of the integrated forecasts on aver-age. In addition, we also observed that the practitioners were quite uneasy when this information was withheld, a phenomenon that may be related to a perceived loss of control and/or a reduction in confidence due to the lack of a starting benchmark. Further work comparing the presence or absence of system forecasts and/or histori-cal information might help to clarify whether the system forecast can replace the historical information. Along sim-ilar lines, research that incorporated qualitative method-ologies for studying expert knowledge elicitation would prove extremely useful in gaining a better understanding of the reasons behind forecasters’ use/misuse of system forecasts.
Lastly, although it is not possible to know in advance whether a modification will be needed to improve the fore-casting performance, there are occasions on which such tweaks are clearly warranted: for instance, when there are supply chain restrictions, structural changes in the time se-ries, inflection points in a product life cycle, sudden envi-ronmental changes, and/or anticipated competitor moves. In such situations, our findings suggest that the systematic use of judgmental adjustment be encouraged with ers who possess (i) high expertise in judgmental forecast-ing and good domain knowledge, along with (ii) a healthy
Table C.1
Expertise knowledge subscale.
Completely agree Partly agree Neutral Partly disagree Completely disagree This person has knowledge that is specific to his or her field of work.
This person shows that they have the education necessary to be an expert in their field
This person has knowledge about their field This person conducts research related to their field
This person has the qualifications required to be an expert in their field This person has been trained in his or her area of expertise
skepticism about support system advice that encourages a realistic/unbiased assessment of system forecasts.
Appendix A 50–50 combination:
This month, we are going to generate a demand forecast for product (name of the product) in (units: dollars, number of items. . . ). If you don’t understand the product definition, please ask for clarification. The screen is showing the historical demand for this product during the last (number of periods) periods in the graph and in the table. You are free to consult any additional (non-historical) information you already have that might be related to the product and their business development. Please indicate what you think the demand will be for this product (name of the product) in (units: dollars, number of items. . . ) for next month, taking into account your judgment and knowledge of the product and the business.
(After the forecast is produced) Please explain your motivations and reasons for this result.
Judgmental adjustment:
This month, we are going to generate a demand forecast for product (name of the product) in (units: dollars, number of items. . . ). If you don’t understand the product definition, please ask for clarification. The screen is showing the historical demand for this product during the last (number of periods) periods in the graph and in the table and a system forecast for the following month in the graph and in the table. This forecast has taken in account three elements: historical trend of data, seasonal effects, and increasing/decreasing effects. You are free to consult any additional (non-historical) information you already have that might be related to the product and their business development. Please indicate what you think the demand will be for this product (name of the product) in (units: dollars, number of items. . . ) for next month, taking into account your judgment and knowledge of the product and the business.
(After the forecast is produced) Please explain your motivations and reasons for this result.
Divide-and-conquer:
This month, we are going to generate a demand forecast for product (name of the product) in (units: dollars, number of items. . . ). If you don’t understand the product definition, please ask for clarification. You are free to consult any additional (non-historical) information you already have that might be related to the product and their business development. A system forecast for next month has been
produced. This forecast has taken into account three elements: historical trend of data, seasonal effects, and increasing/decreasing effects. Please tell us if you would keep or modify this system forecast for next month, taking into account your judgment and knowledge of the product and the business.
(If the subject wants to modify the forecast) Please indi-cate how large the modification will be and in what direc-tion. You are free to specify a percentage or a value in units of modification.
(After the forecast is produced) Please explain your mo-tivations and reasons for this result.
Appendix B
Credibility of system forecasts scale:
In your opinion, a system forecast is (mark just one option for each question):
Fair/unfair Biased/unbiased
Tells the whole story/does not tell the whole story Accurate/inaccurate
Can be trusted/cannot be trusted.
Appendix C
Expertise knowledge subscale
SeeTable C.1.
References
Alvarado-Valencia, J. A., & Barrero, L. H.(2014). Reliance, trust and heuristics in judgmental forecasting. Computers in Human Behavior, 36, 102–113.
Alvarado-Valencia, J.A., & García Buitrago, J.A. (2013). Selecting and using an adequate disaggregation level in time series forecasting: A study case in a subscription business model company through the analytic hierarchy process. Selección y utilización de niveles de desagregación adecuados en pronósticos de series temporales: Caso de estudio en una empresa de suscripción utilizando el proceso analítico jerárquico. 15 (1) 45–64.
Armstrong, J. S.(2006). Findings from evidence-based forecasting: meth-ods for reducing forecast error. International Journal of Forecasting, 22(3), 583–598.
Aspinall, W.(2010). A route to more tractable expert advice. Nature, 463(7279), 294–295.
Bedard, J. C., Biggs, S. F., Maroney, J. J., & Johnson, E. N.(1998). Sources of process gain and loss from group interaction in performance of analytical procedures. Behavioral Research in Accounting, 10, 207–239.
Benson, P. G., & Önkal, D.(1992). The effects of feedback and training on the performance of probability forecasters. International Journal of Forecasting, 8(4), 559–573.
Blattberg, R. C., & Hoch, S. J.(1990). Database models and managerial intuition: 50% model + 50% manager. Management Science, 36(8), 887–899.