The biological basis for regional and inter-species differences in cerebral cortical morphology is poorly understood. We focused on consanguineous Turkish families with a single affected member with complex bilateral occipital cortical gyration abnormalities. By using whole-exome sequencing, we initially identified a homozygous 2-bp deletion in LAMC3, the laminin 3 gene, leading to an immediate premature termination codon. In two other affected individuals with nearly identical phenotypes, we identified a homozygous nonsense mutation and a compound heterozygous mutation. In human but not mouse fetal brain, LAMC3 is enriched in postmitotic cortical plate neurons, localizing primarily to the somatodendritic compartment. LAMC3 expression peaks between late gestation and late infancy, paralleling the expression of molecules that are important in dendritogenesis and synapse formation. The discovery of the molecular basis of this unusual occipital malformation furthers our understanding of the complex biology underlying the formation of cortical gyrations.
Extensive and stereotypic gyrations (convolutions) of the cerebral cortex are striking features of the human brain1,2. The cerebral cor-tex develops through a series of highly coordinated phases including proliferation of neural progenitors, migration of postmitotic cells from the germinal matrix to the newly forming cortex and organiza-tion of the mature cortical cytoarchitecture. Among these processes, the biological basis for the formation of cortical convolutions has been the subject of much debate3–7. The study of malformations of
cortical development (MCD) that interfere with the proper forma-tion of the typical cortical gyraforma-tion pattern in humans provides a unique opportunity to understand this elegant process. We applied whole-exome capture and sequencing to the study of consanguine-ous, single-affected–member Turkish kindreds with malformations of occipital cortex gyration, notably characterized by the presence of both pachygyria and polymicrogyria8,9, entities traditionally thought to arise from different pathogenic mechanisms reflecting abnormali-ties in neuronal migration and cortical organization, respectively10.
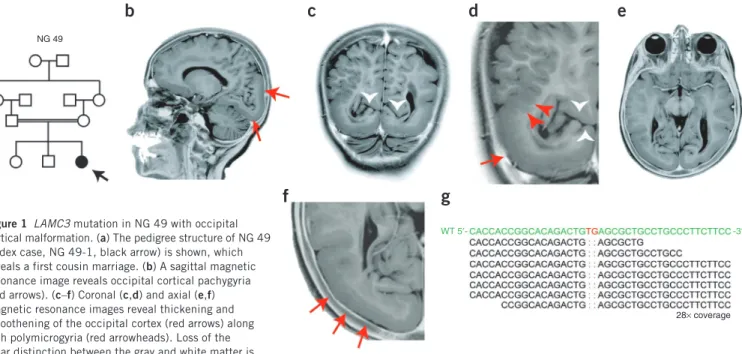
The first index case, designated NG 49-1 (Fig. 1a, Supplementary Fig. 1 and Supplementary Note), presented to medical attention with absence seizures and mild developmental delay during early child-hood. Magnetic resonance imaging (MRI) revealed bilateral occipital pachygyria mainly localizing to the lateral surface, characterized by smoothening of the occipital cortices with loss of secondary and ter-tiary gyri, and polymicrogyric areas, characterized by the formation of numerous small gyri at the junction of the parieto-occipital lobes (Fig. 1b–f and Supplementary Videos 1 and 2). Following genome-wide genotyping, which confirmed consanguinity with an inbreeding coefficient of 5.77, and determination of homozygous genomic seg-ments (>2.5 cM each) (Supplementary Table 1), we performed whole-exome capture and sequencing with high sensitivity and specificity using NimbleGen liquid-phase arrays and the Illumina Genome Analyzer-IIx instrument as described previously11 (Supplementary Tables 2 and 3). By focusing on the homozygous intervals (Supplementary Table 4), we identified a homozygous 2-bp deletion in LAMC3 (Laminin γ3), which is located on chromosome 9; this mutation is inferred to result
Recessive LAMC3 mutations cause malformations of
occipital cortical development
Tanyeri Barak
1–3,18, Kenneth Y Kwan
2,4,18, Angeliki Louvi
1,2, Veysi Demirbilek
5, Serap Saygı
6, Beyhan Tüysüz
7,
Murim Choi
3, Hüseyin Boyacı
8,9, Katja Doerschner
8,9, Ying Zhu
2,4, Hande Kaymakçalan
10, Saliha Yılmaz
1–3,
Mehmet Bakırcıoğlu
1–3, Ahmet Okay Çağlayan
1–3, Ali Kemal Öztürk
1–3, Katsuhito Yasuno
1–3,
William J Brunken
11,12, Ergin Atalar
9, Cengiz Yalçınkaya
5, Alp Dinçer
13, Richard A Bronen
1,14, Shrikant Mane
3,15,
Tayfun Özçelik
16, Richard P Lifton
3,17, Nenad Šestan
2,4, Kaya Bilgüvar
1–3& Murat Günel
1–31Department of Neurosurgery, Yale School of Medicine, New Haven, Connecticut, USA. 2Department of Neurobiology, Yale School of Medicine, New Haven,
Connecticut, USA. 3Department of Genetics, Center for Human Genetics and Genomics and Program on Neurogenetics, Yale School of Medicine, New Haven,
Connecticut, USA. 4Kavli Institute for Neuroscience, Yale School of Medicine, New Haven, Connecticut, USA. 5Division of Child Neurology, Department of
Neurology, Istanbul University Cerrahpasa Faculty of Medicine, Istanbul, Turkey. 6Department of Neurology, Hacettepe University School of Medicine, Ankara,
Turkey. 7Division of Genetics, Department of Pediatrics, Istanbul University Cerrahpasa Faculty of Medicine, Istanbul, Turkey. 8Department of Psychology,
Bilkent University, Ankara, Turkey. 9National Magnetic Resonance Research Center, Bilkent University, Ankara, Turkey. 10Faculty of Arts and Sciences, Bahcesehir
University, Istanbul, Turkey. 11Department of Cell Biology, State University of New York (SUNY) Downstate Medical Center, Brooklyn, New York, USA. 12Department
of Ophthalmology, SUNY Downstate Medical Center, Brooklyn, New York, USA. 13Department of Radiology, Acibadem University School of Medicine, Istanbul,
Turkey. 14Department of Radiology, Yale School of Medicine, New Haven, Connecticut, USA. 15Yale Center for Genome Analysis, Yale School of Medicine,
New Haven, Connecticut, USA. 16Department of Molecular Biology and Genetics, Faculty of Science, Bilkent University, Ankara, Turkey. 17Howard Hughes Medical
Institute, Yale School of Medicine, New Haven, Connecticut, USA. 18These authors contributed equally to this work. Correspondence should be addressed to
M.G. ([email protected]).
Received 24 January; accepted 21 April; published online 15 May 2011; doi:10.1038/ng.836
© 20 11 Nat ur e Amer ica, Inc. All r ights r eser ved.
in a frameshift at codon 301 (of the 1,575 total encoded amino acids) and lead to an immediate premature termination (p.Cys301X) (Fig. 1g and Supplementary Fig. 2). Both parents were heterozygous for the variant (Supplementary Fig. 2a). These results suggested that the homozygous LAMC3 variant was the disease-causing mutation in this family.
We then searched for additional mutations in a cohort of 12 indi-viduals with MCD with homozygosity of at least 2.5 cM spanning LAMC3. Only one of these individuals (NG 367-1) had a diagnosis of occipital pachygyria, whereas the others were referred with various MCD phenotypes including polymicrogyria or lissencephaly, or were not otherwise specified. Sanger sequencing of the complete coding region of LAMC3 in these individuals revealed only one previously
unidentified, homozygous mutation at codon 157 resulting in pre-mature termination (p.Trp157X) in the subject with the diagnosis of occipital pachygyria (NG 367-1) (Fig. 2a,b and Supplementary Fig. 2b). Both parents of this individual were heterozygous for the variant (Supplementary Fig. 2b). Subject NG 367-1 had a phenotype almost identical to the first index case, NG 49-1 (Fig. 1), presenting to medical attention at age 10 years with seizures largely consisting of
a
b
c
d
e
f
g
NG 49
WT 5′- -3′
28× coverage
visualized in c and d, in which the white arrowheads mark the preserved calcarine fissure. Panels d and f are enlarged views of c and e, respectively.
Photographically inverted T2 images are shown. (g) Exome sequencing shows a 2-bp ‘TG’ deletion (marked in red in the wild-type (WT) sequence on top)
in the LAMC3. The depth of coverage across the variant was 28×, and all but one of the reads showed the deletion.
NG 367 Control NG 367 cc fm ifo/ilf NG 50 Superior cm A n t e r i o r P o s t e r i o r Superior Control NG 367 0 2.5 8 mm A n t e r i o r P o s t e r i o r Superior V2d V1 V2v V2d V2v V1 Superior Control NG 367
a
c
d
f
g
e
b
Figure 2 Additional LAMC3 mutations in individuals with occipital
cortical malformation. (a) Simplified pedigree structure of NG 367
(arrow, index case) shows a first cousin consanguineous union. (b) Axial,
enlarged axial and sagittal magnetic resonance images reveal cortical smoothening and thickening limited to the bilateral occipital cortices (red arrowheads). On the sagittal image, polymicrogyria (red circle) at the junction of the pachygyric occipital cortex with the parietal lobe is seen. (c) Three-dimensional reformatting of magnetic resonance images
with cortical thickness color mapping shows the occipital cortex to be markedly thickened (yellow color, >8 mm) as compared to a control subject in which the cortex is less than 4 mm in thickness. (d) The
retinotopic mapping reveals the anatomical locations of the primary visual areas and the spatial patterns of their activity in response to visual stimulation in NG 367-1 to be similar to a control subject. (e) Diffusion tensor imaging tractography reveals the disorganization
of short association fibers in the posterior part of the occipital lobe in areas adjacent to the pachygyric regions (arrows). cc, corpus callosum; ifo, inferior fronto-occipital fasciculus; fm, forceps major; ilf, inferior longitudinal fasciculus. (f) Simplified pedigree structure of NG 50
(arrow, index case) shows a second cousin consanguineous union. (g) The
axial, coronal and sagittal magnetic resonance imaging reveals occipital pachygyria (red arrowheads) in association with polymicrogyric areas. On the coronal image in the middle, a cerebrospinal fluid (CSF) cleft, which is typically associated with polymicrogyria, is visible (black arrowheads).
Figure 1 LAMC3 mutation in NG 49 with occipital
cortical malformation. (a) The pedigree structure of NG 49
(index case, NG 49-1, black arrow) is shown, which reveals a first cousin marriage. (b) A sagittal magnetic
resonance image reveals occipital cortical pachygyria (red arrows). (c–f) Coronal (c,d) and axial (e,f)
magnetic resonance images reveal thickening and smoothening of the occipital cortex (red arrows) along with polymicrogyria (red arrowheads). Loss of the clear distinction between the gray and white matter is
© 20 11 Nat ur e Amer ica, Inc. All r ights r eser ved.
staring and blinking spells (Supplementary Note and Supplementary Video 3). On her current examination at age 33 years, this subject was found to be neurologically intact with normal visual acuity and reportedly average intelligence. MRI revealed prominent bilateral smoothening and thickening of the lateral occipital cortex, which is associated with polymicrogyria (Fig. 2b,c, Supplementary Fig. 3a and Supplementary Videos 4 and 5). However, despite these gross structural findings, retinotopic mapping using functional MRI indi-cated that the relative locations and functions of the primary visual areas were largely indistinguishable from control subjects (Fig. 2d, Supplementary Note and Supplementary Fig. 3b)12,13. Nonetheless, diffusion tensor imaging (DTI) tractography showed markedly lower fractional anisotropy and elevated radial diffusivity values in areas adjacent to the pachygyric region, suggesting microstructural changes of white matter, possibly caused by fiber disorganization (Fig. 2e and Supplementary Note).
Finally, we investigated the remaining affected individuals in our neurogenetics cohort of over 600 people to assess whether any had similar MRI findings. We identified only one other individual, NG 50-1, who had an almost identical MRI picture. This subject was the product of a second cousin marriage (Fig. 2f) and presented to medical attention at the age of 11 with episodes of vision loss consistent with seizures; imaging studies again revealed bilateral occipital pachygyria associated with polymicrogyria (Fig. 2g, Supplementary Fig. 1b and Supplementary Note). We found NG 50-1 to be heterozygous for the interval surrounding LAMC3, suggest-ing potential genetic locus heterogeneity (Supplementary Table 5). However, exome sequencing revealed no homozygous nonsense or frameshift mutations, whereas all eight new homozygous mis-sense variants identified affected non-conserved domains of various proteins located within the autozygous intervals, suggesting that they were unlikely to be disease causing (Supplementary Table 6). Subsequent examination of the LAMC3 sequence available from the exome sequencing data followed by confirmation using PCR and Sanger sequencing identified a compound heterozygous mutation, with a premature termination mutation at codon 386 (resulting in p.Gln386X) and a missense mutation (resulting in p.Gly350Arg) at a position completely conserved among vertebrate orthologs (Supplementary Fig. 2c and Supplementary Fig. 4) and predicted to be damaging. One mutation was inherited from each parent (Supplementary Fig. 2c).
None of the four mutations newly discovered in LAMC3 had been previously reported in the dbSNP or 1000 Genomes databases and all were absent from our screening of 400 Turkish control subjects. They were also absent from our whole-exome sequence database
of 1,023 subjects with non-neurological diseases in which we only identified four different heterozygous LAMC3 variants (p.Cys273Tyr, p.Gly275Glu, p.Gln928X and c.976+1G>A) with a collective allele fre-quency of less than 1 in 500, consistent with these deleterious alleles being under strong purifying selection. The rarity of such deleteri-ous mutations and the finding of new homozygdeleteri-ous and compound heterozygous mutations in LAMC3 in all three subjects with occipi-tal pachygyria and polymicrogyria provide conclusive evidence that recessive LAMC3 mutations cause this syndrome.
We next investigated the expression of LAMC3 in the developing human fetal brain at 20 post-conceptual weeks (PCW) and showed that it was enriched in the cortical plate, a dense layer of post-migratory pyramidal neurons, and was also present at lower levels in the ventricular and subventricular zones, the germinal layers of the cortex (Fig. 3 and Supplementary Fig. 5). In contrast, we observed a strikingly different expression pattern in the embryonic mouse brain, where Lamc3 expression was absent from the neuronal cells and was instead restricted to the embryonic cerebral vasculature and the meninges from embryonic day (E) 13.5 onwards (Fig. 3b and Supplementary Fig. 6). This finding, which is consistent with the pre-vious observation that Lamc3 deletion in mice is silent with no appar-ent phenotype14, suggested that LAMC3 expression has diverged on the mammalian lineage, making the mouse a poor model for under-standing LAMC3 function in human cortical development.
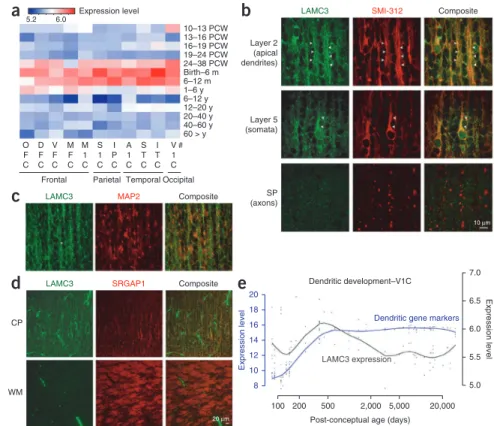
We then investigated the spatial and temporal changes in expres-sion during human cortical development and first detected LAMC3 transcripts after mid-gestation, which peaked at an interval extending from late fetal development to late infancy (12 months) (Fig. 4a), coinciding with the period of cortical organization that takes place after neural stem cell proliferation and migration of postmitotic neurons to the cortical plate. Examination of LAMC3 expression at the subcellular level supported these observations, showing that LAMC3 primarily localizes to the soma and apical dendrite of pyramidal neurons (Fig. 4b,c and Supplementary Fig. 7) and is barely detected along or near the axons (Fig. 4d). A role for LAMC3 in extracellular matrix organization of the soma-todendritic compartment was further supported by an analysis of the Human Brain Transcriptome database15, showing that the developmental expression pattern of LAMC3 parallels that of other molecules important for dendritogenesis (Fig. 4e)16,17 and syn-apse formation (Supplementary Note, Supplementary Fig. 8 and Supplementary Table 7)18.
Laminins are extracellular cell adhesion molecules mostly local-izing to basement membranes19 and are essential for early embryonic development. They are cross-shaped heterotrimers consisting of α, β
CP
a
b
c
LAMC3 LAMC3 SOX2 NeuNIZ oSVZ SVZ VZ CP IZ 20 µm SVZ VZ E17.5 E14.5 E13.5
Figure 3 Species differences in expression of LAMC3 in the cerebral
cortex. (a) In situ hybridization of mid-fetal human brain (20 PCW)
shows robust LAMC3 expression in the cortical plate (CP) and within the germinal zones of the neocortical wall, including the ventricular zone (VZ) and subventricular zone (SVZ), and the outer SVZ (oSVZ). IZ, intermediate zone. (b) In contrast, Lamc3 expression in the developing
mouse brain (E13.5 to E17.5) is limited to the vasculature and meninges. (c) Human fetal neocortex (20 PCW) immunostained for LAMC3 (green),
the post-mitotic neuronal marker NeuN (red) and the neural stem cell marker SOX2 (blue) shows LAMC3 to be strongly expressed in post-mitotic NeuN-positive neurons that have migrated and settled in the cortical plate (CP). Although LAMC3 is not expressed in the intermediate zone, which contains migrating neurons, expression is seen in SOX2-positive neural stem cells in the ventricular zone and subventricular zone. In addition, LAMC3 is expressed in the basal lamina of blood vessels. Composite images are shown on the right. See supplementary Figure 5 for
individual panels. © 20 11 Nat ur e Amer ica, Inc. All r ights r eser ved.
and γ chains. Mutations in various laminin molecules lead to diverse pathologies including Pierson syndrome (congenital nephrotic syndrome with or without ocular abnormalities caused by LAMB2 mutations), junctional epidermolysis bullosa (α3, β3 and γ2 chain mutations) and congenital merosin-deficient muscular dystrophy type 1A (LAMA2 mutations), which is sometimes associated with cobblestone lissencephaly and occipital pachygyria19–21. Mutations in LAMC3 have not previously been reported. LAMC3 is not thought to associate exclusively with the basement membrane—it can bind either to nidogen or to α6β1-integrin and is expressed in mouse retina and brain vessels22–25, with Lamc3 knockout mice lacking any overt phenotypes14,26.
Little is known about the precise molecular mechanisms underly-ing human cortical gyration. Here we present conclusive genetic evi-dence that recessive LAMC3 mutations cause human occipital cortical malformations characterized by complex gyration abnormalities and challenge the concept that cortical smoothening needs to be caused by disruption of early events in cortical neuronal migration exclusively. Further studies are needed to identify other molecules involved in the intricate process of cortical organization and to understand why the phenotype associated with LAMC3 mutations is restricted to the occipital lobes.
URLs. dbSNP, http://www.ncbi.nlm.nih.gov/projects/SNP/; 1000 Genomes Project, http://www.1000genomes.org/; Human Brain Transcriptome database, http://www.humanbraintranscriptome.org/; RefSeq, http://www.ncbi.nlm.nih.gov/RefSeq/; DAVID Bioinformatics Resources, http://david.abcc.ncifcrf.gov/; Freesurfer, http://surfer. nmr.mgh.harvard.edu/; Java programming package, http://bilkent. edu.tr/~hboyaci/PsychWithJava; MedINRIA, http://www-sop.inria. fr/asclepios/software/MedINRIA/index.php.
MeThods
Methods and any associated references are available in the online version of the paper at http://www.nature.com/naturegenetics/. Accession codes. LAMC3 data are deposited in RefSeq under acces-sion number NM_006059.
Note: Supplementary information is available on the Nature Genetics website.
ACKNOWLEDGMENTS
We are indebted to the subjects and families who have contributed to this study. We would like to thank M. State and J. Noonan for critical comments regarding the study and C. Camputaro for her help with the imaging studies. We acknowledge the use of Yale University Biomedical High Performance Computing Center for data analysis and storage. This study was supported by the Yale Program on Neurogenetics, the Yale Center for Human Genetics and Genomics, and US National Institutes of Health grants RC2NS070477 (to M.G.), UL1RR024139NIH (Yale Clinical and Translational Science Award) and UO1MH081896 (to N.S.). SNP genotyping was supported in part by a US National Institutes of Health Neuroscience Microarray Consortium award U24 NS051869-02S1 (to S.M.).
AUTHOR CONTRIBUTIONS
M.G. designed the study, and T.B., K.Y.K., A.L., R.P.L., N.S., K.B. and M.G. designed the experiments. T.B., K.Y.K., A.L., K.B., S.Y., M.B., A.O.C., A.K.O. and S.M. performed the experiments. V.D., S.S., B.T., H.K. and C.Y. identified, consented and recruited the study subjects and provided clinical information. A.D. and R.A.B. performed and evaluated magnetic resonance imaging. T.O., H.B., K.D. and E.A. performed and evaluated three-dimensional cortical reconstruction and functional imaging studies. M.C. and R.P.L. developed the bioinformatics scripts for data analysis. W.J.B. provided critical reagents. T.B., T.O., K.Y., K.B., R.P.L. and M.G. analyzed the genetics data. K.Y.K., A.L., Y.Z., N.S. and M.G. analyzed the expression data. T.B., K.Y.K., A.L., R.P.L., N.S., K.B. and M.G. wrote the paper.
COMPETING FINANCIAL INTERESTS
The authors declare competing financial interests: details accompany the full-text HTML version of the paper at http://www.nature.com/naturegenetics/.
Figure 4 Temporal and spatial LAMC3
expression pattern. (a) Heat map of LAMC3
expression in human brain. The strongest expression was seen between late gestation (24–38 PCW) and late infancy (6–12 post-natal months) and is more prominent within the temporo-occipital lobes as compared to frontal regions. PCW, post-conceptual weeks; m, month; y, year. #Brain regions sampled are listed under Methods. (b) Human fetal
neocortex (20 PCW) immunostained for LAMC3 (green) and the neuronal marker SMI-312 (red) reveals high expression in pyramidal neurons in a punctate pattern primarily localizing to the somata and apical dendrites (arrowheads), both at the proximal and distal segments. LAMC3 expression is not detected on axons as they leave the cortical plate (CP) and enter the subplate (SP). (c) In cortical layer 2, LAMC3 (green)
is localized to bundles of distal apical dendrites (arrowhead) immuno-positive for MAP2 (red), a marker for dendrites. (d) In the cortical plate, LAMC3 (green)
is expressed in pyramidal neurons. In the white matter (WM), where bundles of SRGAP1-positive corticofugal axons (red) are abundantly present, LAMC3 is weak or absent on axons but highly expressed in the neighboring blood vessels. (e) LAMC3
expression (black line) parallels that of genes
known to be expressed during the period of dendritogenesis (blue line) within the V1 visual cortex (V1C) during late fetal and early post-natal periods and declines after infancy. For a and e, log2-transformed expression values are shown (Online Methods).
Expression level 5.2 6.0 10–13 PCW 13–16 PCW 16–19 PCW 19–24 PCW 24–38 PCW Birth–6 m 6–12 m 1–6 y 6–12 y 12–20 y 20–40 y 40–60 y 60 > y
Frontal Parietal Temporal Occipital O F C D F C V F C M F C M 1 C S 1 C I P C A 1 C S T C I T C V 1 C #
c
LAMC3 MAP2 CompositeLAMC3 CP SRGAP1 Composite WM 20 µm
d
b
LAMC3 SMI-312 CompositeLayer 2 (apical dendrites) Layer 5 (somata) SP (axons) 10 µm
e
Dendritic development–V1C Expression leve l Expression levelDendritic gene markers
LAMC3 expression 20 7.0 18 16 14 12 10 8 6.5 6.0 5.5 5.0 100 200 500 2,000 5,000 20,000
Post-conceptual age (days)
a
© 20 11 Nat ur e Amer ica, Inc. All r ights r eser ved.Published online at http://www.nature.com/naturegenetics/.
Reprints and permissions information is available online at http://npg.nature.com/ reprintsandpermissions/.
1. Rakic, P. Specification of cerebral cortical areas. Science 241, 170–176 (1988). 2. Hofman, M.A. Size and shape of the cerebral cortex in mammals. I. The cortical
surface. Brain Behav. Evol. 27, 28–40 (1985).
3. Caviness, V.S. Jr. Mechanical model of brain convolutional development. Science 189, 18–21 (1975).
4. Van Essen, D.C. A tension-based theory of morphogenesis and compact wiring in the central nervous system. Nature 385, 313–318 (1997).
5. Kriegstein, A., Noctor, S. & Martinez-Cerdeno, V. Patterns of neural stem and progenitor cell division may underlie evolutionary cortical expansion. Nat. Rev. Neurosci. 7, 883–890 (2006).
6. Piao, X. et al. G protein-coupled receptor-dependent development of human frontal cortex. Science 303, 2033–2036 (2004).
7. Kostovic, I. & Rakic, P. Developmental history of the transient subplate zone in the visual and somatosensory cortex of the macaque monkey and human brain. J. Comp. Neurol. 297, 441–470 (1990).
8. Ferrie, C.D., Jackson, G.D., Giannakodimos, S. & Panayiotopoulos, C.P. Posterior agyria-pachygyria with polymicrogyria: evidence for an inherited neuronal migration disorder. Neurology 45, 150–153 (1995).
9. Ben Cheikh, B.O. et al. A locus for bilateral occipital polymicrogyria maps to chromosome 6q16-q22. Neurogenetics 10, 35–42 (2009).
10. Barkovich, A.J., Kuzniecky, R.I., Jackson, G.D., Guerrini, R. & Dobyns, W.B. A developmental and genetic classification for malformations of cortical development. Neurology 65, 1873–1887 (2005).
11. Bilgüvar, K. et al. Whole-exome sequencing identifies recessive WDR62 mutations in severe brain malformations. Nature 467, 207–210 (2010).
12. Sereno, M.I. et al. Borders of multiple visual areas in humans revealed by functional magnetic resonance imaging. Science 268, 889–893 (1995).
13. Wandell, B.A., Dumoulin, S.O. & Brewer, A.A. Visual field maps in human cortex. Neuron 56, 366–383 (2007).
14. Dénes, V. et al. Laminin deficits induce alterations in the development of dopaminergic neurons in the mouse retina. Vis. Neurosci. 24, 549–562 (2007).
15. Johnson, M.B. et al. Functional and evolutionary insights into human brain development through global transcriptome analysis. Neuron 62, 494–509 (2009).
16. Mrzljak, L., Uylings, H.B., Kostovic, I. & van Eden, C.G. Prenatal development of neurons in the human prefrontal cortex. II. A quantitative Golgi study. J. Comp. Neurol. 316, 485–496 (1992).
17. Petanjek, Z., Judas, M., Kostovic, I. & Uylings, H.B. Lifespan alterations of basal dendritic trees of pyramidal neurons in the human prefrontal cortex: a layer-specific pattern. Cereb. Cortex 18, 915–929 (2008).
18. Huttenlocher, P.R. & Dabholkar, A.S. Regional differences in synaptogenesis in human cerebral cortex. J. Comp. Neurol. 387, 167–178 (1997).
19. Durbeej, M. Laminins. Cell Tissue Res. 339, 259–268 (2010).
20. Helbling-Leclerc, A. et al. Mutations in the laminin alpha 2-chain gene (LAMA2) cause merosin-deficient congenital muscular dystrophy. Nat. Genet. 11, 216–218 (1995).
21. Jones, K.J. et al. The expanding phenotype of laminin alpha2 chain (merosin) abnormalities: case series and review. J. Med. Genet. 38, 649–657 (2001). 22. Gersdorff, N., Kohfeldt, E., Sasaki, T., Timpl, R. & Miosge, N. Laminin γ3 chain binds
to nidogen and is located in murine basement membranes. J. Biol. Chem. 280, 22146–22153 (2005).
23. Koch, M. et al. Characterization and expression of the laminin γ3 chain: a novel, non-basement membrane-associated, laminin chain. J. Cell Biol. 145, 605–618 (1999).
24. Libby, R.T. et al. Laminin expression in adult and developing retinae: evidence of two novel CNS laminins. J. Neurosci. 20, 6517–6528 (2000).
25. Yan, H.H. & Cheng, C.Y. Laminin α3 forms a complex with β3 and γ3 chains that serves as the ligand for α 6β1-integrin at the apical ectoplasmic specialization in adult rat testes. J. Biol. Chem. 281, 17286–17303 (2006).
26. Pinzón-Duarte, G., Daly, G., Li, Y.N., Koch, M. & Brunken, W.J. Defective formation of the inner limiting membrane in laminin α2- and γ3-null mice produces retinal dysplasia. Invest. Ophthalmol. Vis. Sci. 51, 1773–1782 (2010).
© 20 11 Nat ur e Amer ica, Inc. All r ights r eser ved.
Investigation Committee (HIC) (protocol number 0908005592). Institutional review board approvals for genetic and MRI studies, along with written consent from all study subjects, were obtained by the referring physicians at the participat-ing institutions. All fetal human tissues were collected under guidelines approved by the Yale HIC (protocol number 0605001466). Human fetal brains at 20 and 22 weeks of gestation were obtained from the Human Fetal Tissue Repository at the Albert Einstein College of Medicine (CCI number 1993-042).
Genome-wide genotyping. The Illumina Platform was used for genome-wide
genotyping and analysis of the samples. Human 610K Quad BeadChips were used according to the manufacturer’s protocol (Illumina).
Exome capture and sequencing. NimbleGen 2.1M human exome array
version 1.0 (Roche Nimblegen, Inc.) was used to capture the exomes of samples NG 49-1 and NG 50-1 according to the manufacturer’s protocol, with modifi-cations11,27. Sequencing of the library was performed on Genome Analyzer IIx using a single lane per subject (at a read length of 99 bp and 74 bp for NG 49-1 and NG 50-1, respectively) (Supplementary Table 2). The Illumina pipeline version 1.5 was used for image analysis and base calling.
Exome data analysis. Analysis of the sequencing data was performed
accord-ing to the previously described data analysis pipeline we have developed11,27 by mapping the reads to the human genome (NCBI36/hg18) by Maq and BWA software28,29. Coverage rates and distributions, as well as error positions and frequencies, were detected using perl scripts developed in house. Variants were called using SAMtools30 and annotated for newness as compared to the dbSNP, Personal Genome and 1000 Genomes databases, as well as additional exome sequencing experiments we have performed. New variants were further evaluated for their impact on the encoded protein, conservation across 44 vertebrate species and Caenorhabditis elegans and Drosophila melanogaster, expression patterns and potential overlap with known miRNAs.
Sanger sequencing. Coding regions and exon-intron boundaries of LAMC3
were evaluated by Sanger sequencing using standard protocols. Amplicons were cycle sequenced on ABI 9800 Fast Thermocyclers, and post cycle sequencing clean up was carried out with CleanSEQ System (Beckman Coulter Genomics). The amplicons were analyzed on 3730×L DNA Analyzer (Applied Biosystems Inc.).
Animals. All protocols performed in animal experiments were approved by
the Institutional Animal Care and Use Committee at Yale School of Medicine. Embryonic day 0.5 was determined as the midday of the day of vaginal plug discovery. For embryonic stages, pregnant females were anesthetized, pups at appropriate stages were extracted from the uterus and the brains were dissected and fixed overnight by immersion in 4% paraformaldehyde in phosphate-buffered saline. Mouse brains were then cryoprotected in 30% sucrose in 4% paraformaldehyde and sectioned in the coronal plane on a Leica sledge cryo-microtome at 40 µm (Leica Microsystems). Sections were mounted on slides and processed with in situ hybridization.
In situ hybridization. Sections were processed for non-radioactive in situ
hybridization as described previously with minor modifications31,32.
Immunofluorescence. Upon dissection, fetal human brains were immersed
whole in 4% paraformaldehyde for 36 h, cryoprotected and frozen, and cryo-sectioned at 60 µm. Standard techniques were used after primary antibodies were diluted in blocking solution containing normal donkey serum as fol-lows: rabbit anti-LAMC3 (R96, W. Brunken, SUNY Downstate), 1:5,000; goat anti-SOX2 (Santa Cruz), 1:250; mouse anti-NeuN (Millipore), 1:1,000; mouse anti-SMI-312 (Covance), 1:250; mouse anti-MAP2 (Sigma), 1:1,000; and mouse anti-SRGAP1 (Abcam), 1:250.
LAMC3 expression. The data were from a unique, high-quality microarray
dataset that measured gene expression within different brain regions through-out human life using the Affymetrix Human Exon 1.0 ST arrays15 (see URLs).
from the same cortical area and stage (Fig. 4a). The following cortical areas were sampled: orbital prefrontal cortex (OFC), dorsolateral prefrontal cortex (DFC), ventrolateral prefrontal cortex (VFC), medial prefrontal cortex (MFC), primary motor (M1) cortex (M1C), primary somatosensory (S1) cortex (S1C), posterior inferior parietal cortex (IPC), primary auditory (A1) cortex (A1C), posterior superior temporal cortex (STC), inferior temporal cortex (ITC) and primary visual (V1) cortex (V1C) (Fig. 4a).
To compare the relationship of LAMC3 expression levels and developmental trajectories, functional gene lists for dendrite development (MAP1A, MAPT and CAMK2A) (Fig. 4e) and synaptogenesis (SYP, SYPL1, SYPL2 and SYN1) (Supplementary Fig. 8) were manually curated. To summarize the principle gene expression profile of each category, principal component analysis was per-formed. The first principle component (PC1), which accounts for the majority of variability in the data, was plotted against age (to represent the developmen-tal trajectory) and LAMC3 expression level. The two independent datasets of synaptic density and the number of basal dendrites in the corresponding brain regions or areas were scaled by x−m
s , in which µ and σ are the mean and the
standard deviation of the values, respectively, corresponding to the time peri-ods for which both our gene expression and the independently generated data were available. The scaled values were plotted against logarithmic age in days, and a cubic spline curve was fitted to display the developmental trajectories. The predicted values on this curve were calculated corresponding to available time points of previously generated independent data on dendrite develop-ment16,17 and synaptogenesis18. To identify developmentally co-expressed genes, we calculated the correlation of the temporal expression pattern of all other genes to that of LAMC3. The top 50 genes were selected for functional annotation, using DAVID Bioinformatics Resources 6.7 (see URLs)33.
Primary human neuronal cell culture. All experiments were conducted in
accordance with a protocol approved by the Yale Human Investigation Committee (principal investigator, N. Šestan, Protocol# 0605001466). Ventricular zone tissue was dissected from fetal human frontoparietal neocortical wall at 19 weeks of gestation, enzymatically dissociated and cultured in serum-free media in the presence of FGF-2 (20 ng/ml) and epidermal growth factor (20 ng/ml). After 4 weeks in culture, neural progenitor cells were transfected with a con-struct that co-expresses GFP and hemagglutinin (HA)-tagged human LAMC3 (BC156274) using nucleofection (Lonza, kit VPG-1004; program A-033). One day after transfection, growth factors were withdrawn to facilitate neuronal differentiation. After 7 days in culture in the absence of growth factors, dif-ferentiated neurons were fixed and stained for GFP and HA.
MR data acquisition. MRI scanning was performed on a 3 Tesla scanner
(Magnetom Trio, Siemens AG) with a twelve-channel phase-array head coil. A high-resolution T1-weighted three-dimensional anatomical-volume scan was acquired for each participant in the same session before the functional and DTI scans. BOLD signals in the functional scans were measured with an echo-planar imaging sequence. DTI data were acquired using a single-shot spin-echo echo-planar imaging sequence with parallel imaging technique GRAPPA.
MRI structural analysis procedures. Structural analysis involved
three-dimensional reconstruction of the participants’ cortices and computing cortical thickness using the Freesurfer analysis package (see URLs). After correction, the cortical thickness was calculated at each point as the short-est distance between the white matter-gray matter boundary and the gray matter-cerebrospinal fluid boundary. Finally, the cortical thickness measure-ment results were mapped on the three-dimensional model of the cortex using a color coding scheme for visualization.
Retinotopic mapping procedures. Experimental software for the retinotopic
mapping fMRI scan was written by H.B. and K.D. in the Java programming platform (see URLs). In the scanner, the stimuli were back projected by a video projector fitted with a long throw lens onto a translucent back projection screen placed inside the scanner bore with the help of an angled first surface mirror. The functional scans were performed for retinotopic mapping follow-ing the methods developed by two previous studies34,12.
© 20 11 Nat ur e Amer ica, Inc. All r ights r eser ved.
constructed and inflated for visualization. Functional images from all scans were spatially transformed and aligned with the anatomical volume obtained in the retinotopic mapping scan individually. Boundaries between retinotopic areas were drawn manually with a standard graphics program (Inkscape) after visual inspection of the cross-correlation maps of the BOLD response and the rotating wedges and of the BOLD response and the expanding annuli12,34. The analysis of the second scan of NG 367-1 involved the same steps, except that instead of a cross-correlation analysis, we performed a general linear model analysis to identify the voxels that respond to vertical or horizontal wedges. We then visualized these voxels on the inflated cortex and used this as auxiliary information for manually drawing the boundaries between early visual areas.
DTI analysis procedures. White matter pathways were identified using the
MRI Atlas of Human White Matter35 and fiber tracking was performed in MedINRIA software package (see URLs). Fractional Anisotropy and Mean Diffusivity maps were computed in DTI studio36 in three manually defined region of interest. Initial measurements are reported, and no further statistical analysis was performed.
transform. Bioinformatics 25, 1754–1760 (2009).
29. Li, H., Ruan, J. & Durbin, R. Mapping short DNA sequencing reads and calling variants using mapping quality scores. Genome Res. 18, 1851–1858 (2008). 30. Li, H. et al. The Sequence Alignment/Map format and SAMtools. Bioinformatics 25,
2078–2079 (2009).
31. Louvi, A., Sisodia, S.S. & Grove, E.A. Presenilin 1 in migration and morphogenesis in the central nervous system. Development 131, 3093–3105 (2004). 32. Stillman, A.A. et al. Developmentally regulated and evolutionarily conserved
expression of SLITRK1 in brain circuits implicated in Tourette syndrome. J. Comp. Neurol. 513, 21–37 (2009).
33. Dennis, G. Jr. et al. DAVID: Database for Annotation, Visualization, and Integrated Discovery. Genome Biol. 4, P3 (2003).
34. Engel, S.A., Glover, G.H. & Wandell, B.A. Retinotopic organization in human visual cortex and the spatial precision of functional MRI. Cereb. Cortex 7, 181–192 (1997).
35. Song, S.K. et al. Dysmyelination revealed through MRI as increased radial (but unchanged axial) diffusion of water. Neuroimage 17, 1429–1436 (2002). 36. Jiang, H., van Zijl, P.C., Kim, J., Pearlson, G.D. & Mori, S. DtiStudio: resource
program for diffusion tensor computation and fiber bundle tracking. Comput. Methods Programs Biomed. 81, 106–116 (2006).
© 20 11 Nat ur e Amer ica, Inc. All r ights r eser ved.