DOI 10.1007/s11517-014-1232-0 ORIGINAL ARTICLE
Application of the RIMARC algorithm to a large data set
of action potentials and clinical parameters for risk prediction
of atrial fibrillation
Ursula Ravens · Deniz Katircioglu‑Öztürk · Erich Wettwer · Torsten Christ · Dobromir Dobrev · Niels Voigt · Claire Poulet · Simone Loose · Jana Simon ·
Agnes Stein · Klaus Matschke · Michael Knaut · Emre Oto · Ali Oto · H. Altay Güvenir
Received: 5 June 2014 / Accepted: 16 November 2014 / Published online: 3 December 2014 © International Federation for Medical and Biological Engineering 2014
learned by the RIMARC algorithm can be used for accurately classifying the preoperative rhythm status. APs were included from 221 SR and 158 AF patients. During a learning phase, the RIMARC algorithm established a ranking order of 62 fea-tures by predictive value for SR or AF. The model was then challenged with an additional test set of features from 28 patients in whom rhythm status was blinded. The accuracy of the risk prediction for AF by the model was very good (0.93) when all features were used. Without the seven AP features, accuracy still reached 0.71. In conclusion, we have shown that training the machine-learning algorithm RIMARC with an experimental and clinical data set allows predicting a clas-sification in a test data set with high accuracy. In a clinical setting, this approach may prove useful for finding hypothe-sis-generating associations between different parameters.
Abstract Ex vivo recorded action potentials (APs) in
human right atrial tissue from patients in sinus rhythm (SR) or atrial fibrillation (AF) display a characteristic spike-and-dome or triangular shape, respectively, but variability is huge within each rhythm group. The aim of our study was to apply the machine-learning algorithm ranking instances by maxi-mizing the area under the ROC curve (RIMARC) to a large data set of 480 APs combined with retrospectively collected general clinical parameters and to test whether the rules Ursula Ravens, Deniz Katircioglu-Öztürk, Ali Oto and H. Altay Güvenir have equally contributed.
Electronic supplementary material The online version of this article (doi:10.1007/s11517-014-1232-0) contains supplementary material, which is available to authorized users.
U. Ravens · E. Wettwer · T. Christ · D. Dobrev · N. Voigt · C. Poulet · S. Loose · J. Simon
Department of Pharmacology and Toxicology, Medical Faculty Carl Gustav Carus, TU Dresden, Dresden, Germany
U. Ravens (*)
Institut für Pharmakologie und Toxikologie, TU Dresden, Fetscherstrasse 74, 01307 Dresden, Germany
e-mail: [email protected]; [email protected] D. Katircioglu-Öztürk
Department of Medical Informatics, Informatics Institute, Middle East Technical University, Ankara, Turkey
D. Katircioglu-Öztürk · E. Oto MITS, Ankara, Turkey Present Address: T. Christ
Department of Experimental Pharmacology and Toxicology, University Medical Center Hamburg-Eppendorf, Hamburg, Germany
Present Address: D. Dobrev · N. Voigt
Institute of Pharmacology, Faculty of Medicine, University of Duisburg-Essen, Essen, Germany
Present Address: C. Poulet
Imperial College, London, UK A. Stein
Department of Anesthesiology, Heart Center Dresden, Dresden, Germany
K. Matschke · M. Knaut
Clinic for Cardiac Surgery, Heart Center Dresden, Dresden, Germany
A. Oto
Department of Cardiology, Hacettepe University Hospital, Ankara, Turkey
Keywords Atrial fibrillation · Risk prediction · RIMARC
algorithm · Human right atrial action potentials · Clinical parameters
Abbreviations
AF Atrial fibrillation
APA Action potential amplitude (mV)
APD20 Action potential duration at 20 % of repolari-zation (ms)
APD50 Action potential duration at 50 % of
repolari-zation (ms)
APD90 Action potential duration at 90 % of repolari-zation (ms)
dV/dtmax Maximum rate of depolarization (Vs−1)
MAD Maximum area under ROC curve-based
discretization
PLT20 “Plateau potential” defined as the mean poten-tial (mV) in the time window between 20 % of APD90 plus 5 ms
RIMARC Ranking instances by maximizing the area under the ROC curve
RMP Resting membrane potential (mV) ROC Receiver operating characteristics
SR Sinus rhythm
1 Introduction
During open-heart surgery, the outer rim of the right atrial appendage is removed in order to introduce the tubing for connecting the patient to the extracorporeal circulation. Most patients agree that these tissue samples are made available for basic research rather than being disposed. Therefore, right atrial tissue can be studied ex vivo for its basic electrophysiological properties.
Action potentials (APs) recorded in right atrial tissue from patients in sinus rhythm (SR) exhibit a characteristic spike-and-dome morphology that changes into a triangular form due to electrical remodeling in chronic atrial fibrillation (AF) [4, 19, 22]. Many studies have reported in silico modeling of atrial repolarization in order to understand the complex processes which underlie AF-induced changes [6, 7, 15]. Despite the clear association of AP shape with the patient’s preoperative rhythm status, the variability in individual AP morphology is large and does not always allow a clear dis-tinction between SR and AF. Besides preoperative rhythm status, other demographic and clinical factors could have an
influence on AP shape. Therefore, most published experimen-tal studies with human atrial tissue also include additional information on the patients’ age, height, body weight, con-comitant diseases, basal hemodynamic parameters, pre-surgi-cal medication, etc. (e.g., [5, 23, 24] ). However, cohort sizes are usually quite small (<50 patients) so that weak influences of accompanying clinical conditions cannot be ruled out.
In the context of our electrophysiological interest in AF pathophysiology, we have accumulated a large data pool of human right atrial action potential recordings during the past 8 years. From all patients, we have also collected clini-cal parameters from the electronic (scanned) patient files. Instead of using conventional statistics to find associations between AF and electrophysiological and clinical features, we used a machine-learning approach for risk prediction. In this context, the term “risk prediction” is used in a math-ematical sense of correct classification and is not related to the clinical prediction of risk of getting a disease based on empirically observed risk factors for that disease.
The general objective of all machine-learning approaches can be stated as non-trivial extraction of previ-ously unknown, however, hypothesis-generating premises, rules and relations from large data sets. Aligned with this particular objective, our study incorporated a machine-learning algorithm ranking instances by maximizing the area under the ROC curve (RIMARC) [10] instead of a multivariate statistical approach.
The RIMARC algorithm was applied to a large data set of ex vivo recorded human right atrial APs combined with retrospectively collected general clinical parameters. Therefore, the aim of our study was to test whether the rules learned by this algorithm could be used for an accu-rate classification of a patient’s rhythm status.
2 Methods
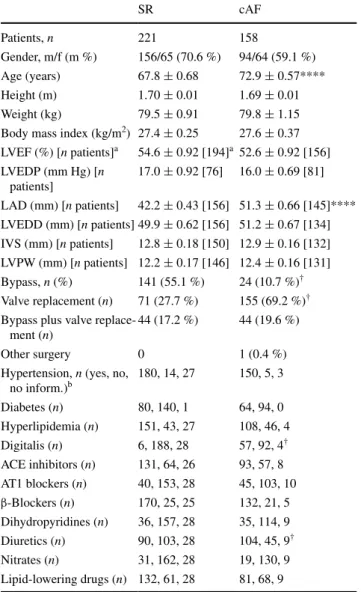
Data included in this study were collected in the period from January 2006 to February 2014. The study conforms to the Declaration of Helsinki and was approved by the eth-ics committee of Dresden University of Technology (No. EK790799). Each patient gave written informed consent. Right atrial appendages were obtained from 221 patients with SR and 158 patients with chronic AF at the time of open-heart surgery. The criteria for a patient to be considered in perma-nent AF were history of ECG-documented AF and symptoms of AF for ≥6 months. Patients with paroxysmal or intermit-tent AF were excluded. Demographic and clinical data of the patients are summarized in Table 1 and are comparable to the characteristics published previously [6, 7, 15]. The Mann– Whitney U test was applied for a complete statistical analysis of all features between the SR and AF group of patients, the results are provided in supplementary Table 1.
H. A. Güvenir
Department of Computer Engineering, Bilkent University, Ankara, Turkey
2.1 Action potential measurements
Small pieces of human right atrial appendages were trans-ported to the laboratory in a special Ca2+-free transport
solution at 20–25 °C, composition in mM: 100.0 NaCl, 10.0 KCl, 1,2 KH2PO4, 5.0 MgSO4, taurin 50 mM, MOPS 5 mM, 30 mM butanedionemonoxime (BDM), pH 7.0 (20–25 °C).
Either free-running trabeculae or trabeculae together with attached atrial wall were dissected and mounted on the bot-tom of a 5-ml organ bath perfused with 50 ml of recircu-lating, oxygenized Tyrode’s solution at a flow rate of 7 ml/ min at 36 ± 1 °C (composition in mM: 126.7 NaCl, 0.42 NaH2PO4, 22 NaHCO3, 5.4 KCl, 1.8 CaCl2, 1.5 MgCl2,
pH 7.4 when equilibrated with 5 % CO2 in O2). Prepara-tions were electrically stimulated at a single constant rate of 1 Hz with isolated square-wave stimuli of 1 ms duration, two times threshold intensity. Transmembrane potentials were recorded with glass microelectrodes filled with 2.5 M KCl. Tip resistances of the electrodes were between 20 and 80 MΩ. Both timing of the driving stimuli and preprocess-ing of the transmembrane potential responses were carried out with a computer-aided AP recording system.
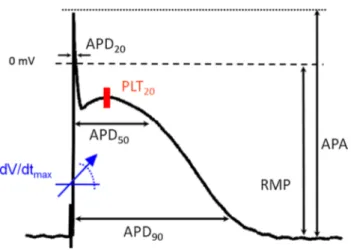
The trabeculae were used for various different experi-ments; however, each experiment was preceded by a 60-min equilibration period during which the preparations were allowed to stabilize and residual BDM was com-pletely washed out. At the end of the equilibration period, 10 consecutive APs were averaged and analysed for the following parameters (Fig. 1): resting membrane poten-tial, RMP (mV), action potential amplitude, APA (mV), action potential duration at 20, 50, and 90 % of repolariza-tion (APD20, APD50 and APD90 in ms), maximum rate of depolarization, dV/dtmax (V/s), and the “plateau potential”
(PLT20) defined as the mean absolute membrane potential (mV) in a 5-ms window starting from 20 % of APD90.
The clinical parameters chosen for our data set are demo-graphic characteristics such as age, weight, body mass index (BMI), etc., clinical conditions associated with heart disease, hemodynamic parameters, and medication. Routine methods and clinical laboratory tests were used for assessment of clini-cal parameters. For example, left atrial or left ventricular end-diastolic diameter, right ventricular systolic pressure, left ven-tricular end-diastolic pressure, left venven-tricular end-diastolic diameter, ejection fraction, cardiomyopathy, left ventricular posterior wall thickness, interventricular septum thickness, mitral or aortic valve insufficiency, aortic stenosis, and patent foramen ovale were determined with thoracal or trans-esophageal echocardiography. Right heart catheterization was required for diagnosis of pulmonary hypertension and some-times for measuring right ventricular systolic pressure. Right coronary artery stenosis and number of occluded vessels were diagnosed by coronary angiography. Chronic pulmonary obstructive disease (CPOD) was quantified with spiro-ergo-metric methods. The complete list of all electrophysiological and clinical parameters is given in Table 2.
2.2 Data set
All patients who agreed to participate in this study were anonymized, but had to be assigned a consecutive code Table 1 Patient characteristics
SR sinus rhythm, cAF chronic atrial fibrillation (≥6 months), m male, f female; LVEF left ventricular ejection fraction, LVEDP left ven-tricular end-diastolic pressure, LAD left atrial diameter, LVEDD left ventricular end-diastolic diameter, IVS interventricular septum, LVPW left ventricular posterior wall, ACE angiotensin-converting enzyme, AT1 angiotensin- type 1 receptor, β-blockers, β-adrenoceptor blockers **** P < 0.0001, AF versus SR from Student’s two-tailed, unpaired t test
† Mann–Whitney U test, null-hypothesis rejected (with significance
0.001 and confidence interval 95 %)
a Values in square brackets indicate number of patients for which
val-ues are available
b The categories “yes,” “no,” and “no information” apply to the
remaining 11 features SR cAF Patients, n 221 158 Gender, m/f (m %) 156/65 (70.6 %) 94/64 (59.1 %) Age (years) 67.8 ± 0.68 72.9 ± 0.57**** Height (m) 1.70 ± 0.01 1.69 ± 0.01 Weight (kg) 79.5 ± 0.91 79.8 ± 1.15
Body mass index (kg/m2) 27.4 ± 0.25 27.6 ± 0.37
LVEF (%) [n patients]a 54.6 ± 0.92 [194]a 52.6 ± 0.92 [156] LVEDP (mm Hg) [n patients] 17.0 ± 0.92 [76] 16.0 ± 0.69 [81] LAD (mm) [n patients] 42.2 ± 0.43 [156] 51.3 ± 0.66 [145]**** LVEDD (mm) [n patients] 49.9 ± 0.62 [156] 51.2 ± 0.67 [134] IVS (mm) [n patients] 12.8 ± 0.18 [150] 12.9 ± 0.16 [132] LVPW (mm) [n patients] 12.2 ± 0.17 [146] 12.4 ± 0.16 [131] Bypass, n (%) 141 (55.1 %) 24 (10.7 %)† Valve replacement (n) 71 (27.7 %) 155 (69.2 %)†
Bypass plus valve replace-ment (n)
44 (17.2 %) 44 (19.6 %)
Other surgery 0 1 (0.4 %)
Hypertension, n (yes, no,
no inform.)b 180, 14, 27 150, 5, 3 Diabetes (n) 80, 140, 1 64, 94, 0 Hyperlipidemia (n) 151, 43, 27 108, 46, 4 Digitalis (n) 6, 188, 28 57, 92, 4† ACE inhibitors (n) 131, 64, 26 93, 57, 8 AT1 blockers (n) 40, 153, 28 45, 103, 10 β-Blockers (n) 170, 25, 25 132, 21, 5 Dihydropyridines (n) 36, 157, 28 35, 114, 9 Diuretics (n) 90, 103, 28 104, 45, 9† Nitrates (n) 31, 162, 28 19, 130, 9 Lipid-lowering drugs (n) 132, 61, 28 81, 68, 9
number known only to the project leader. This number was used to identify the medical file for collection of available clinical parameters. Patients for whom no clinical data was available were eliminated.
The data set comprised of a total of 480 instances from 379 patients (instances): 452 instances from 351 patients were used for training the algorithm and 28 instances from 28 patients were used for testing. The latter instances were assigned to the testing group, because they were collected after an arbitrary deadline we set for the learning group. In the training data set, there were 214 AF and 238 SR instances, and in the test data set, there were 10 AF and 18 SR instances, and for some patients, action potentials were measured in more than one experiment and were therefore treated as separate instances. This is an accepted approach in machine learning.
All instances are labeled as AF (positive, “P”) or SR (negative, “N”). A total of 62 features (seven AP parame-ters and 56 clinical parameparame-ters) were used. Of the features, 24 were numerical (continuous) and 38 were categorical. In both groups, some clinical parameters were missing; the percentage of missing values was 27 % for the training and 2 % for the test data set.
2.3 Calculations 2.3.1 Training phase
As a machine-learning algorithm, RIMARC is used to distinguish the features and their particular values (or value ranges) that are indicators of AF. This algorithm has been designed to maximize the area under the ROC curve
(AUC). It learns a ranking function, which is a linear com-bination of nonlinear scoring functions and is learned for each feature. The RIMARC algorithm first discretizes each continuous feature using a maximum area under ROC curve-based discretization (MAD2C) algorithm [17]. For example, the numerical feature APD90 is converted into a
categorical feature by partitioning the range of all values, e.g., 140–467 ms, into sub-ranges, e.g., 140–192.5, 192.5– 205.5, 205.5–229.5, 229.5–243.5, 243.5–247.5 ms, and so on. Thus, each numerical feature is converted into a cate-gorical one by assigning a label to each of these sub-ranges. All values of a numerical feature, e.g., APD90, are replaced by labels corresponding to the sub-ranges in the data set. For example, an APD90 value of 234 ms will be replaced by
the label “229.5. 243.5.” It is shown that probability can be used as scoring function for achieving the maximum AUC for a single categorical feature [10]. In this context, prob-ability is the ratio of number of AF cases divided by the number of all cases in corresponding categorical value in the training data set. For example, the score associated with the label “229.5.243.5” is 0.8928 [=25/(25 + 3)], since there are 25 AF and three SR cases.
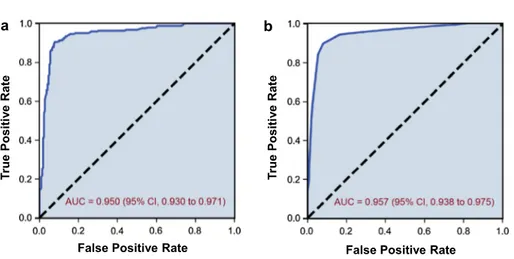
For each feature, the instances in the data set are sorted by the corresponding scoring function (probability). The ROC curve (Fig. 2) is constructed, labeling the AF patients as “P” and SR patients as “N” and calculating true positive rate (TRP) and false positive rate (FPR) of the instances within the class labels (ranges of values) obtained by the discretizing process to yield the maximum area under the curve. The data set is sorted in the order of the score assigned to the ranges of values, and TPR and FPR are calculated in a cumulative manner by working through the sorted list of instances one by one. Mathematically, TPR is the number of true positive instances divided by number of all instances marked as positive, and FPR is the number of false positive instances divided by number of all negative instances in the data set. The area under the ROC curve (AUC) is an indicator of the quality of the ranking; the higher the AUC value, the better the ranking is.
The discretization with MAD2C algorithm [23] opti-mizes the AUC. Figure 2 illustrates ROC curves for the feature APD90, as a continuous feature (Fig. 2a) and as a
discretized feature (Fig. 2b). Without any discretization, the AUC is 0.950, and after the discretization, it slightly increases to 0.957. This increment in the value of AUC is attributed to the objective function of MAD2C algorithm that aims to yield the maximum AUC by discretizing the continuous range of a feature into optimal discrete ranges.
The AUC value can be used to compute the predictive weight of a feature to classify a patient as AF or SR. The RIMARC algorithm computes the weight of a feature f as wf = 2(AUC(f) − 0.5), where AUC(f) is the AUC obtained for the feature f. If the AUC is equal to 1, classification is Fig. 1 Action potential from a patient in sinus rhythm to illustrate
analysis of action potential parameters. APA action potential ampli-tude (mV); RMP resting potential (mV), APD20, APD50, and APD90, action potential duration at 20, 50, and 90 % of repolarization (in ms), dV/dtmax, maximum rate of depolarization (Vs−1), and the “pla-teau potential” defined as the mean absolute membrane potential (mV) in the time window between 20 % of APD90 plus 5 ms (PLT20)
Table 2 List of features ordered according to predictive weight
Feature name Predictive weight Feature name Predictive weight
APD90 (ms) 0.9135 dV/dtmax (V/s) 0.1976
APD20 (ms) 0.8622 Aortic valve insufficiency 0.1936
Left atrial end-diastolic diameter (mm) 0.7513 Body mass index 0.1783
APD50 (ms) 0.7475 Patent foramen ovale 0.1691
PLT20 (mV) 0.6157 Left ventricular ejection fraction (%) 0.1616
APA (mV) 0.5451 Aortic valve insufficiency Grade I-II 0.1545
Pulmonary hypertension 0.5309 Left ventricle end-diastolic diameter (mm) 0.1513
Surgical procedure 0.4943 Intraventricular septum thickness at diastole (mm) 0.1338
QT-time (ms) 0.4515 Aortic Stenosis 0.1244
RMP (mV) 0.4272 Left ventricular wall thickness at diastole (mm) 0.1205
Number of occluded vessels 0.4181 Weight (kg) 0.1163
Creatinine 0.4106 Lipid-lowering drugs 0.1100
Glomerular filtration rate (GFR) 0.4104 Sex 0.1082
Right ventricular systolic pressure 35–54 mmHg 0.4061 Nicotine 0.1035
Mitral valve insufficiency Grade III 0.4031 AT1 blocker 0.0889
Mitral valve insufficiency 0.3693 Left ventricular hypertrophy 0.0824
QTc-time (ms) 0.3585 Hyperlipidemia 0.0639
Diuretic 0.3459 Hypertension 0.0625
Digitalis 0.3458 Mitral stenosis Grade II–III 0.0598
Age (years) 0.3411 Aortic valve insufficiency Grade III 0.0566
Right coronary artery stenosis >70 % 0.3395 Calcium channel blocker 0.0563
Potassium, serum (mmol/l) 0.3337 Nitrate 0.0494
Anamnestic or actual decompensation 0.3245 Mitral valve insufficiency Grade II 0.0386
Mitral valve insufficiency Grade I 0.3228 Aortic stenosis Grade I–II 0.0354
Tricuspid valve insufficiency Grade II–III 0.3072 Inflammatory process 0.0243
Aortic stenosis Grade III 0.2222 Chronic obstructive pulmonary disease 0.0213
Left ventricular end-diastolic pressure (mmHg) 0.2140 Obstructive sleep apnea syndrome 0.0203
Heart failure NYHA III 0.2125 ACE Inhibitor 0.0193
Height (m) 0.2038 Betablocker 0.0122
Myocardial infarction 0.1984 Diabetes 0.0059
Right ventricular systolic pressure >55 mmHg 0.1976 Cardiomyopathy 0.0047
Fig. 2 ROC curves for the feature APD90, as a continuous
feature (a) and as a discre-tized feature (b). Without any discretization, the area under the ROC curve (AUC) is 0.950 (95 % CI, 0.930–0.971) with the standard error of 0.011 under the nonparametric assumption. However, after the discretization with MAD2C algorithm [23], AUC for APD90 (b) increases
slightly and becomes 0.957 (95 % CI, 0.938–0.975) with the standard error of 0.009 under the nonparametric assumption
ROC Curve of APD90
False Positive Rate False Positive Rate
Tr ue Positi ve Rate Tr ue Positi ve Rate a b
perfect, whereas a value of 0.5 indicates that random guess-ing has occurred [17].
The training phase is completed by forming one rule for each feature. A rule for a feature contains a score cor-responding to each possible value of that feature and the predictive weight for that feature.
2.3.2 Classification phase
The rule model learned by the RIMARC algorithm can be used for predicting whether a patient belongs to the AF class (risk score). The risk score of AF for a given query patient q is given by the following formula:
Here, wf represents the weight of the feature f, qf is its value, and sf(q) is the score associated with the value of feature f for the query patient q. For coping with missing values when computing the risk score, the RIMARC algo-rithm ignores a feature if the query patient has no value for that feature. As shown in the formula above, wfq is zero, if the value of feature f is missing in patient q; otherwise, it is the weight of feature f.
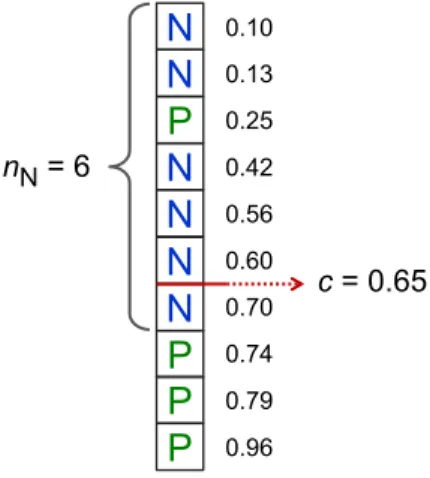
All training instances are sorted by the risk score func-tion given above (1). Let nN be the number of negative (SR) patients in the training data set, and let us define a cutoff score as
Here, score(tnN) represents the score of the nNth training
instance. If the risk score function is perfect, all first nN training instances will be negative instances. Vice versa, all instances whose risk score value is greater than c must be positive instances (see Fig. 3). Thus, we predict the class of a query patient as P if its risk score is greater than c; nega-tive otherwise.
3 Results
3.1 Electrophysiological recordings
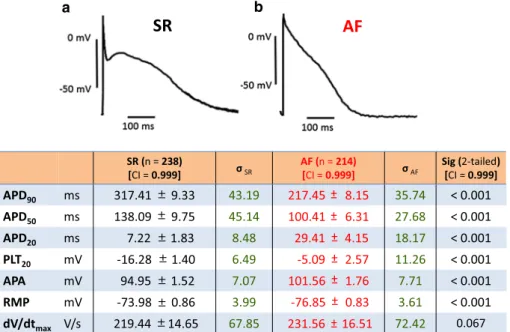
In our large cohort of human right atrial APs, we confirm the characteristic spike-and-dome (SR) and a more trian-gular conformation (AF) (Fig. 4). With the exception of maximum upstroke velocity dV/dtmax, mean values of all (1) score(q) = fw q f ·sf(q) fw q f wqf = wf qf is known 0 qf is missing (2) prediction(q) = P if score(q) > c N otherwise
where c =scors(tnN) +scors(tnN+1) 2
commonly analysed AP parameters (i.e., APD90, APD50,
APD20, PLT20, APA, RMP) were highly significantly dif-ferent among SR and AF groups. The histograms in Fig. 5 show substantial overlap of value distribution.
3.2 Rules generated by the RIMARC algorithm
All electrophysiological and clinical features according to their predictive weights calculated by the RIMARC algo-rithm are listed in decreasing order of predictive power in Table 2. The rules for all features are given in Supplemen-tary Table 2. Using the MAD2C algorithm, RIMARC auto-matically divided the total range of the feature APD90 into
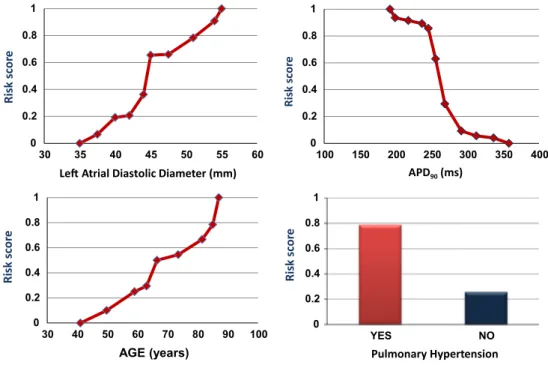
11 sub-ranges. For the rule about the feature APD90, our training data set contained 71 instances of APD90 values in the range of 205.5 and 229.5 ms, and 91.5 % were from patients with AF. The risk plot depicted in Fig. 6 demon-strates the nonlinear increase in risk with decreasing values of APD90. Further, the predictive weight of APD90 is 0.9135 which is the highest among all the features.
Left atrial diastolic diameter was divided into 10 sub-ranges. According to this particular rule learned from the training data, all 44 cases, i.e., 100 %, with left atrial diam-eter larger than 55.5 mm, and 90.9 % of the cases with left atrial diameters in the range of 52.5–55.5 mm had AF. The predictive weight of this feature was 0.7513.
All patients required cardiac surgery, including valve replacement only, valve replacement plus closure of atrial septal defect (ASD), valve replacement plus coronary artery bypass, and coronary artery bypass only. According to the rule about surgical procedure, there were 215 cases with valve replacement, and 68.4 % had AF. The predictive
N
N
P
N
N
N
N
P
P
P
0.10 0.13 0.25 0.42 0.56 0.60 0.70 0.74 0.79 0.96 c = 0.65 nN= 6Fig. 3 Illustration to calculate the cutoff score c in a toy data set. All instances are sorted by their individual risk score given by Eq. (1). N (negative instances) represent SR patients; P (positive instances) rep-resent AF patients, nN is the total number of negative instances, e.g., nN = 6 in this data set; cutoff score c is calculated by Eq. (2), i.e.,
average between risk score of instances six and seven from the top. See text for further details
weight is 0.4943 making it the eighth most effective feature for AF classification.
According to the rule about diabetes, 47 % of the 170 cases with diabetes in the training data set had AF. On the other hand, the same percentage of 281 cases without
diabetes had AF, as well. The predictive weight of diabetes is 0.0059, which is second to the least predictive feature.
The rule learned for age discretizes the total age range into nine sub-ranges. For the sub-range 65.5–67.5 years, 50 % of the 40 cases in the training data set had AF. The Fig. 4 a Characteristic traces
of two human right atrial action potentials representative for tissue from a sinus rhythm (SR) and an atrial fibrilla-tion (AF) patient. b Mean values ± standard error of the mean, n number of patients; σSR and σAF, standard deviation for SR and AF, respectively. See legend of Fig. 1 for explanation
of abbreviations SR (n = 238) [CI = 0.999] σSR AF (n = 214)[CI = 0.999] σAF Sig (2-tailed) [CI = 0.999]
APD90 ms 317.41 9.33 43.19 217.45 8.15 35.74 < 0.001 APD50 ms 138.09 9.75 45.14 100.41 6.31 27.68 < 0.001 APD20 ms 7.22 1.83 8.48 29.41 4.15 18.17 < 0.001 PLT20 mV -16.28 1.40 6.49 -5.09 2.57 11.26 < 0.001 APA mV 94.95 1.52 7.07 101.56 1.76 7.71 < 0.001 RMP mV -73.98 0.86 3.99 -76.85 0.83 3.61 < 0.001 dV/dtmax V/s 219.44 14.65 67.85 231.56 16.51 72.42 0.067
AF
SR
a b APD90(ms) 50 40 30 20 10 0 60 Time, ms APD20(ms) 120 80 40 20 0 60 100 Time, ms PLT20(mV) 70 50 40 30 20 10 0 60 SRAF Potential, mV APA (mV) 70 50 40 30 20 10 0 60 Potential, mV RMP (mV) 50 40 30 20 10 0 60 Potential, mV dV/dtmax(V/s) 40 20 10 0 30 Depolarization rate, V/s Fig. 5 Histograms of selected action potential parameters from SR(black columns) and AF trabeculae (red columns): APD20, APD90,
PLT20, APA, RMP, dV/dtmax. Ordinate: number of preparations with
the ranges indicated by the bins (abscissa). Please note the huge vari-ability within the SR and AF groups
predictive weight of age is computed to be 0.3411. The rule demonstrates that the probability of AF increases monoton-ically as the age increases (see also risk plot in Fig. 6). 3.3 Testing phase
In order to validate the rules learned by the RIMARC algorithm, we reserved data from a separate group of 28 patients. The risk scores for these patients are computed according to Eq. 1 which is based on the rules learned in the training phase. The rhythm values for 28 test instances are predicted by Eq. 2. At the end of the train-ing phase, the cutoff score was found to be 0.548. Those instances with risk score greater than 0.548 are predicted to be AF.
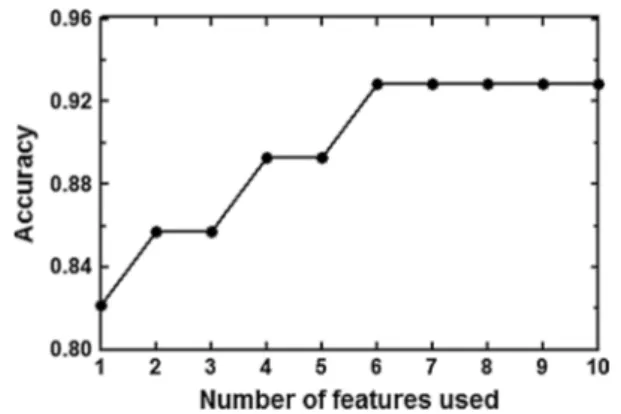
Two out of 28 test instances were misclassified, i.e., one SR patient was predicted to belong to the AF group, and one AF patient was predicted to belong to the SR group. In fact, the shapes of the APs recorded in these two mis-classified patients (see Fig. 7) were not typical for their respective rhythm group. The classification accuracy was 0.93 (26/28) when all features were used. The increase in accuracy with increasing numbers of features in the order of their predictive weight (predictive weight or “risk value” in Table 2) is illustrated in Fig. 8. In fact, the six features with the highest weight, i.e., APD90, APD20, Left atrial
diastolic diameter, APD50, PLT20, and APA, were enough to obtain 0.93 classification accuracy. Excluding all seven AP features from the training data set, classification accuracy was still 0.71 (20/28). 0 0.2 0.4 0.6 0.8 1 YES NO Risk scor e Pulmonary Hypertension 0 0.2 0.4 0.6 0.8 1 30 40 50 60 70 80 90 100 Risk scor e AGE (years) 0 0.2 0.4 0.6 0.8 1 30 35 40 45 50 55 60 Risk scor e
Le Atrial Diastolic Diameter (mm)
0 0.2 0.4 0.6 0.8 1 100 150 200 250 300 350 400 Risk scor e APD90(ms)
Fig. 6 Plots of risk scores generated from the rules learned by RIMARC for APD90, left atrial diameter, age, and pulmonary hypertension. The
risk score is the probability of a patient within the discretized sub-ranges to belong to the AF group
100 ms -50 mV 0 mV 30.07.2013 100 ms -50 mV 0 mV 21.08.2013 Pat. 3850 (SR) Pat. 3832 (AF)
Fig. 7 Action potentials from the two patients (3,832, 3,850) misclassified in the test data set. According to the clinical records, patient 3,832 had been in AF but was classified as SR, and patient 3,850 had been in SR but was classified as AF
4 Discussion
In the present study, we have used a large ex vivo electro-physiological data set from human atrial biopsies as well as clinical information for training a machine-learning algorithm to establish a ranking order of features by pre-dictive value for preoperative AF. The major findings were (i) APD90, APD20, and left atrial diastolic diameter had the highest predictive values; (ii) pulmonary hypertension ranked on place seven for predictive weight, (iii) the clini-cal features “diabetes” and “treatment with β-blockers” had lowest predictive values, and (iv) challenging the model with a test data set yielded high accuracy in risk prediction. 4.1 Action potentials
In chronic AF, the APD is significantly shorter than in SR due to electrical remodeling [4, 25], although there is a substantial overlap in value distributions between the two groups (see Fig. 5). The variability in AP morphology, regardless of rhythm status, confirms reports in the litera-ture [1–3, 9, 13, 19, 21, 24]. Despite this variability, APD90 and APD20 have the highest predictive values in our model.
Based on our results, the plateau potential PLT20 has more negative values in SR than in AF; its predictive weight is 0.6157 for a patient to be in AF.
4.2 Clinical features
Atrial fibrillation is characterized by highly irregular excit-atory activity that can be triggered by ectopic pacemakers often located in the left atrium and the pulmonary veins [11]. Dilation of the left atrium enhances the likelihood of ectopic activity and stability of re-entrant circuits, and
hence susceptibility to AF [8, 16], providing a pathophysi-ological link between mitral valve stenosis or congestive heart failure and increased risk of AF. Thus, the high pre-dictive weight of the feature left atrial diameter in our data set was not surprising. Pulmonary hypertension, however, is not among the well-established risk factors for AF [20], yet its predictive weight (0.5309) ranked on position seven among the 62 predictive features in our data set. In the gen-eral population, old age is associated with an increase in pulmonary artery pressure [18], and an expert panel on pul-monary hypertension has recently suggested to introduce a new clinical entity of “pulmonary hypertension of old age” (Ali Oto, personal communication). Age is also a known risk factor for AF (for review see [14] ). In our data set, the rule for age provided by the RIMARC algorithm dem-onstrates continuously increasing risk score for AF with increasing age, suggesting that there might be an associa-tion between pulmonary hypertension and AF, illustrating the hypothesis-generating aspect of our approach.
On the other hand, age had a rather low predictive weight for AF in our data set, despite the fact that old age is an accepted risk factor for AF [14]. This seeming discrep-ancy is possibly due to the particular set of patients stud-ied, because patients were not primarily selected for heart rhythm, but, for obvious reasons, only patients requiring open-heart surgery could be included. Similarly, patient selection may also explain the low predictive weight of diabetes and drug treatment, because these two features are similar in all severely ill cardiac patients.
4.3 Machine-learning algorithm
The RIMARC algorithm is chosen to be applied in our study due to its several prominent characteristics. First of all, RIMARC achieves comparably high AUC (Area Under the ROC Curve) values, which is the ultimate measure of the precision of a classifier. There are benefits to using such a measure, since AUC has important characteristics, such as insensitivity to class distribution and cost distributions. Another benefit of the AUC is that it has an intuitive prob-ability interpretation: The AUC represents the probabil-ity that a randomly chosen positive instance is correctly assigned a higher rank value than a randomly selected negative instance. Therefore, the weights of the features are proportional to their ability to independently classify the instances. Since the RIMARC algorithm uses all available feature values and ignores the missing ones, it is robust to missing feature values. For this reason, it is ideally situated as a valid machine-learning method with experimental and clinical data sets comprising substantial amount of missing values due to the difficulties in data collection and consoli-dation. In addition to this, being a nonparametric method, RIMARC does not require tuning of any parameters to Fig. 8 Accuracy of rhythm classification in the test data set with
increasing numbers of features used for the training phase (top 10 features of Table 1, i.e., APD90, APD20, Left atrial diastolic diameter, APD50, PLT20, APA, pulmonary hypertension, surgical procedure, QT-time, and RMP. Please note that the top six features with the highest predictive weight provided total accuracy
achieve the best performance. Nonparametric methods are preferable when parametric or distributional assumptions about the underlying populations of the data sets are argu-able [12].
Most importantly, the RIMARC algorithm learns even nonlinear risk score functions of the values of a given feature. The ranking score functions are in a human read-able form that can be easily interpreted by domain experts. The feature weights learned help the experts to determine how they affect the ranking. In this sense, the output of RIMARC is inherently a Decision Support System, which can be used to estimate the risk of a new instance given the model learned from the data set.
4.4 Study limitations
There are several limitations of our study, including selec-tion of patients and retrospective collecselec-tion of clinical data. Criteria for selection of clinical features for this study were chosen not systematically, but on the basis of availability and anticipated relationship in some direct or indirect way to the pathophysiology of AF. They included plain physical parameters, often diagnosed comorbidities in patients with cardiovascular disease, routinely measured hemodynamic parameters, and baseline drug treatment. We could not pro-vide an independent quality control of data, relying solely on the information provided by the patient files. Patients were considered to be in chronic AF when they had symp-toms for at least 6 months and ECG documentation of AF on two occasions during this period. Patients with intermit-tent AF or patients without any symptoms may have been misclassified if they were in SR at the time of surgery. Since all patients were surgical candidates, some clinical features such as diabetes or treatment with β-blockers had low predictive values because they occur with similar fre-quency in severely ill cardiac patients.
5 Conclusion
The machine-learning algorithm RIMARC provides a very useful tool for classifying patients according to their pre-operative rhythm status (“predicting” rhythm status) with high accuracy from an experimental and clinical set of data. In a clinical setting, this approach may prove useful for finding hypothesis-generating associations between differ-ent parameters.
Acknowledgments The authors thank all patients who took part in this study. We gratefully acknowledge the excellent technical assis-tance of Konstanze Fischer, and the help of Dr. Katrin Ploetze with the logistics of handling patient’s files. The authors are grateful for the generous financial support by the European Union (FP7-Health T2-2010-261057 “EUTRAF”).
References
1. Britton OJ, Bueno-Orovio A, Van AK, Lu HR, Towart R, Gal-lacher DJ et al (2013) Experimentally calibrated population of models predicts and explains intersubject variability in cardiac cellular electrophysiology. Proc Natl Acad Sci USA 110(23):E2098–E2105
2. Bustamante JO, Watanabe T, Murphy DA, McDonald TF (1982) Isolation of single atrial and ventricular cells from the human heart. Can Med Assoc J 126(7):791–793
3. Dawodu AA, Monti F, Iwashiro K, Schiariti M, Chiavarelli R, Puddu PE (1996) The shape of human atrial action potential accounts for different frequency-related changes in vitro. Int J Cardiol 54(3):237–249
4. Dobrev D, Ravens U (2003) Remodeling of cardiomyocyte ion channels in human atrial fibrillation. Basic Res Cardiol 98(3):137–148
5. Dobrev D, Wettwer E, Himmel HM, Kortner A, Kuhlisch E, Schuler S et al (2000) G-Protein beta(3)-subunit 825T allele is associated with enhanced human atrial inward rectifier potassium currents. Circulation 102(6):692–697
6. Dorn A, Krueger MW, Seemann G, Doessel O (2012) Modelling of heterogeneous human atrial electrophysiology. Biomed Tech (Berl) 57(Suppl):1
7. Dossel O, Krueger MW, Weber FM, Wilhelms M, Seemann G (2012) Computational modeling of the human atrial anatomy and electrophysiology. Med Biol Eng Comput 50(8):773–799 8. Eckstein J, Verheule S, de Groot N, Allessie M, Schotten U
(2008) Mechanisms of perpetuation of atrial fibrillation in chroni-cally dilated atria. Prog Biophys Mol Biol 97(2–3):435–451 9. Gelband H, Bush HL, Rosen MR, Myerburg RJ, Hoffman BF
(1972) Electrophysiologic properties of isolated preparations of human atrial myocardium. Circ Res 30(3):293–300
10. Güvenir HA, Kurtcephe M (2013) Ranking instances by maxi-mizing the area under ROC curve. IEEE Trans Knowl Data Eng 25(10):2356–2366
11. Haissaguerre M, Jais P, Shah DC, Takahashi A, Hocini M, Quin-iou G et al (1998) Spontaneous initiation of atrial fibrillation by ectopic beats originating in the pulmonary veins. N Engl J Med 339(10):659–666
12. Hill T, Lewicki P (2005) Statistics: methods and applications. A Comprehensive refeence for science, industry and data mining, 1st. 2005. StatSoft Inc., Tulsa, OK
13. Jakob H, Oelert H, Rupp J, Nawrath H (1989) Functional role of cholinoceptors and purinoceptors in human isolated atrial and ventricular heart muscle. Br J Pharmacol 97(4):1199–1208 14. Kirchhof P, Lip GY, Van Gelder IC, Bax J, Hylek E, Kaab S et al
(2012) Comprehensive risk reduction in patients with atrial fibril-lation: emerging diagnostic and therapeutic options–a report from the 3rd Atrial Fibrillation Competence NETwork/European Heart Rhythm Association consensus conference. Europace 14(1):8–27 15. Krueger MW, Dorn A, Keller DU, Holmqvist F, Carlson J, Pla-tonov PG et al (2013) In-silico modeling of atrial repolarization in normal and atrial fibrillation remodeled state. Med Biol Eng Comput 51(10):1105–1119
16. Kuijpers NH, Potse M, van Dam PM, ten Eikelder HM, Verheule S, Prinzen FW et al (2011) Mechanoelectrical coupling enhances initiation and affects perpetuation of atrial fibrillation during acute atrial dilation. Heart Rhythm 8(3):429–436
17. Kurtcephe M, Güvenir HA (2013) A discretization method based on maximizing the area under receiver operating char-acteristic curve. Int J Pattern Recogn Artific Intel 27(Art. No. 1350002):1–26
18. Lam CS, Borlaug BA, Kane GC, Enders FT, Rodeheffer RJ, Redfield MM (2009) Age-associated increases in pulmonary
artery systolic pressure in the general population. Circulation 119(20):2663–2670
19. Li GR, Nattel S (1997) Properties of human atrial ICa at physi-ological temperatures and relevance to action potential. Am J Physiol 272(1 Pt 2):H227–H235
20. Rottlaender D, Motloch LJ, Schmidt D, Reda S, Larbig R, Wolny M et al (2012) Clinical impact of atrial fibrillation in patients with pulmonary hypertension. PLoS ONE 7(3):e33902
21. Sanchez C, Bueno-Orovio A, Wettwer E, Loose S, Simon J, Ravens U et al (2014) Inter-subject variability in human atrial action potential in sinus rhythm versus chronic atrial fibrillation. PLoS ONE 9(8):e105897
22. Van Wagoner DR, Nerbonne JM (2000) Molecular basis of electrical remodeling in atrial fibrillation. J Mol Cell Cardiol 32(6):1101–1117
23. Van Wagoner DR, Pond AL, Lamorgese M, Rossie SS, McCarthy PM, Nerbonne JM (1999) Atrial L-type Ca2+ currents and human
atrial fibrillation. Circ Res 85(5):428–436
24. Wettwer E, Hala O, Christ T, Heubach JF, Dobrev D, Knaut M et al (2004) Role of IKur in controlling action potential shape and contractility in the human atrium: influence of chronic atrial fibrillation. Circulation 110(16):2299–2306
25. Workman AJ, Kane KA, Rankin AC (2008) Cellular bases for human atrial fibrillation. Heart Rhythm 5(6 Suppl):S1–S6