53 THE IMPACT OF THE OIL PRICES ON PUBLIC AND PRIVATE HEALTH EXPENDITURES:
EMPIRICAL ANALYSIS ON MENA COUNTRIES Fadime İrem DOĞAN1*
Abstract
This paper aims to investigate the impact of the oil prices on health expenditures, while distinguishing public from private healthcare services. To analyze the impact of oil prices, dynamic panel data analysis and Granger causality tests in time and frequency domain analysis are carried out respectively for selected ten countries in the Middle East and North Africa (MENA) for the period of 1995 – 2014. The main findings that modeled with log difference of the used variables are as follows: oil prices have no impact on the public and private health expenditures in the dynamic models. The exchange rate has positive impact on public health expen-ditures, while the inflation rate has negative and the GDP has positive impact on private health expenditures.
Keywords: Health expenditures, Oil prices, MENA Countries JEL Codes: I10, N15, Q40
Petrol Fiyatlarının Kamu ve Özel Sağlık Harcamalarına Etkisi: Orta Doğu ve Kuzey Afrika Ülkeleri Üzerine Ampirik Bir Çalışma
Kısa Özet
Bu çalışma kamu ve özel sağlık harcamaları ayrımı ile petrol fiyatlarının sağlık harcamaları üzerindeki etkisini araştırmayı amaçlamaktadır. Dinamik panel veri analizleri ve Granger nedensellik ve frekans-alanı nedensel-lik testleri 1995-2014 yılları arasında seçilmiş on Orta Doğu ve Kuzey Afrika ülkesi için yapılmıştır. Kullanılan değişkenlerin logaritmik birinci farklarıyla kurulan modeller ile elde edilen temel bulgular şunlardır: petrol fi-yatları kamu ve özel sağlık harcamalarında bir etkide bulunmazken; döviz kuru oranı kamu sağlık harcama-ları üzerinde pozitif, GSYH ve enflasyon oranı da özel sağlık harcamaharcama-ları üzerinde pozitif ve negatif etki gös-termektedir.
Anahtar Kelimeler: Sağlık harcamaları, petrol fiyatları, Orta Doğu ve Kuzey Afrika ülkeleri
1- Introduction
After the major oil price shocks in the 1970s, there have been numerous analysis directed at investigat-ing the impact of oil price shocks on several economic variables, together with the close relationship between oil prices and real-world activities. One of the most relevant economically fundamental is the fiscal side of the economy. Numerous studies examined the impact of oil prices (with negative and pos-itive distinction) on government expenditures, as this is one of the characteristic features of oil export-ing economies (see Darby (1982); Hamilton (1983); El-Anashasy et al. (2006); Hall and Jones (2007); Jaba et al. (2014)). Studies generally underline the positive impact of oil prices on government expenditures. * Ph.D. candidate at Marmara University, European Union Institute, Department of EU Economics, Research Assistant at Altınbaş University,
54
However, the literature on the correlation between health expenditures is unsatisfactory. It is observed that fiscal constraints hamper public expenditures especially in non-institutionalized countries. At that point, oil revenues create a significant dependency for oil-exporting countries, which have a further im-pact on government spending on health services.
This paper is motivated by the following voids in the literature: First, many studies investigate the rela-tionship between oil price shocks and other variables, however there is no empirical study that scruti-nizes the impact of oil prices on public and private health expenditures. Second, the paper investigates the short-term impacts of oil prices by using dynamic panel models and causality tests in time and fre-quency domain analyses. The paper is organized as follows. In section 2 there is a literature review, sec-tion 3 describes the data and methodology, secsec-tion 4 presents empirical results, and finally secsec-tion 5 is the conclusion.
2- Literature Review
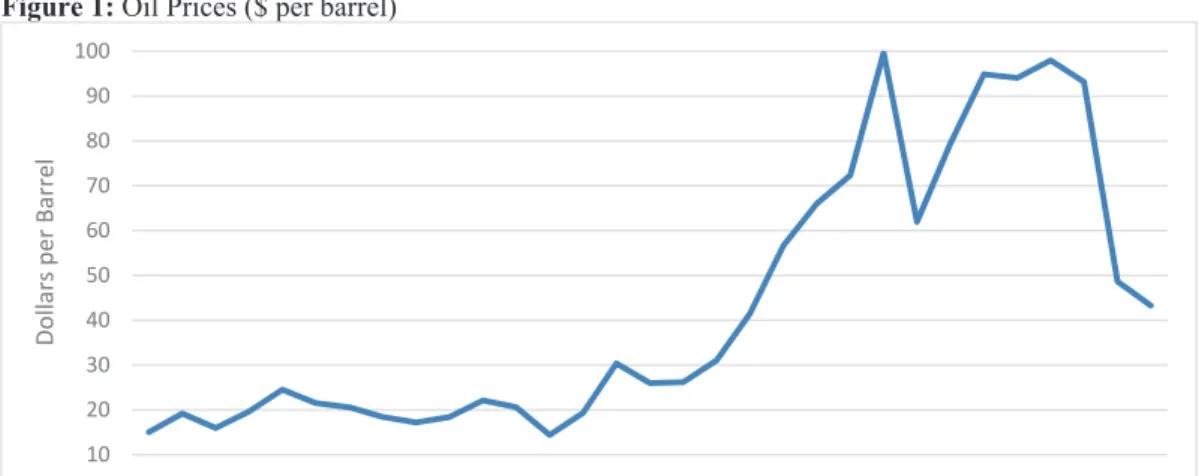
Public health services are common in oil-exporting countries. Countries like Saudi Arabia, the United Arab Emirates (UAE), and Kuwait experienced rapid development in health care, while in countries like Iran and Iraq, public health care services have been impeded by the civil war. On the other hand, econ-omies like Egypt, Israel, and Lebanon have more qualified labor for health care. The need for qualified personnel, medical treatment, and improved technology create difficulties regarding the financing for health care services. Together with fiscal constraints when prioritizing public expenditures, some gov-ernments choose to transform the health care system into a private one under the argument that pri-vatized health care systems increase the service quality with better resources and reduce the costs. With constant fluctuations in oil prices, oil-exporting countries may move towards a private health care sys-tem (or a mixed syssys-tem of private and public) in order to obtain greater efficiency in terms of reducing the costs. Moreover, it is important to note that these oil-exporting countries also promote the develop-ment of healthcare tourism. Dubai Healthcare City (DHCC) and the International Medical Centre (IMC) in Jeddah are some examples.
1
Figure 1: Oil Prices ($ per barrel)
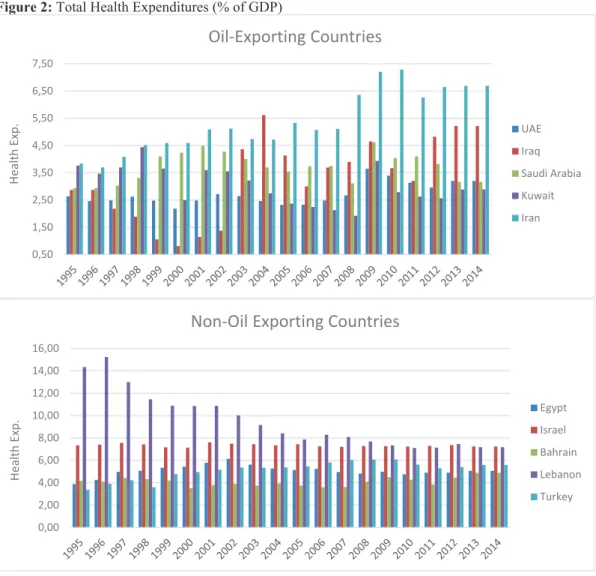
Figure 2: Total Health Expenditures (% of GDP)
10 20 30 40 50 60 70 80 90 100 1986 1988 1990 1992 1994 1996 1998 2000 2002 2004 2006 2008 2010 2012 2014 2016 Dollars per Barrel 0,50 1,50 2,50 3,50 4,50 5,50 6,50 7,50 Health Exp.
Oil‐Exporting Countries
UAE Iraq Saudi Arabia Kuwait Iran 0,00 2,00 4,00 6,00 8,00 10,00 12,00 14,00 16,00 Health Exp.Non‐Oil Exporting Countries
Egypt Israel Bahrain Lebanon Turkey55 SOSYAL BİLİMLER DERGİSİ
JOURNAL OF SOCIAL SCIENCES
1
Figure 2: Total Health Expenditures (% of GDP)
10 20 30 40 50 60 70 1986 1988 1990 1992 1994 1996 1998 2000 2002 2004 2006 2008 2010 2012 2014 2016 Dollars per Barrel 0,50 1,50 2,50 3,50 4,50 5,50 6,50 7,50 Health Exp.
Oil‐Exporting Countries
UAE Iraq Saudi Arabia Kuwait Iran 0,00 2,00 4,00 6,00 8,00 10,00 12,00 14,00 16,00 Health Exp.Non‐Oil Exporting Countries
Egypt Israel Bahrain Lebanon TurkeyThere is a remarkable amount of research on oil prices. Seminal works of Darby (1982) and Hamilton (1983) investigate the relationship between oil prices and macroeconomic variables. According to Darby (1982), the relationship is not significant, while Hamilton argues for the exact opposite in almost all reces-sion periods in the United States (the US) from 1949 to 1973. Dizaji (2014) examine the dynamic relation-ship between government revenues and expenditures in Iran as a developing oil-export based economy. According to El-Anashasy et al. (2006), oil price shocks affect the determinants of the GDP of Venezuela from 1950 to 2001. Farzanegan and Markwardt (2009) examine the possible effect of oil price shocks on macroeconomic variables in Iran by using VAR approach. They state that there is a positive relationship on the supply side of Iranian economy.
56
When it comes to health expenditures, a very important study is carried out by Acemoglu et al. (2013). They investigate the relationship between income and health expenditures including oil price shocks in the US. They assume that both income and health expenditures are increasing over time. By including oil prices on a particular local area to see the impact of income on health expen-ditures, they conclude that increasing income does not increase health expenditures. Govindaraj et al. (1997) study health expenditures in Latin America and the Caribbean. They underline that im-provements in economic variables lead to increase in health expenditures over the years. Accord-ing to the 1995 World Bank report, the countries that have established public health care systems have more public health expenditures than others. Hall and Jones (2007) also examined the rela-tionship between income and health expenditures and found a positive relarela-tionship. Ssozi and Am-lani (2015) investigate the efficiency of health expenditures in 43 countries in Sub-Saharan Africa by utilizing the generalized method of moments (GMM) approach from 1995 to 2011. They con-clude that improvements in public services increase public health expenditures. Filmer and Pritch-ett (1999) examine the impact of public health spending on mortality rates. In an analysis covering 45 countries, they did not find any correlation between health spending and mortality. However, in-come, economic inequality, education, and religion have positive effects on mortality rates. On the other hand, Rajkumar and Swaroop (2008) investigated the results of the decrease in public health spending on child mortality in 91 countries in 1990, 1997, and 2003. The results indicate that public health spending does not have an impact on child mortality. They argue that this may be the result of other factors, such as corruption. Narayan (2006) examined the health expenditures in G3 coun-tries’ (Colombia, Venezuela, and Mexico), the United Kingdom (the UK), Switzerland, and Spain by focusing on the structural breaks from 1960 to 2000. He finds that structural breaks have an impact on health expenditures negatively, except for the UK. Jaba et al. (2014) analyzed the relationship be-tween the dynamics of the inputs and the outputs of health care systems for 175 countries for the period of 1995-2010 by applying panel data analysis. They concluded that life expectancy and state health expenditures are statistically significant and positive. Mou (2013) analyzes the impact of the factors on health expenditures of 13 OECD countries for the period 1981 – 2007. He finds that in-come inequality and an aging population are less correlated to public health expenditures, when total health expenditures are considered. Brown et al. (2014) examine which factors are associated with the out-of-pocket health expenditures in Turkey by using Turkish Household Budget Surveys from 2003 to 2008. They conclude that poverty is negatively associated with household’s out-of-pocket health expenditures. Parker and Wonk (1998) analyze the Mexican National Survey of Income and Expenditures of 1989 in order to find the determinants of health expenditures in Mexico by fo-cusing on the impact of household income on health expenditures. They come to the conclusion that changes in income effect household’s health expenditures. Granados and Rodriguez (2015) ex-amine the evolution of population health and health services in Greece, Finland, and Iceland for the period from 1990 to 2011. They find that population health in Greece is as good as Finland and Ice-land and as contrary to the claims. Their findings underline that there is not a health crisis in Greece.
57 3- Data & Methodology
Data
The sample is composed of 10 countries from the Middle East and North Africa (Egypt, Iran, Iran, Saudi
Arabia, United Arab Emirates, Israel, Bahrain, Lebanon, Kuwait, and Turkey)1. Annual data is used from
1995 to 2014. Databases utilized for all dependent, independent, and control variables are World Devel-opment Indicators (WDI), Global Economic Monitor (GEM) Commodities of World Bank Database, World Economic Outlook, October 2017 of IMF, and U.S. Energy Information Administration. Health expendi-tures data is two-fold: public health expendiexpendi-tures and private health expendiexpendi-tures. Health expenditure is the dependent variable in the equations, whereas, oil prices is the independent variable. The GDP, in-flation, and the exchange rate (local currency unit per $) are used as control variables. All variables ex-cept inflation are used as log difference.
The models are given below:
(1) (2)
where is the health expenditure (where i is the cross-section and t is the time), is the oil
price, is the GDP of 10 panel cross-section, is the exchange rate, is the inflation rate. In
equation (2) allows for the sectional fixed effects and allows for the time effect for all
cross-sections. is the error term.
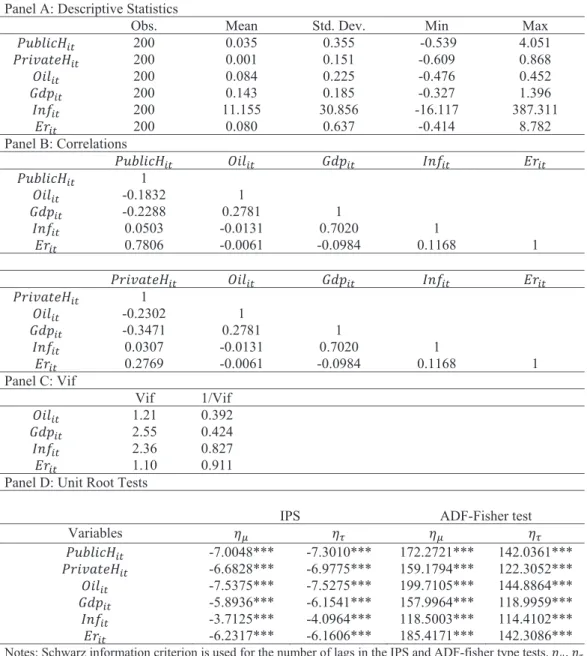
In Panel A of Table 1 descriptive statistics and correlation matrix of the variables are reported. Panel B of Table 1 illustrates correlation coefficients. Low values of these coefficients show no multicollinearity problem for independent variables. Variance Inflation Factor (VIF) is applied to double-check the multi-collinearity problem. Small values suggest that there is no multimulti-collinearity problem, since all values are less than five. Before emphasizing on the panel data analysis, F test of the heterogeneity of effects at the panel unit level and cross-sectional dependence in panel-data models are checked. No cross-sectional
dependence and no heteroskedasticty are found2. Stationarity properties of the series are also tested.
Panel D of Table 1 gives the results of Im, Pesaran and Shin (IPS, Im et al., 2003), and ADF-Fisher (Dickey and Fuller, 1979) type panel unit root tests. Constant, and a constant and trend is checked. It shows that all of the variables except the inflation rate are stationary in logarithmic difference form according to the IPS and the ADF-Fisher type panel unit root tests.
1 Due to the availaiblity of data these Middle East countries are selected.
58
2
Table 1: Descriptive Statistics and Correlations Panel A: Descriptive Statistics
Obs. Mean Std. Dev. Min Max
ܲݑܾ݈݅ܿܪ௧ 200 0.035 0.355 -0.539 4.051 ܲݎ݅ݒܽݐ݁ܪ௧ 200 0.001 0.151 -0.609 0.868 ܱ݈݅௧ 200 0.084 0.225 -0.476 0.452 ܩ݀௧ 200 0.143 0.185 -0.327 1.396 ܫ݂݊௧ 200 11.155 30.856 -16.117 387.311 ܧݎ௧ 200 0.080 0.637 -0.414 8.782 Panel B: Correlations ܲݑܾ݈݅ܿܪ௧ ܱ݈݅௧ ܩ݀௧ ܫ݂݊௧ ܧݎ௧ ܲݑܾ݈݅ܿܪ௧ 1 ܱ݈݅௧ -0.1832 1 ܩ݀௧ -0.2288 0.2781 1 ܫ݂݊௧ 0.0503 -0.0131 0.7020 1 ܧݎ௧ 0.7806 -0.0061 -0.0984 0.1168 1 ܲݎ݅ݒܽݐ݁ܪ௧ ܱ݈݅௧ ܩ݀௧ ܫ݂݊௧ ܧݎ௧ ܲݎ݅ݒܽݐ݁ܪ௧ 1 ܱ݈݅௧ -0.2302 1 ܩ݀௧ -0.3471 0.2781 1 ܫ݂݊௧ 0.0307 -0.0131 0.7020 1 ܧݎ௧ 0.2769 -0.0061 -0.0984 0.1168 1 Panel C: Vif Vif 1/Vif ܱ݈݅௧ 1.21 0.392 ܩ݀௧ 2.55 0.424 ܫ݂݊௧ 2.36 0.827 ܧݎ௧ 1.10 0.911
Panel D: Unit Root Tests
IPS ADF-Fisher test
Variables ߟఓ ߟఛ ߟఓ ߟఛ ܲݑܾ݈݅ܿܪ௧ -7.0048*** -7.3010*** 172.2721*** 142.0361*** ܲݎ݅ݒܽݐ݁ܪ௧ -6.6828*** -6.9775*** 159.1794*** 122.3052*** ܱ݈݅௧ -7.5375*** -7.5275*** 199.7105*** 144.8864*** ܩ݀௧ -5.8936*** -6.1541*** 157.9964*** 118.9959*** ܫ݂݊௧ -3.7125*** -4.0964*** 118.5003*** 114.4102*** ܧݎ௧ -6.2317*** -6.1606*** 185.4171*** 142.3086***
Notes: Schwarz information criterion is used for the number of lags in the IPS and ADF-fisher type tests. ߟఓ, ߟఛ
are unit rott tests with a constant, and a constant and trend, respectively. ***, **, * indicates rejection of the unit root hypothesis at the 1%, 5%, and 10% significance lecel respectively.
Methodology
In terms of theoretical and empirical framework, Leu (1986) and Hitiris and Posnett (1992) used an out-line containing health expenditures, the GDP, and non-income determinants of health spending. Due to the availability of data, this study aims to use extended variables. Dynamic model is included in the
59
study. Furthermore, lagged value of the dependent variable turns static model into a dynamic model.
Dynamic panel GMM3 of Arellano and Bond (1991) is used to avoid the biases in the panel regression.
(3)
where is the health expenditure (where i is the cross-section and t is the time) and is the
lagged value of health expenditure. is the vector of the all variables that effect health expenditures
and is the coefficient of the . is the cross-sectional fixed effect and is the error term.
In dynamic panel GMM method, the first difference of the error terms and the level forms of the lagged values of the regressors are examined. Lagged values of instrumental variables and the differences of ex-planatory variables may create estimation problems, i.e., heterogeneity and autocorrelation. As a solu-tion, Arellano and Bover (1995) came up with the system GMM. Apart from the level form of the explan-atory variables, their lagged values plus instrumental variables including GMM instruments are utilized in order to eliminate the heterogeneity problem. Besides, the inclusion of the second lag solves the au-tocorrelation problem, since it is not correlated with the current error term.
Causality Tests in Time and Frequency Domain Analyses
In order to test if the past changes in x (y) have an impact on current changes in y (x) over a specified time period, Granger (1969) causality test is used. This analysis demonstrates outcomes on causality over all frequencies. Geweke’s (1982) linear measure of feedback from one variable to another at a given fre-quency gives us detailed information about feedback relationships between oil prices and health expen-ditures over different frequency bands.
By using a Fourier transformation to VAR (p) model for x and y series, Geweke’s measure of linear feed-back from y to x at frequency ω is defined as:
2 12 2 2 11 11
(
)
2
( )
( ) log
log 1
(
)
(
)
i x y x i ie
f
M
e
e
ω ω ωψ
π
ω
ω
ψ
ψ
− → − −
=
=
+
(4) If 2 12(
e
iω)
ψ
−=0, then Geweke’s measure will be zero, then y will not Granger cause x at frequency ω. Breitung and Candelon (2006) altered this test by reformulating the relationship between x and y in VAR equation:
1 1
...
1 1...
1t t p t p t p t p t
x
=
α
x
−+
+
α
x
−+
β
y
−+
+
β
y
−+
ε
(5)The null hypothesis tested by Geweke,
M
y x→( ) 0
ω
=
, corresponds to the null hypothesis of0
: ( )
0
H R
ω β
=
60
where β is the vector of the coefficients of y and
cos( )cos(2 )...cos(
)
( )
sin( )sin(2 )...sin(
)
p
R
p
ω
ω
ω
ω
ω
ω
ω
=
.Breitung and Candelon (2006) simplify Geweke’s null hypothesis, so that a usual F-statistics can be used to test causality in frequency domain. That’s why this study uses Breitung and Candelon (2006) version of Geweke (1982).
4- Empirical Findings
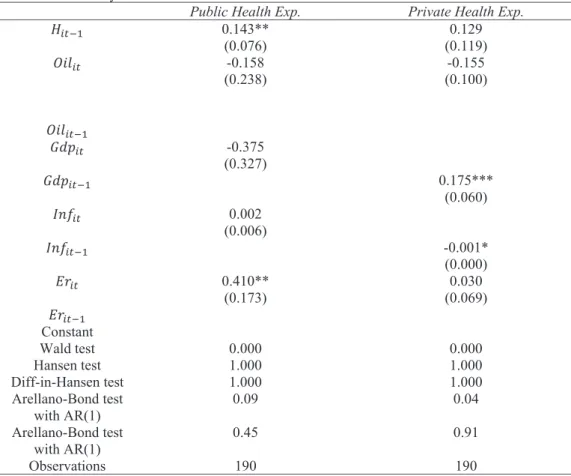
Dynamic analyses are carried for 10-panel cross-sections. Table 2 represents the results of GMM esti-mates. This paper examines the impact of oil prices on health expenditures distinguishing public and private health expenditures. Regressor (1) represents the dependent variable as public health expendi-tures, and in regressor (2) dependent variable is private health expenditures. Two-step GMM-system are shown in Table 2. Wald test, Hansen test, and autocorrelation test statistics are reported in GMM esti-mates. Wald test shows that all models are statistically significant at 1% level jointly in system GMM es-timations. Over identifying restrictions are tested with Hansen test (Roodman, 2009). Finally, in order to check the autocorrelation AR (1) - rejects the null hypothesis of no first-order autocorrelation -, and AR (2), - rejects the null hypothesis of no second order autocorrelation -, of Arrelano-Bond (1991) are carried. The dynamic GMM results show, as illustrated in Table 2, that the coefficients of the oil prices, the GDP, the exchange rate, and inflation. It is seen that all variables except the exchange rate are statistically in-significant saying that oil prices, the GDP, and the inflation rate do not have an impact on public health expenditures. However, the exchange rate is significantly positive. When the exchange rate increases, national economies lose their assets. Thus, this might be the most probable reason why they spend on public health expenditures. For the private health expenditures, in line with the expectations, the infla-tion rate and the GDP have the expected signs (positive coefficient for the GDP and negative for the in-flation rate), as in Govindaraj et al. (1997) and Hall and Jones (2007). The GDP is significantly positive at the 1% significance level. The GDP coefficient is 0.175. The coefficient of the inflation rate shows statisti-cal significance with negative effect. This illustrates that when the inflation rate is low, private health ex-penditures increase in 10 MENA countries. The Wald test is significant as well as AR (1) and AR (2) tests are satisfactory for both models.
61
3
Table 2: GMM-System Estimates
Public Health Exp. Private Health Exp.
ܪ௧ିଵ 0.143** (0.076) (0.119) 0.129 ܱ݈݅௧ -0.158 (0.238) (0.100) -0.155 ܱ݈݅௧ିଵ ܩ݀௧ -0.375 (0.327) ܩ݀௧ିଵ 0.175*** (0.060) ܫ݂݊௧ 0.002 (0.006) ܫ݂݊௧ିଵ -0.001* (0.000) ܧݎ௧ 0.410** (0.173) (0.069) 0.030 ܧݎ௧ିଵ Constant Wald test 0.000 0.000 Hansen test 1.000 1.000 Diff-in-Hansen test 1.000 1.000 Arellano-Bond test with AR(1) 0.09 0.04 Arellano-Bond test with AR(1) 0.45 0.91 Observations 190 190
Note: standard errors are given in parenthesis. The Hansen test shows the validity of the instrumental variables. The Diff-in-Hansen test reports the p-value for the validity of the additional moment restrictions required. AR (1), and AR (2) show p-values of Arellano-Bond autocorrelation tests. ***, **, * indicate a significance of 1%, 5%, and 10% respectively.
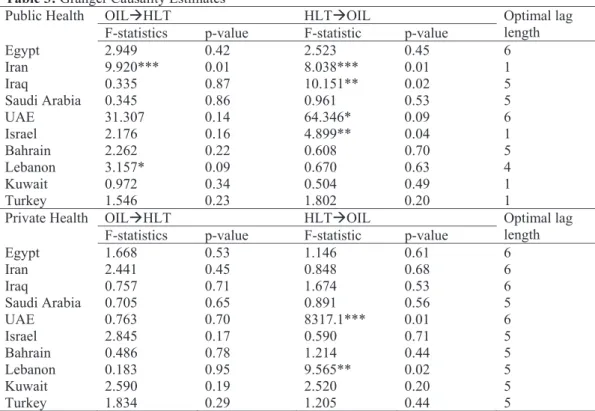
The relationship between oil prices and health expenditures for each country is investigated via causal-ity tests in time domain. Pairwise Granger causalcausal-ity tests are given in Table 3. As illustrated in Table 3, only Iran shows causal relations for both directions from public health expenditures to oil prices and oil prices to public health expenditures. In Lebanon there is a causal relation from health expenditures to oil prices. However, for the UAE, Iraq, and Israel, it is in an opposite direction. In private health expendi-tures, only the UAE and Lebanon’s coefficients are significant. This means that causal link is from private health to oil prices. Since Iran, Iraq, and the UAE are oil-exporting economies, these results are in line with the expectations.
62
4
Table 3: Granger Causality Estimates
Public Health OILHLT HLTOIL Optimal lag
length
F-statistics p-value F-statistic p-value
Egypt 2.949 0.42 2.523 0.45 6 Iran 9.920*** 0.01 8.038*** 0.01 1 Iraq 0.335 0.87 10.151** 0.02 5 Saudi Arabia 0.345 0.86 0.961 0.53 5 UAE 31.307 0.14 64.346* 0.09 6 Israel 2.176 0.16 4.899** 0.04 1 Bahrain 2.262 0.22 0.608 0.70 5 Lebanon 3.157* 0.09 0.670 0.63 4 Kuwait 0.972 0.34 0.504 0.49 1 Turkey 1.546 0.23 1.802 0.20 1
Private Health OILHLT HLTOIL Optimal lag
length
F-statistics p-value F-statistic p-value
Egypt 1.668 0.53 1.146 0.61 6 Iran 2.441 0.45 0.848 0.68 6 Iraq 0.757 0.71 1.674 0.53 6 Saudi Arabia 0.705 0.65 0.891 0.56 5 UAE 0.763 0.70 8317.1*** 0.01 6 Israel 2.845 0.17 0.590 0.71 5 Bahrain 0.486 0.78 1.214 0.44 5 Lebanon 0.183 0.95 9.565** 0.02 5 Kuwait 2.590 0.19 2.520 0.20 5 Turkey 1.834 0.29 1.205 0.44 5
Note: *, **, *** denote 1%, 5%, and 10% significance respectively. The lag length has been chosen based on minimum AIC.
In Figures 3 and 4, the frequency domain analysis are given. As it was observed in causality analysis in time domain, causality examined is two-way. Low frequencies refer to the long-run and high fre-quencies refer to the short-run causality. As it is observed in Figure 1, for public health expenditures, in terms of the impact of health expenditures on oil prices, Egypt and the UAE reflect causality both in the short-run and the long-run. However, the direction of the causality is from oil-prices to health expenditures in both the short and the long-run in Iraq. For Bahrain, health expenditures have an im-pact on oil prices within the [1.5-2.5] range interval. However, for Lebanon there is causal relation in the direction from oil prices to health expenditures in the long-run and from oil prices to health ex-penditures in the short-run in Bahrain.
63 5 Figure 3 : Frequenc y Dom
ain- Public Health Expendit
ures 1 1 Optim
al lags are dete
rm ined according t o V AR a nalysis. Optim al lag length is 1 for I ra n, Isr ae l, K uw ait, and Tur ke y an d fr equ en cy dom
ain analysis doe
s n ot w or k w ith 1 la g th er ef ore , t he se c ou nt rie s a re n ot in cl ud ed .
In the case of private health expenditures, Egypt, Iran, Iraq, the UAE, Kuwait and Turkey reflect the direc-tion of the causality from oil prices to health expenditures both in the short and the long-run. Being an
64
oil-exporting country may be associated with that causality. On the other hand, for Israel health
expen-ditures have an impact on oil prices in the long-run. In Bahrain the range is between [1-2] and [2.5-3].6
Figure 4
: Frequenc
y Dom
ain- Private Health Expendi
65
66
5- Conclusion
In this study, the impact of the oil prices on health expenditures is investigated. By applying a GMM-sys-tem approach, a balanced panel of 10 MENA countries is collected from the period 1995 – 2014. There is no doubt that oil prices are very important for especially the countries in the MENA region, because of their impact on exports and imports. During the analysis, public and private health expenditures are separately used as dependent variables. The oil price is the independent variable, while the GDP, the in-flation rate, and the exchange rate are used as control variables.
The empirical results demonstrate that the increase in the GDP leads to a 0.175 increase in private health expenditures. Moreover, it is also observed that the inflation has a negative impact. It is worth mentioning that the MENA countries analyzed in this paper often trade with each other in the region. This suggests that regional growth, and thus health expenditures are influenced by increases in the oil prices both for oil-exporting and non-oil-exporting countries. Lastly, two-way causality is investigated between oil prices and health expenditures for 10 MENA countries separately. It is observed that the majority of the oil-ex-porting countries reflect causality from oil prices to health expenditures, while non-oil-exoil-ex-porting coun-tries do not reflect causality, regarding private health expenditures. As a conclusion, it can be argued that with the fluctuations in oil prices, oil-exporting countries may move towards a private health care (or a mixed system of private and public) with the intention to obtain greater efficiency.
References
Acemoglu, D., Finkelstein, A., & Notowidigdo, M. J. (2013). Income and health spending: Evidence from oil price shocks. Review of Economics and Statistics, 95(4), 1079-1095.
Arellano, M., & Bond, S. (1991). Some tests of specification for panel data: Monte Carlo evidence and an application to employment equations. The review of economic studies, 58(2), 277-297.
Arellano, M., & Bover, O. (1995). Another look at the instrumental variable estimation of error-components models. Journal of econometrics, 68(1), 29-51.
Breitung, J., & Candelon, B. (2006). Testing for short-and long-run causality: A frequency-domain ap-proach. Journal of Econometrics, 132(2), 363-378.
Brown, S., Hole, A. R., & Kilic, D. (2014). Out-of-pocket health care expenditure in Turkey: Analysis of the 2003–2008 Household Budget Surveys. Economic Modelling, 41, 211-218.
Darby, M. R. (1982). The price of oil and world inflation and recession. The American Economic Review, 72(4), 738-751.
Dickey, D. A., & Fuller, W. A. (1979). Distribution of the estimators for autoregressive time series with a unit root. Journal of the American Statistical Association, 74(366a), 427-431.
Dizaji, S. F. (2014). The effects of oil shocks on government expenditures and government revenues nexus (with an application to Iran’s sanctions). Economic Modelling, 40, 299-313.
67
El-Anshasy, A., Bradley, M. D., & Joutzl, F. (2005). Evidence on the role of oil prices in Venezuela’s economic Performance: 1950-2001. Working Paper, University of Washington.
Farzanegan, M. R., & Markwardt, G. (2009). The effects of oil price shocks on the Iranian economy. Energy Economics, 31(1), 134-151.
Filmer, D., & Pritchett, L. (1999). The impact of public spending on health: does money matter?. Social sci-ence & medicine, 49(10), 1309-1323.
Geweke, J. (1982). Measurement of linear dependence and feedback between multiple time series. Jour-nal of the American statistical association, 77(378), 304-313.
Govindaraj, R., Chellaraj, G., & Murray, C. J. (1997). Health expenditures in Latin America and the Carib-bean. Social Science & Medicine, 44(2), 157-169.
Granados, J. A. T., & Rodriguez, J. M. (2015). Health, economic crisis, and austerity: a comparison of Greece, Finland and Iceland. Health Policy, 119(7), 941-953.
Granger, C. W. (1969). Investigating causal relations by econometric models and cross-spectral meth-ods. Econometrica: Journal of the Econometric Society, 424-438.
Hall, R. E., & Jones, C. I. (2007). The value of life and the rise in health spending. The Quarterly Journal of Economics, 122(1), 39-72.
Hamilton, J. D. (1983). Oil and the macroeconomy since World War II. Journal of political economy, 91(2), 228-248.
Hitiris, T., & Posnett, J. (1992). The determinants and effects of health expenditure in developed countries. Journal of Health Economics, 11(2), 173-181.
Im, K. S., Pesaran, M. H., & Shin, Y. (2003). Testing for unit roots in heterogeneous panels. Journal of Econo-metrics, 115(1), 53-74.
Jaba, E., Balan, C. B., & Robu, I. B. (2014). The relationship between life expectancy at birth and health expen-ditures estimated by a cross-country and time-series analysis. Procedia Economics and Finance, 15, 108-114. Leu, R. E. (1986). The public-private mix and international health care costs. Public and private Health Ser-vices, 79(2).
Mou, H. (2013). The political economy of the public–private mix in heath expenditure: An empirical re-view of thirteen OECD countries. Health policy, 113(3), 270-283.
Narayan, P. K. (2006). Examining structural breaks and growth rates in international health expendi-tures. Journal of health economics, 25(5), 877-890.
Parker, S. W., & Wong, R. (1997). Household income and health care expenditures in Mexico. Health Pol-icy, 40(3), 237-255.
68
Rajkumar, A. S., & Swaroop, V. (2008). Public spending and outcomes: Does governance matter?. Journal of development economics, 86(1), 96-111.
World Bank. (1995). Social challenges of transition project, Central and Southern Europe department, Eastern Europe and Central Asia region. Washington, DC.