https://doi.org/10.1177/1550059417750914 Clinical EEG and Neuroscience 2018, Vol. 49(3) 171 –176 © EEG and Clinical Neuroscience Society (ECNS) 2018
Reprints and permissions: sagepub.com/journalsPermissions.nav DOI: 10.1177/1550059417750914 journals.sagepub.com/home/eeg Psychiatry/Psychology
Introduction
Frontotemporal dementia (FTD) is the second most common type of dementia following Alzheimer’s dementia, constituting about 10% of dementia patients.1,2 Although 3 various forms of FTD can be seen in clinical practice, behavioral variant FTD (bvFTD) appears to be the most common form and it is mainly associated with frontotemporal lobar degeneration.3
As is evident from its name, bvFTD presents with behav-ioral symptoms including changes in emotional processing and interpersonal relationships such as inappropriate social behav-iors, empathy loss or compulsive behavbehav-iors, as well as changes in executive functioning such as poor decision making.4,5 Many of these behavioral changes can be easily confused with psy-chiatric symptoms typically seen in bipolar disorder.6,7 Indeed, converging evidence suggests that 30% of FTD patients may display euphoria and up to 40% may have depression/dyspho-ria.8,9 In parallel to this, evidence shows more than 50% of bvFTD patients have been initially misdiagnosed as bipolar disorder (BD), and in turn, wrongly treated.10
On the other side, cognitive assessment is not helpful for a correct diagnosis, as patients with BD can persistently have sig-nificant cognitive impairment. According to the literature, cogni-tive dysfunctions in specific domains such as sustained attention, verbal memory, and executive control have been strongly associ-ated with BD.11 Furthermore, the cognitive deficits continue to exist even in euthymic BD patients after remission.12
Neuroimaging studies have consistently reported patients with bvFTD have atrophy in anterior temporal cortices, orbitofrontal 1Department of Psychology, Uskudar University, Istanbul, Turkey
2NPIstanbul Brain Hospital, Istanbul, Turkey
3Department of Computer Engineering, Uskudar University, Istanbul, Turkey 4Department of Radiology, Medipol University, Istanbul, Turkey
5Department of Neuroscience, Uskudar University, Istanbul, Turkey
Corresponding Author:
Baris Metin, Department of Neuroscience, Uskudar University, Haluk Turksoy sok. no:14, 34662, Altunizade, Uskudar, Istanbul.
Email: [email protected]
Full-color figures are available online at http://journals.sagepub.com/home/eeg
The Use of Quantitative EEG for
Differentiating Frontotemporal Dementia
From Late-Onset Bipolar Disorder
Sinem Zeynep Metin
1,2, Turker Tekin Erguzel
3, Gulhan Ertan
4,
Celal Salcini
2, Betul Kocarslan
5, Merve Cebi
1, Baris Metin
1,5,
Oguz Tanridag
1,5, and Nevzat Tarhan
1,2Abstract
The behavioral variant frontotemporal dementia (bvFTD) usually emerges with behavioral changes similar to changes in late-life bipolar disorder (BD) especially in the early stages. According to the literature, a substantial number of bvFTD cases have been misdiagnosed as BD. Since the literature lacks studies comparing differential diagnosis ability of electrophysiological and neuroimaging findings in BD and bvFTD, we aimed to show their classification power using an artificial neural network and genetic algorithm based approach. Eighteen patients with the diagnosis of bvFTD and 20 patients with the diagnosis of late-life BD are included in the study. All patients’ clinical magnetic resonance imaging (MRI) scan and electroencephalography recordings were assessed by a double-blind method to make diagnosis from MRI data. Classification of bvFTD and BD from total 38 participants was performed using feature selection and a neural network based on general algorithm. The artificial neural network method classified BD from bvFTD with 76% overall accuracy only by using on EEG power values. The radiological diagnosis classified BD from bvFTD with 79% overall accuracy. When the radiological diagnosis was added to the EEG analysis, the total classification performance raised to 87% overall accuracy. These results suggest that EEG and MRI combination has more powerful classification ability as compared with EEG and MRI alone. The findings may support the utility of neurophysiological and structural neuroimaging assessments for discriminating the 2 pathologies.
Keywords
bipolar disorder, frontotemporal dementia, EEG, artificial neural network modeling, MRI Received August 28, 2017; revised November 8, 2017; accepted December 1, 2017.
cortices as well as subcortical structures as amygdala, striatum and hippocampus.13-15 Similarly, studies investigating neuroanat-omy of BD focused on prefrontal-striatal-thalamic circuits and have identified neuroanatomic substrates of BD.16,17 Decreased prefrontal subregional volumes, amygdala and striatal enlarge-ment in BD have been reported as the most prominent findings. Furthermore, functional imaging studies consistently indicated decreased PFC and increased anterior cingulate metabolism.18,19 Therefore, dysfunction in prefrontal cortices and anterior limbic structures, including amygdala, striatum, and thalamus have been supposed to be responsible for mood dysregulation in bipolar dis-order.16 Regarding overall brain volumes, on the other hand, a recent longitudinal study revealed that total gray matter and white matter volumes did not differ between BD patients and healthy controls.20
Numerous EEG studies have provided evidence for EEG alterations in BD. BD patients have decreased alpha and increased theta power in frontocentral regions.21,22 Furthermore, BD patients were found to have decreased interhemispheric synchronization.23 On the other hand, studies investigating neurophysiological alterations in bvFTD are rare in literature. Lindau et al24 examined neurophysiological features of FTD as compared with Alzheimer’s disease and reported absence of an increase in slow qEEG activities and a decrease in fast activi-ties in FTD. Nishida et al25 reported that FTD patients had globally decreased alpha as compared with controls. In addi-tion, Caso et al26 reported increased global theta power in FTD and Yu et al27 reported increased connectivity in delta band in FTD patients as compared with controls.
Overlapping symptoms of FTD and BD can be problematic in clinical setting, as the 2 disorders should be treated differ-ently. Currently, frontotemporal atrophy is used as a supporting finding for FTD diagnosis. However, as the BD patients can also have frontal atrophy, combining MRI with EEG may increase diagnostic accuracy. To our knowledge, no study simultaneously compared neuroanatomical and electrophysio-logical correlates of FTD and BD. Therefore, the aim of the present study is to establish a reliable differential diagnostic method by means of an artificial intelligence approach that uses EEG and MRI findings.
Method
Participants
18 patients with the diagnosis of bvFTD and 20 patients with the diagnosis of late-life BD were identified retrospectively from NPIstanbul Brain Hospital Databases. The patients were between 52 and 77 years old. The groups did not differ for age (mean = 64 years for both). The diagnosis of bvFTD was con-firmed using international consensus criteria and all patients had predominant executive function abnormalities confirmed using neuropsychological testing that included Stroop test, ver-bal and nonverver-bal memory, and forward and backward digit span tests.28 BD was confirmed using DSM-5 (Diagnostic and
Statistical Manual of Mental Disorders, 5th edition).29 BD
patients had at least 2 years follow-up to rule out progressive cognitive decline.
Electrophysiological Data Collection
Participants were seated comfortably in a room with dim light. Resting EEG activity was recorded according to the International 10-20 system using 19 electrodes during 3 min-utes in an eyes closed condition. Electrode impedances were kept below 10 kohm (monitored online by SCAN software). The linked mastoid electrodes (A1-A2) were used as reference. The data sampling rate was 250 Hz and the acquired signals were bandpass filtered at 0.15 to 70 Hz. The data analysis was completed using the Neuroguide Deluxe 2.5.1 software (Applied Neuroscience, St Petersburg, FL).
Each participant’s data were averaged across the recording epochs for each electrode, and the relative power (percentage of the total power) was computed for each of the following frequency bands: delta (0-4 Hz), theta (4-8 Hz), alpha (8-12 Hz), beta (12-30 Hz). Data from the following electrodes were used: F3, F4, T3, T5, T4, T6. These electrodes were chosen as they represent frontal and temporal areas and they are usually free from artefacts such as eye movements.
Magnetic Resonance Imaging Scan
Structural magnetic resonance imaging (MRI) was performed using 1.5 tesla Philips Achieva scanner (Philips, Best, the Netherlands). The sequences included 3D MPARGE T1, axial T2, and coronal FLAIR images.
Data Analysis
All patients’ clinical MRI scans were assessed by a double-blind method to make diagnosis from MRI data. MRI data were classified as BD and FTD by a radiologist blind to the diagno-sis and patient history.
Artificial Neural Network Modeling. Artificial neural networks
(ANNs) are mostly known as biologically inspired machine learning method that is capable of modeling complex nonlinear relations. ANN model employed in this study had one input layer, one hidden layer, and one output layer. Each layer had a set of nodes that simulates real neurons as given in Figure 1. ANNs are made up of large number of simple, highly intercon-nected processing components called nodes that abstractly emulate the structure and operation of biological nervous sys-tem. Learning process in ANNs is realized by using some train-ing algorithms that are based on some mathematical operations that mimic the learning mechanisms of real biological systems. Since there are various types and architectures of neural net-works considering the way they learn, the details of which per-form better studied in the literature. In this study, ANN structure was set as multilayer perceptron (MLP), which is a powerful function approximator for prediction and classification with a supervised learning algorithm. The architecture of MLP neural
network is constructed with 2 or more layers. A basic 2-layer ANN contains an input layer connected to input variables and an output layer that generated the corresponding output. Despite the fact that MLP is a satisfactory approximator for linear problems, in order to handle nonlinear systems, hidden layers are inserted to handle the problem’s nonlinearity and complexity. Although the number of hidden layers depends on complexity of the function or the process being modeled, a net-work with one hidden layer may also sufficient to map an arbi-trary function. Therefore, a 3-layered ANN was employed in our study. The number of neurons used in the hidden layer was 20. Since there were 6 inputs as relative power values of theta frequency band from the electrodes F3, F4, T3, T5, T4, T6, and the radiological diagnosis was set as input column vector. The learning rate was set as 0.2 and the stopping criterion was set at 250 epochs. Training algorithms are an integral part of ANN model construction process. A good training algorithm shortens the training time, while achieving a better accuracy, thus train-ing process is crucially significant step for the ANNs. Various training algorithms are used to train a multilayered neural net-work. Backpropagation training algorithm that is based on searching an error surface using gradient descent for points with minimum error is the mostly used one. The term back-propagation is sometimes used to refer specifically to the gradi-ent descgradi-ent algorithm, when applied to neural network training. Gradient descent algorithm updates the network weights and biases in the direction in which the performance function decreases most rapidly to enable faster convergency, therefore the selection process of the training algorithm some of which use gradient or Jacobian-based methods is crucial. In our study, training function was set as TrainLM (Levenberg-Marquardt) and transfer function was set as tangent sigmoid which returns each element of N squashed between −1 and 1.30
Feature Selection Using Genetic Algorithm. The collection of
high-resolution EEG data from various brain regions leads to a very high-dimensional feature space. Since selection of those regions with more informative features that contribute to the classification accuracy more is a valuable step, many recent optimization algorithms are combined with classification methods. Being a well-known approach that makes no assump-tions of relaassump-tionships among features involves the use of genetic algorithms (GAs) to search the space of feature sub-sets.31,32 The GA, was first introduced to the literature in the early 1970s, is an adaptive heuristic optimization algorithm inspired by the laws of natural selection and genetics. Gener-ally, gradient-based search methods search for an optimal point in a multidimensional optimization space by repeatedly refin-ing to a srefin-ingle solution while GA is operatrefin-ing on a collection of candidate solutions in parallel.33
The GA is initiated with an initial population of individuals and each represents a possible solution to a given optimization problem. Through the optimization process successive genera-tions are created that evolves to new set possible solugenera-tions called individual or chromosome. Each new individual has a fixed length of continuous or discrete strings that are generally expressed as binary strings. The overall process called evolu-tion procedure consists of three successive steps; reproducevolu-tion, crossover, and mutation. The selection process simulates the survival of the fittest in nature. The fitness value of each indi-vidual is calculated according to the classification performance of the individual. Since many individuals may perform similar, the GA selects certain best individuals from the current popula-tion, called parents, in order to move them and their genes to the offsprings, which does not assure diversity. But with cross-over, the parents exchange their genes to form new individuals for the next generation. Besides, the variety is increased with the use of mutation that randomly modifies parent genes within the population.34
In our study, GA was implemented with a population of 10, 2-point crossover probability of 0.66, and mutation rate of 0.01. Crossover and mutation were applied uniformly to each generation’s selected individuals. Since fitter individuals tend to have better probability of survival with the use of selection process they are supposed to go forward to form the mating pool to create the next generation. The selection scheme was set as tournament with 0.33 tournament size, which provides selective pressure by holding a tournament competition among n individuals. The evaluation of each individual in the popula-tion consisted of training, testing. and validapopula-tion sets using 3-fold cross validation with stratified sampling and averaging classification accuracy as the individual’s fitness measure.
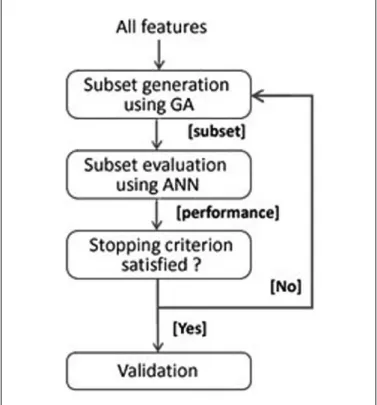
In order to state a collaborative structure for feature selec-tion and classificaselec-tion methods a wrapper based approach is employed as depicted in Figure 2. Before starting the feature selection process, we first fed the ANN model with relative power values collected from F3, F4, T3, T5, T4, and T6 elec-trodes of 4 frequency bands and radiological diagnosis for each subject. Following the model generation process, genetic algo-rithm was introduced to select more informative features of the
Figure 1. Structure of designed multilayer perceptron artificial
given dataset. Prior to the ANN model, feature selection step was added to form the hybrid structure. Instead of inputting the whole data set to the model, GA was employed to select a set of features where different combinations were prepared, evalu-ated, and compared in terms of their classification perfor-mances. Feature selection process using GA was executed repeatedly till one of the stopping criteria was satisfied and the performance estimation of the hybrid model was expressed through the cross-validation step.
Results
The radiologist completely blind to the diagnosis misclassified 4 subjects in each group (79% accuracy). In EEG analysis, input data are collected from F3, F4, T3, T4, T5, and T6 elec-trodes in 5 frequency bands first. Relative power values were calculated, and classification accuracies were computed using ANN approach and wrapper-based ANN-GA method, respec-tively. The results indicated accuracy levels of 65.6%, 76.2%, 60.68%, and 60.47% for delta, theta, alpha, and beta bands, respectively.
ANN approach underlines that the models using relative power for theta frequency band outperforms compared with other bands. Since the contribution of radiological diagnosis is not included in the model, in the next step we assumed the radiological diagnosis as a new input to observe if the predic-tion capability of the model is considerable or not. Besides we have also added genetic algorithm in order to select more infor-mative features contributing to the classification performance of the model.
As given in Table 1, radiological diagnosis is a valuable parameter increasing the classification accuracy. Combining the model with GA increased the performance as area under the receiver operating characteristic (ROC) curve (AUC) values and accuracy values underline. Besides, Gini coefficients that are recently being used in classification problems were also calculated. Gini coefficient can be straight away generated from the AUC value, which is the ratio of area between the ROC curve and the diagonal line and the area of the above tri-angle in the ROC curve. Gini = (2 * AUC – 1) is the equation used in order to express the Gini coefficient in terms of AUC value. For the standalone ANN model, the Gini value is calcu-lated as 0.56 while for the hybrid model the value is 0.72 that points out a quite satisfying score in terms of model perfor-mance. Apart from the classification performance, a graphical representation of comparative performances of the models were also plotted as ROC curves as given in Figure 3.
Table 1. Classification Performance of ANN Models When
Radiological Diagnosis Is Included.
ANN ANN + GA
Accuracy 81.2% Weight Accuracy 87.18% Weight
AUC 0.78 AUC 0.86 Features Features F3 theta 1 T3 theta 0 F4 theta 1 T4 theta 0 T3 theta 1 T5 theta 1 T4 theta 1 T6 theta 1 T5 theta 1 F3 theta 1 T6 theta 1 F4 theta 1
Radiological diagnosis 1 Radiological diagnosis 1
Abbreviations: ANN, artificial neural network; AUC, area under the receiver operating characteristic curve; GA, genetic algorithm.
Figure 3. The figure reveals that radiological diagnosis has a
valuable contribution to the model performance. Therefore, in addition to processing raw EEG data, attaching the experience of an expert to the input matrix improves the prediction capability of the model.
Discussion
In this study, we first aimed to compare the utility of EEG and structural MRI for differentiating BD and FTD. Second, we aimed to show if combining both modalities improved the diagnostic accuracy. The results showed that the accuracy of both EEG spectral power and the radiologist were less than 80%. On the other hand, combining 2 classifiers (1 human and 1 machine) improved the accuracy to 87%.
Behavioral variant of FTD is usually diagnosed on the basis of behavioral problems and MRI showing frontotemporal atro-phy. Most studies have found that these criteria have moderate sensitivity (85%) but low specificity (82%).35 A major propor-tion of patients being wrongly diagnosed as FTD actually have mood disorders. These findings especially prompt that addi-tional neuroimaging techniques should be employed at the time of initial diagnosis. To date, very few studies have reported EEG findings in FTD as stated in the intro. However, in this study, we found that EEG findings especially in the theta band were discriminating FTD patients from BD patients almost as good as MRI. In addition, combined use of both techniques may be employed in clinical practice when diagnosis in doubt.
The findings also indicate that FTD is associated with increased slow waves at frontotemporal electrodes. This fron-totemporal slowing possibly corresponds to hypometabolism in FTD commonly reported in metabolic imaging studies. Although positron emission tomography (PET) is the preferred method to assess metabolic activity in suspected FTD patients,36 our results indicate that frontotemporal EEG slowing may also be helpful when PET is not available. The predictive value of EEG findings for neuropsychological deficit and prognosis should also be investigated in future studies.
Apart from the studies using statistical methods, a hybrid artificial intelligence approach combining genetic algorithm and artificial neural network was employed to differentiate FTD from late-onset BD using not only the relative power val-ues but also the radiological diagnosis as the inputs. The litera-ture on fealitera-ture selection techniques is very vast regarding the applications of machine learning to disorder classification. The proposed approach prevented the contribution less informative features to the output. Using the selected features, a back-prop-agation neural network was generated for classification. The outcomes of the combined model are promising and could pos-sibly be useful for the diagnosis.
The main shortcoming of our study is low sample size. The exact accuracy of EEG in discriminating BD and FTD can be established in larger studies. In addition, the discrim-inating ability of EEG was assessed using multivariate machine learning methods. The accuracy of human evalua-tion should be assessed separately in future studies. Third, although FTD is the commonly associated with behavioral problems other dementia types such as vascular dementia and dementia with Lewy bodies are also common and may also present with behavioral problems.37,38 EEG differences between these disorders and BD should be explored in future studies.
All in all, the main conclusion of our study is that greater theta power in frontotemporal leads in an older patient with behavioral problems should alert the clinician for a possible diagnosis of FTD along with the supporting MRI findings. In addition, we may also conclude that clinicians should also take into account the EEG, while evaluating a patient with behav-ioral problems starting after the age of 50 years.
Author Contributions
SZM conceived the original idea, identified the patients, wrote the manuscript. TTE wrote the manuscript, contributed to data analysis. GE contributed to data analysis. CS helped identifying the patients. BK contributed to data analysis. MC contributed to data analysis and writing the manuscript. BM contributed to data analysis and writing the manuscript. OT and NT helped implementation of the research. All authors critically revised the manuscript.
Declaration of Conflicting Interests
The author(s) declared no conflicts of interest with respect to the research, authorship, and/or publication of this article.
Funding
The author(s) received no financial support for the research, author-ship, and/or publication of this article.
References
1. Gregory CA, Hodges JR. Clinical features of frontal lobe demen-tia in comparison to Alzheimer’s disease. J Neural Transm Suppl. 1996;47:103-123.
2. Mendez MF, Perryman KM. Neuropsychiatric features of fronto-temporal dementia: evaluation of consensus criteria and review.
J Neuropsychiatry Clin Neurosci. 2002;14:424-429.
3. Neary D, Snowden JS, Gustafson L, et al. Frontotemporal lobar degeneration: a consensus on clinical diagnostic criteria.
Neurology. 1998;51:1546-1554.
4. Piguet O, Hornberger M, Mioshi E, Hodges JR. Behavioural-variant frontotemporal dementia: diagnosis, clinical staging, and management. Lancet Neurol. 2011;10:162-172.
5. Baez S, Pinasco C, Roca M, et al. Brain structural correlates of executive and social cognition profiles in behavioral variant frontotemporal dementia and elderly bipolar disorder [published online February 17, 2017]. Neuropsychologia. doi:10.1016/j.neu-ropsychologia.2017.02.012.
6. Levy ML, Miller BL, Cummings JL, Fairbanks LA, Craig A. Alzheimer disease and frontotemporal dementias. Behavioral dis-tinctions. Arch Neurol. 1996;53:687-690.
7. Marques GJ, Saraiva S, Brissos S. Frontotemporal dementia mim-icking bipolar affective disorder, normal pressure hydrocepha-lus and Klüver-Bucy syndrome. Asian J Psychiatry. 2015;18: 106-107.
8. Mourik JC, Rosso SM, Niermeijer MF, Duivenvoorden HJ, Van Swieten JC, Tibben A. Frontotemporal dementia: behavioral symptoms and caregiver distress. Dement Geriatr Cogn Disord. 2004;18:299-306.
9. Banks SJ, Weintraub S. Neuropsychiatric symptoms in behav-ioral variant frontotemporal dementia and primary progressive aphasia. J Geriatr Psychiatry Neurol. 2008;21:133-141.
10. Woolley JD, Khan BK, Murthy NK, Miller BL, Rankin KP. The diagnostic challenge of psychiatric symptoms in neurodegenera-tive disease: rates of and risk factors for prior psychiatric diag-nosis in patients with early neurodegenerative disease. J Clin
Psychiatry. 2011;72:126-133.
11. Quraishi S, Frangou S. Neuropsychology of bipolar disorder: a review. J Affect Disord. 2002;72:209-226.
12. Torres IJ, Boudreau VG, Yatham LN. Neuropsychological functioning in euthymic bipolar disorder: a meta-analysis. Acta
Psychiatr Scand Suppl. 2007;(434):17-26.
13. Rosen HJ, Gorno-Tempini ML, Goldman WP, et al. Patterns of brain atrophy in frontotemporal dementia and semantic dementia.
Neurology. 2002;58:198-208.
14. Seeley WW, Crawford R, Rascovsky K, et al. Frontal paralimbic network atrophy in very mild behavioral variant frontotemporal dementia. Arch Neurol. 2008;65:249-255.
15. Whitwell JL, Przybelski SA, Weigand SD, et al. Distinct anatom-ical subtypes of the behavioural variant of frontotemporal demen-tia: a cluster analysis study. Brain. 2009;132(pt 11):2932-2946. 16. Strakowski SM, Delbello MP, Adler CM. The functional
neuro-anatomy of bipolar disorder: a review of neuroimaging findings.
Mol Psychiatry. 2005;10:105-116.
17. Delaloye C, de Bilbao F, Moy G, et al. Neuroanatomical and neu-ropsychological features of euthymic patients with bipolar disor-der. Am J Geriatr Psychiatry. 2009;17:1012-1021.
18. Blumberg HP, Stern E, Martinez D, et al. Increased anterior cin-gulate and caudate activity in bipolar mania. Biol Psychiatry. 2000;48:1045-1052.
19. Ketter TA, Kimbrell TA, George MS, et al. Effects of mood and subtype on cerebral glucose metabolism in treatment-resistant bipolar disorder. Biol Psychiatry. 2001;49:97-109.
20. Delaloye C, Moy G, de Bilbao F, et al. Longitudinal analysis of cognitive performances and structural brain changes in latelife bipolar disorder. Int J Geriatr Psychiatry. 2011;26:1309-1318. 21. Clementz BA, Sponheim SR, Iacono WG, Beiser M. Resting
EEG in first episode schizophrenia patients, bipolar psychosis patients, and their first-degree relatives. Psychophysiology. 1994;31:486-494.
22. Tas C, Cebi M, Tan O, Hızlı-Sayar G, Tarhan N, Brown EC. EEG power, cordance and coherence differences between unipolar and bipolar depression. J Affect Disord. 2015;172:184-190.
23. Lieber AL, Newbury ND. Diagnosis and subtyping of depres-sive disorders by quantitative electroencephalography: III. Discriminating unipolar from bipolar depression. Hillside J Clin
Psychiatry. 1988;10:165-172.
24. Lindau M, Jelic V, Johansson SE, Andersen C, Wahlund LO, Almkvist O. Quantitative EEG abnormalities and cognitive dysfunctions in frontotemporal dementia and Alzheimer’s disease. Dement Geriatr Cogn Disord. 2003;15:106-114.
25. Nishida K, Yoshimura M, Isotani T, et al. Differences in quantitative EEG between frontotemporal dementia and Alzheimer’s disease as revealed by LORETA. Clin Neurophysiol. 2011;122:1718-1725. 26. Caso F, Cursi M, Magnani G, et al. Quantitative EEG and
LORETA: valuable tools in discerning FTD from AD? Neurobiol
Aging. 2012;33:2343-2356.
27. Yu M, Gouw AA, Hillebrand A. Different functional connectiv-ity and network topology in behavioral variant of frontotempo-ral dementia and Alzheimer’s disease: an EEG study. Neurobiol
Aging. 2016;42:150-162.
28. Rascovsky K, Hodges JR, Knopman D, et al. Sensitivity of revised diagnostic criteria for the behavioural variant of fronto-temporal dementia. Brain. 2011;134(pt 9):2456-2477.
29. American Psychiatric Association. Diagnostic and Statistical
Manual of Mental Disorders. 5th ed. Washington, DC: American
Psychiatric Association; 2013.
30. Subasi A, Ercelebi E. Classification of EEG signals using neu-ral network and logistic regression. Comput Methods Programs
Biomed. 2005;78:87-99.
31. Whitley D, Beveridge JR, Guerra- Salcedo C, Graves C. Messy genetic algorithms for subset feature selection. In: Baeck T, ed. Proceedings of the International Conference on Genetic
Algorithms. Burlington, MA: Morgan Kaufmann; 1997: 568-575.
http://www.cs.colostate.edu/~vision/publications/icga-1997mga. pdf. Accessed December 12, 2017.
32. Yang J, Honavar V. Feature subset selection using a genetic algo-rithm. In:Liu H, Motoda H, eds. Feature Extraction, Construction
and Subset Selection: A Data Mining Perspective. Boston, MA:
Klower Academic; 1998:117-136.
33. Garrett D, Peterson DA, Anderson CW, Thaut MH. Comparison of linear, nonlinear, and feature selection methods for EEG signal classification. IEEE Trans Neural Syst Rehabil Eng. 2003;11:141-144.
34. Ocak H. Optimal classification of epileptic seizures in EEG using wavelet analysis and genetic algorithm. Sig Process. 2008;88:1858-1867.
35. Vijverberg EG, Dols A, Krudop WA, et al. Diagnostic accu-racy of the frontotemporal dementia consensus criteria in the late-onset frontal lobe syndrome. Dement Geriatr Cogn Disord. 2016;41:210-219.
36. Jeong Y, Cho SS, Park JM, et al. 18F-FDG PET findings in fron-totemporal dementia: an SPM analysis of 29 patients. J Nucl Med. 2005;46:233-239.
37. Stewart JT. Psychiatric and behavioral manifestations of vascular dementia. Am J Geriatr Cardiol. 2007;16:165-170.
38. Borroni B, Agosti C, Padovani A. Behavioral and psychological symptoms in dementia with Lewy-bodies (DLB): frequency and relationship with disease severity and motor impairment. Arch