J. APIC. SCI. Vol. 63 No. 1 2019
69
DETERMINATION OF ANTIOXIDANT ACTIVITY, PHENOLIC COMPOUND,
MINERAL CONTENTS AND FATTY ACID COMPOSITIONS OF BEE
POLLEN GRAINS COLLECTED FROM DIFFERENT LOCATIONS
Mehmet M. Özcan1*
Fahad Aljuhaimi2
Elfadıl E. Babiker2
Nurhan Uslu1
Durmuş Ali Ceylan3
Kashif Ghafoor2
Mustafa Mete Özcan4
Nesim Dursun5
Isam Mohamed Ahmed2
Fadimu Gbemisola Jamiu2
Omer N. Alsawmahi2
A b s t r a c t
The objective of the present work was to investigate the influence of locations on bioactive propertiest, phenolic compounds and mineral contents of bee pollens. The oil content of pollen grains changed between 3.50% (Alanya) and 6.85% (Russia-Perm Region). The highest total phenolic content (720 mg/100g) and antioxidant activity values (81.4%) were observed in pollens obtained from the Russia-Perm Region and Alanya districts, respectively. Additionally, the highest carotenoid was found in a pollen sample collected from Karaman (Sarıveliler) (98.6 mg/g). The major phenolic compounds were (+)-catechin (66.75-337.39 mg/100g) and quercetin (61.2-1221.7 mg/100g) in all pollen samples. The pollen samples were observed to be a significant source of potassium (3846-6287 mg/ kg), phosphorus (2947-5010 mg/kg), calcium (1022-2424 mg/kg) and sulfur (1744-2397 mg/kg). All of the analysis results were significantly affected by supplying locations. The antioxidant activity values of pollens were found partly similar and varied depending on locations. The content of saturated fatty acid (palmitic) was high (20-30%) in the tested pollen samples but did not exceed the content of linoleic acid.
Keywords: bee pollen, bioactive properties, carotenoid, fatty acids, minerals, oil, phenolic compounds
1 Department of Food Engineering, Faculty of Agriculture, Selcuk University, 42031
Konya, Turkey
2 Department of Food Science & Nutrition, College of Food and Agricultural
Sciences, King Saud University, Riyadh, Saudi Arabia
3 Çumra High Vocational School, Selçuk University, 42500, Çumra, Konya,Turkey
4 Aydoğanlar Karapınar High Vocational College, Selçuk Universty, 42079,
Konya,Turkey
5 Department of Plant Nutrition and Soil Science, Faculty of Agriculture, Selcuk
University, 42031 Konya, Turkey
INTRODUCTION
Pollen has nutritional and physiological properties (Kroyer & Hegedus, 2001). The antia-therosclerotic action of pollen extract is probably
due to the metabolic conversion of α-linolenic
acid into eicosapentaenoic acid (Wójcicki et al., 1986; Seppanen et al., 1989) as well as its polyphenolic substances, flavonoids (Kroyer & Hegedus, 2001; Campos et al., 2003) and
an-*corresponding author: [email protected] Received: 27 March 2018; accepted: 15 January 2019
DOI 10.2478/JAS-2019-0004
Original Article
ÖZcAN et AL.
70
Bioactive properties of bee polen grains
timicrobial activity (Garcia et al., 2001; Basim,Basim, & Özcan, 2006; Carpes et al., 2009). Pollen grains are rich in phosphorus (6923.63 mg/kg), calcium (1031.98 mg/kg), potassium (5116.76 mg/kg), magnesium (754.64 mg/kg), manganese (5116.8 mg/kg) and zinc (50.6 mg/ kg pollen) (Carpes et al., 2009). Flavonol, gly-cossides and aglycones, and hydroxycinnamic acids present in free forms or combined with other pollen components are the major phenolic profile of bee pollen (Chantarudee et al., 2012; Fanali, Dugo, & Rocco, 2013). Antioxidant activity values of pollen grains decrease after one year (Campos et al., 2003). Bee pollen constitutes one of nature’s most complete and nutritious foods because it gathers almost all nutrients necessary for humans. From the information found on the literature it was possible to depict some of the most investigated effects of bee pollen. The constituents of pollen depends on botanical and geographical origin, plant status and climatic conditions (Carpes et al., 2009; Morais et al., 2011). The objective of the present work was to evaluate the effect of locations on the oil content, total phenolic content, anti-oxidant activity, carotenoid content, phenolic compounds and mineral content and fatty acids of bee pollen grains.
MATERIAL AND METHODS
Samples
Samples of bee pollen were collected during the 2016 beekeeping season (May - July) from the Turkish provinces of Antalya (Alanya), Hatay, Karaman (Sarıveliler), Konya (Hadim), Konya (Taşkent), Konya (Karapınar), Niğde (Bor). Two bee pollen samples were also provided from the Russia-Altay Mountain and Russia-Perm region in the same year. About 50 g of bee pollen sample was harvested from beehives found from the seven locations. The polen samples were trans-ferred to a laboratory in cooler bag. The pollen wase collected from the tray, placed in a clean paper bag and left for 24 hours to dry at room temperature. The samples were homogenised and kept in 500 mL glass flasks. After drying, the samples were frozen at -18°C until being
used. For the analyses, the mixed bee pollen was used. Prior to the chemical analyses, the pollen pellets were ground. All analyses were carried out in triplicate, and all results were expressed as mean±standard deviation.
Methods
Sample extraction
Pollen was extracted according to Ares et al. (2016) with some modifications. About 12 mL of methanol was added to 0.5 g ground pollen samples in an erlenmeyer flask. The mixture was shaken by vortex for 1 min and sonicated for 10 min, followed by centrifugation at 6000 rpm for 10 min. These steps were repeated twice. After the supernatants were collected, extract was concentrated at 37°C in a rotary evaporator. The volume of the extracts were completed to 5 mL methanol and then filtered with a 0.45 µm nylon filter.
Total phenolic content
Total phenol contents of the pollen samples were determined with the Folin-Ciocalteu (FC) reagent according to Yoo et al., (2004). Total phenolic content of the pollen extract was measured as 750 nm wave length in a spectro-photometer (Shimadzu, Japan). The results were given as mg gallic acid equivalent (GAE)/100 gram of fresh weight.
Antioxidant activity
The free-radicalscavenging activity of the pollen samples was determined using DPPH (1,1-di-phenyl-2-picrylhydrazyl) according to Lee et al. (1998). After the extract was mixed with 2 mL methanolic solution of DPPH, the absorbance was recorded at 517 nm with the use of a spec-trophotometer.
Carotenoid content
Carotenoids were extracted according to Silva da Rocha et al. (2015). Acetone (25 mL) was added to 2 g ground bee pollen sample in a 100 mL flask. The mixture was shaken by vortex for 10 min and filtrated with filter paper (Whatman No. 1), followed by a seperation funnel. The filtrate was fractionated with 20 mL
J. APIC. SCI. Vol. 63 No. 1 2019
71
of petroleum ether and washed with 100 mL of distilled water in order to remove the acetone. These steps were performed twice. Whatman No. 1 covered with anhydrous sodium sulfate (5 g) for removing residual water was used to filtrate the petroleum ether layer. The volume of the extracts was completed to 25 mL by petroleum ether. After these procedures, the absorbance was measured at 450 nm.
Determination of phenolic compounds
Phenolic compounds of bee pollen extracts were determined using Shimadzu-HPLC equipped with PDA detector and Inertsil ODS-3 (5 µm; 4.6 x 250 mm) column. 0.05% Acetic acid in water (A) and acetonitrile (B) mixture of the mobile phase were used for phenolic constituents analyses by HPLC. The flow rate of the mobile phase was 1 mL /min at 30°C and the injection volume was 20 µL. The peaks were recorded at 280 and 330 nm with PDA detector. The gradient program was as follows: 0-0.10 min 8% B; 0.10-2 min 10% B; 2-27 min 30% B; 27-37 min 56% B; 37-37.10 min 8% B; 37.10-45 min 8% B. The total running time per sample was 60 min. Phenolic compounds were determined according to the retention time and absorption spectra of peaks of standard compounds. The total area under peak was used to quantify each phenolic.
Mineral content
About 0.5 g of ground pollen was put into a
heated cup contained 15 mL of pure NHO3 and
2 mL H2O2 (30% v/v). The sample was
inciner-ated in a MARS 5 microwave oven at 210°C. The filtrates were analysed through Inductively Coupled Plasma-Atomic Emission Spectroscopy (ICP-AES) against standard solutions of known concentrations (Skujins, 1998).
Oil extraction
Pollen grains were extracted in a Soxhlet apparatus for 5 h, and the solvent (petroleum ether) was removed with a rotary evaporator at 50ºC (AOAC,1990). The oil obtained was kept at +4°C till analysis.
Fatty acid composition
Pollen oil was esterificated according to the ISO-5509 (1978) method, and fatty acid methyl esters were analyzed through the use of gas chromatography (Shimadzu GC-2010) equipped with flame-ionization detector (FID) and capillary column (Tecnocroma TR-CN100, 60 m x 0.25 mm, film thickness: 0.20 µm). A standard fatty acid methyl ester mixture (Sigma Chemical Co.) was used to determine sample peaks (AOAC, 1990).
Statistical Analyses
Results were subjected to analysis of variance with mean separation by Duncan’s multiple range test. Differences were considered statisti-cally significant at the p<0.05 levels. All analyses were carried out in triplicate, and all results were expressed as mean±standard deviation (MSTAT C) of independent pollen samples (Püskülcü & İkiz, 1989).
RESULTS
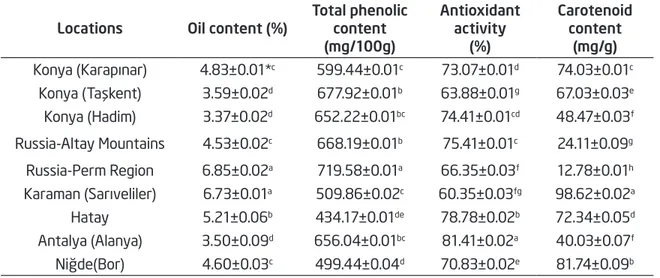
The oil, total phenolic content, antioxidant activity values and carotenoid contents of bee pollen samples are reported in Tab. 1. The oil contents of bee pollens changed between 3.37% (Alanya) and 6.85% (Russia-Perm Region). The total phenolic content ranged from 434.17 mg GAE/100g (Hatay) to 719.58 mg GAE/100g (Russia-Perm region). Carotenoid contents of pollen samples changed between 12.78 mg/g and 98.62 mg/g. In addition, the bee pollen collected from Karaman (Sarıveliler) had the maximum carotenoid content, with a value of 98.62 mg/g. The polyphenol content of bee pollen samples showed a change to location supplied. A relationship was observed among total phenol antioxidant activity values of bee pollen extracts depending on locations (p<0.05) (Tab. 1). A linear relationship has been observed between total phenol and antioxidant activity values in Russian bee pollen samples (p<0.05) (Tab. 1).
The phenolic compounds of bee pollen samples are presented in Tab. 2. (+)-Catechin and quercetin were determined as the main phenolic
ÖZcAN et AL.
72
Bioactive properties of bee polen grains
compounds in all bee pollen samples. The maximum (+)-catechin and quercetin contents were found in pollens of Hadim (337.40 mg/100g) and Karapınar (1221.73 mg/100g), respectively. Based on the location of pollens, the major gallic acid, naringenin, 1,2-dihydroxybenzene, rutin trihydrate and 3,4-dihydroxybenzoic acid were determined in bee pollens harvested from Rus-sia-Altay Moutains (101.77 mg/100g), Sarı Veliler (501.13 mg/100g), Hadim (114.97 mg/100g), Alanya (80.47 mg/100g) and Niğde-Bor (94.74 mg/100g), respectively (Tab. 2). In addition to these phenolic compounds, all pollens had minor amounts of syringic acid, caffeic acid,
trans-fer-ulic acid, apigenin 7 glucoside, p-coumaric acid,
resveratrol, trans-cinnamic acid, kaempferol
and isorhamnetin. Statistically significant dif-ferences were observed between phenolic compounds and locations. Statistically signifi-cant differences were found among gallic acid, 3,4-dihydroxybenzoic acid, (+)-Catechin, 1,2-di-hydroxybenzene, rutin trihydrate, resveratrol, quercetin (p<0.05) (Tab. 2).
Table 3 shows micro- and macro-elements of pollens. Pollen grains are a significant source of potassium (K), phosphorus (P), calcium (Ca), sulfur (S), magnesium (Mg). Other such minerals as Al, Fe, Na, Zn, Mn, B and Cu were found at
lower levels. In addition, the highest potassium content was observed in pollens collected from Russia-Altay Mountains (6287.39 mg/kg), followed by Konya (Taşkent) (5851.94 mg/kg) and Konya (Hadim) (5834.58 mg/kg), Antalya (Alanya) (5723.87 mg/kg), Russian-Perm Region (5208.03 mg/kg) and Niğde (Bor) (4728.45 mg/ kg). The highest P contents (5009.95 mg/kg) was determined in pollen samples obtained from Russia-Altay Mountains, while pollens collected from Niğde-Bor and Russia-Perm Region had the highest Ca (2424.45 mg/kg) and S (2397.00 mg/kg) contents, respectively (Tab. 3). Sulfur content of pollen changed between 1743.58 mg/kg (Karaman-Sarıveliler) and 2397.00 mg/kg (Russia-Perm Region).
The fatty acid composition of bee pollen oils is shown in Tab. 4. The key fatty acids of pollen samples were palmitic, oleic, linoleic and linolenic. In general, the identified saturated fatty acids included lauric, myristic, palmitic, arachidic and stearic. Of all saturated acids, the palmitic acid contents of pollen samples changed between 10.08% (Russia-Perm Region) and 29.20% (Taşkent). The highest palmitic acid content was found in bee pollen sample collected from Taşkent (29.20%), followed by Konya (Hadim) (22.86%), Hatay (14.20%), Antalya (Alanya) Table 1. Oil content, total phenolic contents, antioxidant activity, carotenoid contents of pollen grains
Locations Oil content (%) Total phenolic content (mg/100g) Antioxidant activity (%) Carotenoid content (mg/g) Konya (Karapınar) 4.83±0.01*c 599.44±0.01c 73.07±0.01d 74.03±0.01c Konya (Taşkent) 3.59±0.02d 677.92±0.01b 63.88±0.01g 67.03±0.03e Konya (Hadim) 3.37±0.02d 652.22±0.01bc 74.41±0.01cd 48.47±0.03f Russia-Altay Mountains 4.53±0.02c 668.19±0.01b 75.41±0.01c 24.11±0.09g Russia-Perm Region 6.85±0.02a 719.58±0.01a 66.35±0.03f 12.78±0.01h Karaman (Sarıveliler) 6.73±0.01a 509.86±0.02c 60.35±0.03fg 98.62±0.02a Hatay 5.21±0.06b 434.17±0.01de 78.78±0.02b 72.34±0.05d Antalya (Alanya) 3.50±0.09d 656.04±0.01bc 81.41±0.02a 40.03±0.07f Niğde(Bor) 4.60±0.03c 499.44±0.04d 70.83±0.02e 81.74±0.09b * mean±standard deviation (n:3);
** Values within each column followed by different letters are significantly different (p<0.05)
J. APIC. SCI. Vol. 63 No. 1 2019
73
Ph en ol ic s Lo ca ti on s Ko ny a (K ar ap ın ar ) Ko ny a (Ta şke nt ) Ko ny a (H ad im ) R us si a-A lt ay mo un tai ns R us si a-Pe rm reg ion K ar am an (S ar ıv elile r) H at ay A nt al ya (A la ny a) Ni ğde (Bo r) Ga lli c a ci d 32. 8 9± 0. 62 * b 22 .0 ±0 .0 3 e 18 .0 9± 0.4 5 f 10 1. 77 ±0 .16 a 29. 26 ±0. 70 c 30. 58 ±0. 6 8 b 25 .2 7± 0. 39 d 11 .7 1± 0. 67 g 6. 17 ±0 .0 8h 3, 4-d ih yd ro xy -be nzo ic a ci d 39. 37 ±0. 8 6 e** 23 .53 ±0 .0 5 f 4 6. 57 ±0. 99 c 53 .2 6± 0. 52 b 28 .1 9± 0.6 2 e 23 .0 0±0 .6 4 f 4 4.4 6± 0.4 8 d 17 .0 9± 0. 56 g 9 4. 74 ±2 .9 9 a (+ )-ca te ch in 8 8. 4 0± 1.5 1 e 93 .93 ±1 .1 4 d 33 7.4 0± 0. 87 a 12 5. 4 8±1 .7 1 b 73. 8 8± 5. 35 f 9 6. 72 ±1 .1 9 c 87 .0 0±0 .5 3 e 92 .9 1± 0. 14 d 66 .7 5± 0.8 4 g 1, 2-di hy dr ox y-ben zen e 34. 72 ±0. 91 g 8. 34 ±0.4 8ı 11 4. 97 ±0. 03 a 39.4 0± 1. 0 6 f 49. 51 ±0. 74 e 28 .8 3± 0. 02h 77 .1 6± 0. 61 b 65 .7 3±1 .6 1 c 5 4. 52 ±0. 39 d Syr in gic a ci d 12 .1 6± 0. 27 e 23 .7 7± 0. 01 a 16 .3 5± 0. 22 c 11 .6 3± 0.4 1 f 19. 73 ±0.4 5 b 10. 55 ±0. 70 f 14 .7 5± 0. 05 d 12 .5 5± 0. 14 e 5. 56 ±0 .0 1 g Caf fe ic a ci d 12 .0 8± 0.4 4 d 6. 63 ±0.4 5 g 14 .0 3± 0. 17 c 7. 93 ±0.4 8 f 5. 8 4± 0. 35h 8. 70 ±0 .5 9 ef 16 .2 4± 0.4 1 b 9. 18 ±0. 37 e 23 .8 6± 0. 63 a Ru ti n t ri hy dr at e 5 4. 50 ±2 .7 3 b 14.4 6± 0. 28 f 11 .2 8± 0. 0 4 g 20.4 6± 0. 0 9 d 41. 8 4± 0. 56 c 9. 82 ±0. 62 h 17. 58 ±0 .2 7 e 8 0.4 7± 0.4 6 a 16 .4 9± 0.4 9 ef p-co um ar ic a ci d 1. 9 0± 0. 0 8 d 2. 0 9± 0. 15 c 10.4 6± 0. 18 a 4.3 3± 0.3 2 b 2. 73 ±0 .1 9 c 1. 39 ±0. 10 de 2. 63 ±0 .2 4 c 4. 0 8± 0.1 9 b 2. 6 8± 0. 27 c Tr an s-fer ul ic aci d 3. 25 ±0 .1 3 g 18 .2 7± 0. 0 6 c 23 .0 1± 0. 93 b 23 .6 8± 0. 37 b 42 .2 4± 0.2 5 a 4. 75 ±0.4 5 f 12 .4 8± 0. 81 d 4. 8 9± 0.4 9 f 5.1 9± 0. 34 e A pi ge ni n 7 gl uco si de 4. 24 ±0 .17 g 8. 23 ±0 .5 5 e 24. 31 ±0.4 1 a 20. 13 ±0. 0 8 c 22 .2 3± 0. 72 b 4. 91 ±0. 16 g 5. 77 ±0. 39 f 10 .76 ±0 .25 d 5. 95 ±0.4 9 f Re sv er at rol 17. 59 ±0 .3 0 e 14. 20 ±0. 28 g 82 .0 2± 0.0 4 a 75 .11 ±0 .1 9 b 15 .7 1± 0. 0 9 f 4. 24 ±0 .2 3h 3. 83± 0. 0 9 ı 36 .1 9± 0. 6 8 c 23 .5 6± 0. 81 d Qu er ce ti n 12 21. 73 ±1. 11 a 15 9. 93 ±1 .0 3 f 6 85. 36 ±0 .6 0 b 14 1. 63 ±0 .3 0 g 19 5.4 0± 0. 0 8 e 61. 23 ±0 .7 6ı 36 2. 03 ±0 .0 1 c 120. 35 ±4. 8 9 h 26 5. 18 ±2 .9 3 d Tr an s-cin na mic aci d 1. 57 ±0 .1 8h 7. 75 ±0 .5 8 e 5. 8 4± 0. 23 g 26 .7 3± 0. 30 c 31 .1 3± 0. 36 b 18 1. 33 ±0 .2 5 a 13 .4 6± 0.4 0 d 6. 07 ±0 .3 0 f 30. 77 ±0. 01 bc N ar in ge nin 5. 9 0± 0. 67 h 8. 96 ±1 .06 g 4 4. 8 4± 0. 01 d 58 .8 4±1 .2 0 b 11 .8 6± 0. 01 f 50 1. 13 ±2 .38 a 41. 78 ±0 .6 4 c 4.4 3± 0. 21 ı 18 .4 8± 0. 52 e Ka em pf er ol 1. 91 ±0. 10 e 19 .2 4± 2. 01 b 2. 8 6± 0. 01 d 39. 37 ±0. 14 a 39. 15 ±0. 8 8 a -*** 19. 9 0± 0. 17 b 4. 9 8± 0. 34 c -Iso rh am ne ti n 2. 21± 0. 0 8h 13 .11 ±0 .6 2 e 3. 26 ±0. 02 g 71 .2 3± 0.4 0 a 59. 74 ±0. 32 b 23 .0 1± 0. 87 c 16 .12 ±0 .3 1 d 17. 83 ±0 .0 1 d 11 .9 7± 0. 15 f *m ea n± st an da rd d ev ia tio n ( n: 3) ; * *V al ue s w it hin e ac h c olu m n f ol lo w ed b y d if fe re nt l et te rs a re s ig ni fic an tly d if fe re nt ( p< 0. 05 );* ** no ni de nti fied Table 2. Phenolic compounds of pollen grains (mg/100g)ÖZcAN et AL.
74
Bioactive properties of bee polen grains
(13.74%) and Niğde (Bor) (13.15%). The highestlauric acid (7.37%) was found in Sarıveliler pollen sample. Oleic acid contents of pollens ranged from 12.66% to 54.35%, and the highest oleic acid amount was found in the pollen from
Karapınar (54.35%). The linoleic and linolenic acid contents of pollen oils changed between 6.27% (Russia-Perm Region) and 25.66% (Alanya) to 2.02% (Alanya) and 24.80% (Hadim), respec-tively (p<0.05) (Tab. 4). In addition to these
Lo ca ti on s Al Mo Ca B Cd Cr Cu Fe Kon ya (K ar ap ın ar ) 63 .1 3± 0.1 2* c 0. 24 ±0 .02 g 21 97. 52 ±5. 0 8 b 3 4. 57 ±0. 0 8 b 0. 0 4± 0. 01 e 0. 8 0 ±0. 5 4 a 11 .5 7± 0. 12 a 9 0. 15 ±0 .1 4 d Ko ny a ( Ta şke nt ) 37. 83 ±0 .3 3 f** 0.4 7± 0. 02 c 16 26 .7 8± 2. 8 0 e 8 .83 ±0. 0 6 i 0. 0 9± 0. 01 d 0. 17 ±0 .02 d 5. 8 9± 0. 07 e 73 .6 0± 0. 12 f Ko ny a ( H ad im ) 55 .7 3±1 .1 0 d 0.4 8± 0. 01 b 21 14. 6 8± 4. 17 c 13 .2 9± 0. 0 8 f 0. 07 ±0. 01 d 0. 38 ±0. 0 4 c 7. 11 ±0 .0 6 c 12 9. 07 ±0. 0 9 a Ru ss ia -A lt ay m ou nt ai ns 47. 51 ±0 .53 e 0.1 6± 0. 02 h 16 55 .13 ±6 .1 9 e 11 .5 4± 0. 0 4 g 0.1 9± 0. 0 4 a -*** 7. 02 ±0 .07 c 6 8 .1 5± 0.1 4 g R us si a-Pe rm Re gi on 12 .0 6± 0.0 7 h 0.4 5± 0. 01 d 19 74.4 6± 4. 8 0 d 39. 97 ±0. 0 8 a 0. 11 ±0. 03 c 0. 13 ±0. 05 e 6. 5 4± 0. 07 d 38 .2 6± 0.0 9 i Ka ram an (S ar ıv eli le r) 8 9. 28 ±0. 6 6 a 0. 0 4± 0. 01 i 16 9 4. 73 ±9. 3 4 e 26. 14 ±0 .0 3 d 0. 0 6± 0. 01 e 0.4 5± 0. 0 6 b 7. 18 ±0 .0 8 c 92 .0 3± 0.0 8 c H at ay 85 .5 8± 0. 67 b 0. 37 ±0. 02 e 21 6 4. 56 ±4. 11 b 27 .1 5± 0. 05 c 0. 0 4± 0. 01 e 0. 87 ±0. 07 a 8.5 0 ±0 .0 9 b 10 3. 63 ±0 .0 9 b A nt al ya ( A la ny a) 27. 26 ±0 .65 g 0. 33 ±0 .03 f 10 21 .9 4± 6.0 0 f 9. 6 8± 0. 0 4 h 0.1 4± 0. 0 4 b 0. 39 ±0 .05 c 6. 69 ±0 .07 d 62 .3 7± 0. 0 8 h Ni ğd e ( B or ) 4 8.5 4± 0. 55 e 0. 5 4± 0. 03 a 24 24 .4 5± 4. 0 8 a 23 .1 4± 0. 0 4 e 0. 0 4± 0. 01 e 0. 13 ±0 .03 e 7. 56 ±0. 0 9 c 8 4. 53 ±0. 0 8 e Lo ca ti on s K Mg Mn N a Ni P P b Zn Kon ya (K ar ap ın ar ) 4 85 4.4 3± 10. 1 d 75 4.4 5± 9. 03 e 22 .5 1±0 .0 8 e 14 1. 59 ±6.0 4 0. 8 4± 0. 0 6 e 41 23. 0 4± 5. 0 0 c -28. 91 ±0 .0 7 f Ko ny a ( Ta şke nt ) 58 51 .9 4± 7. 0 b 11 8 8. 79 ±6 .5 2 a 30.4 3± 0. 0 8 c 61 .9 0 ±0 .1 2 g 0. 58 ±0. 07 f 52 61 .6 3± 7. 03 a 0. 55 ±0. 0 9 c 36 .4 4± 0. 10 d Ko ny a ( H ad im ) 58 3 4. 58±8 .7 b 11 87. 4 4± 5. 50 a 58. 6 6±0 .1 1 a 11 2. 50 ±4 .50 d 2.4 2± 0. 07 a 439 6.4 1± 7. 50 c 0. 31 ±0. 05 d 38.5 2±0 .0 7 c Ru ss ia -A lt ay m ou nt ai ns 62 87 .3 9± 8.5 a 10 25 .3 7± 7. 03 c 38 .2 3± 0.0 9 b 13 3.0 2± 4.0 0 c 1. 63 ±0 .0 9 b 50 0 9. 95 ±7 .0 0 b 0. 6 4± 0. 07 a 42 .4 5± 0. 11 b R us si a-Pe rm Re gi on 52 0 8. 03 ±5 .5 8 c 12 13. 4 6± 5. 50 b 23 .8 7± 0. 07 d 67. 49 ±5 .5 0 f 0. 39 ±0. 07 g 4 49 4. 14 ±9. 21 c 0. 18 ±0. 0 4 f 28 .0 0 ±0 .0 6 f Ka ram an (S ar ıv eli le r) 38 45 .9 6± 9. 83 e 71 2. 83 ±5 .6 2 f 11 .0 6± 0.0 7 g 27 3. 21 ±5. 52 a 0. 31 ±0. 0 6 h 29 47 .20 ±9. 58 e 0. 25 ±0. 05 e 24. 07 ±0. 0 6 h H at ay 42 6 4. 57 ±6 .1 d 72 5. 23 ±6.0 1 e 19. 51 ±0. 0 8 f 13 3. 83 ±5 .5 3 c 0. 85 ±0. 0 4 e 374 4. 29 ±8 .6 1 d 0. 3 4± 0. 0 6 d 16 1. 9 9± 5. 57 a A nt al ya ( A la ny a) 57 23 .8 7± 6.0 b 6 83 .0 3± 6.0 0 g 24. 8 8± 0. 07 d 8 8 .9 1± 3. 0 0 e 1.4 8± 0. 15 c 351 1. 29 ±6 .51 d 0. 6 0 ±0. 0 8 b 29. 91 ±0. 11 g Ni ğd e ( B or ) 472 8 .4 5± 7. 0 4 d 8 8 6. 5 4± 5. 50 d 21. 25 ±0 .0 9 ef 13 3. 9 6± 5. 56 c 0. 9 8± 0. 01 d 4 0 6 0. 67 ±7. 02 c 0. 25 ±0. 0 6 e 33 .17 ±0 .0 9 e *m ea n± st an da rd de vi at io n (n :3 ); ** V al ue s w it hin ea ch co lu m n fo llo w ed by di ff er en t le tt er s ar e sig ni fic an tly di ff er en t (p <0 .0 5) ;* ** no nd et er min ed Table 3. Mineral contents of pollen grains (mg/kg)
J. APIC. SCI. Vol. 63 No. 1 2019
75
fatty acids, pollen samples had minor amounts of lauric, myristic, stearic, arachidic, behenic and arachidonic acids. Statisticaly significiant dif-ferences were not observed among the stearic acid contents of Russian-perm region, Konya (Hadim), Antalya (Alanya), Konya (Karapınar) and Konya (Taşkent) locations (Tab. 4).
DISCUSSION
According to the study by Feas et al. (2012), the phenolic contents of organic bee pollen varied between 12.9 and 19.8 mg GAE/g of extract. In a previous study, the highest polyphenol content had been found in monofloral bee pollen from Table 3. (continued) (mg/kg) Locations S Konya(Karapınar) 2161.09±7.53c Konya (Taşkent) 2061.17±6.01d Konya (Hadim) 2015.51±4.50d Russia-Altay mountains 2162.76±8.51c Russia-Perm Region 2397.00±7.55a Karaman (Sarıveliler) 1743.58±5.50f Hatay 1871.50±7.05e Antalya (Alanya) 1839.72±6.02e Niğde (Bor) 2204.28±6.51b * mean±standard deviation (n:3);
** Values within each column followed by different letters are significantly different (p<0.05)
Fatty acids
Locations Konya
(Karapınar) (Taşkent)Konya (Hadim)Konya Russia-Altaymountains Russia-Permregion (Sarıveliler)Karaman Hatay (Alanya)Antalya Niğde(Bor) Lauric 0.67±0.05*f 0.85±0.01d 0.75±0.02e 1.20±0.03b 0.96±0.01c 7.37±0.06a 0.87±0.02d 0.58±0.04g 1.14±0.05b Myristic 0.28±0.07g** 0.72±0.02f 1.63±0.05c 0.62±0.02f 3.29±0.13a 0.87±0.13e 0.38±0.01g 1.05±0.06d 2.79±0.16b Palmitic 10.40±0.54f 29.20±0.01a 22.86±1.05b 12.53±0.12e 10.08±0.04f 12.83±0.99e 14.20±0.02c 13.74±0.62d 13.15±0.88d Stearic 3.11±0.16c 3.17±0.02c 3.98±0.18c 7.07±0.16a 3.44±0.03c 6.23±0.01b 2.92±0.02d 3.27±0.14c 2.49±0.17d Elaidic 0.83±0.76a -*** - 0.34±0.01b - 0.11±0.01c - - -Oleic 54.35±0.91a 12.66±0.01g 18.77±0.86f 36.27±0.46c 23.30±0.07e 19.38±0.01f 47.23±0.06b 35.94±0.59c 27.05±0.89d Linole-laidic 0.16±0.06c - - - 0.91±0.00b - - - 1.31±0.03a Linoleic 10.22±0.50g 13.74±0.01e 10.27±0.52g 17.05±0.22c 6.27±0.13h 19.59±0.03b 11.83±0.04f 25.66±0.13a 16.78±0.61d Arachidic 0.95±0.02c 0.67±0.02d 1.55±0.06b 0.44±0.01e 0.48±0.00e 0.40±0.01e 1.54±0.02b 0.63±0.05d 2.25±0.16a Linolenic 9.40±0.09f 22.90±0.01b 24.80±0.28a 11.29±0.23e 11.09±0.02e 18.37±0.76d 11.42±0.03e 2.02±0.08g 20.35±0.43c Behenic 0.45±0.05e 0.74±0.01b 0.59±0.01d 0.48±0.02e 2.76±0.01a 0.56±0.09d 0.61±0.01c 0.52±0.11d 0.71±0.04b Arachi-donic 0.38±0.14g 5.09±0.01a 2.06±0.04c 0.40±0.03f 0.82±0.03e 1.08±0.19d 1.11±0.11d 0.47±0.02f 4.27±0.01b * mean±standard deviation (n:3);
** Values within each column followed by different letters are significantly different (p<0.05); *** nonidentified
Table 4. Fatty acid compositions of pollen grain oils (%)
ÖZcAN et AL.
76
Bioactive properties of bee polen grains
Brassica napus subsp. napus L. (1389.67 mgGAE/kg), followed by Papaver somniferum L. bee pollen (817.33 mg GAE/kg) (Fatrcova-Sramkova et al., 2013). Pascoal et al. (2014) determined that the highest and the lowest values of phenolics in eight commercial bee pollens were 32.15 mg/g and 18.55 mg/g, respectively. In another study, the phenolic contents of bee pollens were found to be between 10.5 and
16.8 mg GAE/g (Morais et al., 2011).The total
phenolic contents of pollen grains ranged from 19.28 to 48.90 mg GAE/ g (Carpes et al., 2009). The average polyphenol concentration in fresh samples of ethanol exracts was 21.3 mg GAE/g of extract (Rzepecka-Stojko et al., 2012). In previous studies, this value for this extract was 24.6 mg GAE/g (Kroyer & Hegedus, 2001), 12.4 mg GAE/g (Bonvehi, Torrento, & Lorente, 2001) and 32.4 mg GAE/g (Rzepecka-Stojko et al., 2010), 30.46 mg GAE/g (Carpes et al., 2009). Pollen collected from Alanya demonstrated the highest antioxidant activity in the range of 81.41%. The lowest quantity of antioxi-dants (60.35%) was determined in the pollen collected from Sarıveliler. In an experiment by Kim et al. (2015), the antioxidant activity of pollen provided from Korea ranged from 12.7% to 50.1%. The antioxidant activity of monofloral bee pollens ranged from 0.135 and 2.814 mmol Trolox/g (Marghitas et al., 2009). Another study showed that the antioxidant activity of 25 µg/ mL methanol extracts of pollen samples varied between 86.3 and 90.2% (Negri et al., 2011). Ethanolic bee pollen extracts exhibited high free radical scavenging activity with DPPH inhibition values ranged from 37.95%
(EC50: 641.3 µg/mL) of Rubus extracts and
94.45 (EC50:215.2 µg/mL) of Castanea extracts (Gabriele et al., 2015). Carotenoid contents of pollens were found to be between 12.78 mg/g and 98.62 mg/g. The highest carotenoid content was determined in pollen collected from Sarıveliler (98.62 mg/g), followed by Niğde-Bor (81.74 mg/g) and Karapınar (74.03 mg/g). The content of pollen obtained from the Russia-Altay mountains was minimum with 12.78 mg/g. Sta-tistically significant differences were observed between the flavonoid content of the pollen
depending on the locations (p<0.05). Bee pollen constitutes a natural source of antioxidants such as phenolic acids and flavonoids, which are responsible for its biological activity (Rzepecka-Stojko et al., 2010). In previous studies, pollen grains contained snaringenin, isorhamnetin 3-o-rutinoside, rhamnetin 3-o-neohesperi-doride, isorhamnetin, quercetin 3-o-rutinoside, quercetin 3-o-neohesperidoside, vanillic acid, protocatechuic acid, gallic acid, p-coumaric acid, hesperidin, rutin, apigenin, luteolin, isorham-netin, kaempherol and quercetin (Bonvehi et al., 2001; Han et al., 2012). Fanali et al. (2013) used nano-liquid chromatography for the de-termination of polyphenols in bee pollen, and identified nine polyphenols, namely o-cumaric acid, p-coumaric acid, ferulic acid, myricetin, cinnamic acid, quercetin, naringenin, hesperetin and kaempferol. Different flavonoid such as quercetin, apigenin, isorhamnetin were identified in honey and pollen (Baltrušaitytė et al., 2007; Isidorov et al., 2015).
Pollen grains are a significant source of potassium (K), phosphorus (P), calcium (Ca), sulfur (S), magnesium (Mg), but mineral contents of pollen grains change depending on location. Pollen grains are rich in phosphorus (6923.63 mg/kg), calcium (1031.98 mg/kg), potassium (5116.76 mg/kg), magnesium (754.64 mg/kg), manganese (5116.8 mg/kg) and zinc (50.6 mg/ kg pollen), and and our results showed slight dif-ferences according to those of Carpes et al. (2009). Several other such factors as plant varieties, climatic conditions, moisture and pollen collection time affected bioactive properties of pollen grains.
The kind of bee pollen plays an important role in fatty acid composition and the shelf-life of the product due to polyunsaturated fatty acids. This is because high levels of linoleic and linolenic acid of pollen oils were found. The composition and oil properties of pollen grains depend upon the locations, flora type and such plant growing conditions as climatic factor and soil structure. Loublier et al. (1991) extracted the pollen grains and identified high levels of palmitic, α-linolenic and eicosenoic acids. Saa-Otero et al. (2000) reported that several pollen types contained
J. APIC. SCI. Vol. 63 No. 1 2019
77
14.7 to 31.9% palmitic, 1.1 to 3.8% stearic, 5.3 to 22.7% oleic, 4.9 to 38.0% linoleic and 10.3 to 38.4% linolenic acids. Nicolson & Human (2013) determined 28.70% lauric, 5.20% myristic, 25.95% palmitic, 2.12% stearic, 5.91% oleic,
4.80% linoleic, 19.94% α-linoleinic and 7.38%
eicosenoic acids in stored pollen grains. The list of fatty acids found in the pollen studied here is similar to those identified by Serra-Bonvehi et al. (1987), Loublier et al. (1991), Saa-Otero et al. (2000), Hassan (2011) who reported that palm pollen oil contained 4.82% lauric, 13.33% myristic, 34.45% palmitic, 2.04% stearic, 7.32% arachidic, 7.07% palmitoleic, 7.19% oleic, 14.24%
linoleic and 1.27% ɣ-linolenic, and 4.57%
ara-chidonic acids. Bastos et al., (2004) found oleic, linoleic, and palmitic acids in pollen oil. Pollen samples changed widely in the quantity of individual and total fatty acids with some samples having several times the quantity found in other samples. Generally, the fatty acid com-positions of pollens were significantly affected by location.
As a result, oil contents of pollen grains are low, but total phenol contents are very high. Pollen samples contain different saturated and un-saturated long-chain fatty acids. Antioxidant activity values of pollen were found to be partly similar and varied depending on locations. The content of saturated fatty acid (palmitic) was high (20-30%) in the tested pollen samples but did not exceed the linoleic acid content. Bee pollen grains can be applied as a suitable dietary supplement due to high saturated and unsaturated fatty acids, minerals and phenolic compounds. Very few differences in fatty acid composition were found among pollen types.
ACKNOWLEDGEMENTS
The authors would like to sincerely appreciate the Deanship of Scientific Research at King Saud University for funding this Research group No (RG-1435-049).
REFERENCES
AOAC. (1990). Official Methods of Analysis, 15th
edn. Association of Official Analytical Chemists, Washington, DC.
Ares, A.M., Ayuso, I., Bernal, J.L., Nozal, M.J., Bernal, J. (2016). Trace analysis of sulforaphane in bee pollen and royal jelly by liquid chromatography-tandem mass
spectrometry. Journal of Chromatography B,
1012-1013, 130-136.DOI: 10.1016/j.jchromb.2016.01.028
Baltrušaitytė V., Venskutonis P.R., & Čeksterytė V. (2007). Radical scavenging activity of different floral origin honey and beebread phenolic extracts. Food Chemistry, 101, 502-514. https://doi.org/10.1016/j. foodchem.2006.02.007
Basim, E., Basim, H., & Özcan, M. (2006). Antibacte-rial activities of Turkish pollen and propolis extracts against plant bacterial pathogens. Journal of Food Engineering, 77, 992-996. DOI: 10.1016/j.jfood-eng.2005.08.027
Bastos, D.H.M., Barth, M.O., Rocha, C.I., Cunha, I.B.S., Carvalho, P.O., Torres, E.A.S., Michelan, M. (2004). Fatty acid composition and palynological analysis of bee (Apis) pollen loads in the states of Sao Paulo and Minas Gerais, Brazil. Journal of Apicululture Re-search, 43(2), 35-39. https://doi.org/10.1080/00218 839.2004.11101107
Bonvehi, J.S., Torrento, M.S., & Lorente, E.C. (2001). Evaluation of polyphenolic and flavonoid com-pounds in honeybee-collected pollen produced in Spain. Journal of Agriculture and Food Chemistry, 49, 1848-1853. DOI: 10.1021/jf0012300
Campos, M.G., Webby, R.F., Markham, K.R., Mitchell, K.A., Cunha, A.P. (2003). Age-induced diminution of free radical scavenging capacity in be pollens and
the contribution of constituent flavonoids. Journal
of Agriculture and Food Chemistry, 51, 742-745. DOI: 10.1021/jf0206466
Carpes, S.T., Mourao, G.B., Alencar, S.M., & Masson, M.L. (2009). Chemical composition and free radical scavenging activity of Apis mellifera bee pollen from Southern Brazil. Brazilian Journal of Food Technology, 12, 220-229. DOI: 10.4260/BJFT2009800900016
ÖZcAN et AL.
78
Bioactive properties of bee polen grains
Chantarudee, A., Phuwapraisirisan, P., Kimura, K.,Okuyama, M., Mori, H., Kimura, A., Chanchao, C. (2012). Chemical constituents and free radical scavenging activity of corn pollen collected from Apis mellifera hives compared to floral corn pollen at Nan, Thai-land. BMC Complementary and Alternative Medicine, 12, 45-56.DOI: org/10.1186/1472-6882-12-45 Fanali, C., Dugo, L., & Rocco, A. (2013). Nano-liquid chromatography in nutraceutical analysis: Deter-mination of polyphenols in bee pollen. Journal of Chromatography A, 1313, 270-274. DOI: 10.1016/j. chroma.2013.06.055
Fatrcova-Sramkova, K., Nozkova, J., Kacaniova, M., Mariassyova, M., Rovna, K., Stricik, M. (2013). An-tioxidant and antimicrobial properties of
mono-floral bee pollen. Journal of Environmental
Sci-ence and Health, Part B, 48(2), 133-138. DOI: 10.1080/03601234.2013.727664
Feás, X., Vázquez-Tato, M.P., Estevinho, L., Seijas, J.A., Iglesias, A. (2012). Organic bee pollen: botanical origin, nutritional value, bioactive compounds, antioxidant activity and microbiological quality. Molecules, 17(7), 8359-8377. DOI: 10.3390/molecules17078359 Gabriele, M., Parri, E., Felicioli, A., Sagona, S., Pozzo, L., Biondi, C., Domenici, V., Pucci, L. (2015). Phytochemi-cal composition and antioxidant activity of Tuscan bee pollen of different botanic origins. Italian Jour-nal of Food Science, 27(2), 248-259. DOI: https://doi. org/10.14674/1120-1770/ijfs.v191
Garcia, M., Perez-Arquillue, C., Juan, T., Juan, M.I., Herrera, A. (2001). Note: Pollen analysis and
an-tibacterial activity of Spanish honeys. Food
Sci-ence Technology International, 7, 155-158. DOI: 10.1177/108201301772660330
Han, L., Liu, X., Yang, N., Li, J., Cai, B., Cheng, S. (2012). Simultaneous chromatographic finger printing and quantitative anlaysis of flavonoids in pollen typhae by high-performance capillary electrophoresis. Acta Pharmaceutica Sinica B, 2, 602-609. DOI:10.1016/j. apsb.2012.10.003
Hassan, H.M.M. (2011). Chemical comosition and
nu-tritional value of palm pollen grains. Global Journal of Biotechnology and Biochemistry, 6(1), 1-7.
Isidorov, V.A., Bagan, R., Bakier, S., & Święcicka, I., (2015). Chemical composition and antimicrobial
activity of Polish herbhoney. Food Chemistry, 171,
84–88.DOI: 10.1016/j.foodchem.2014.08.112
ISO-International Organization for Standardization. (1978). Animal and vegetable fats and oils prepera-tion of methyl esters of fatty acids, ISO. Geneve, Method ISO 5509, 1-6.
Kim, S.B., Jo, Y.H., Liu, Q., Ahn, J.H., Hong, I.P., Han, S.M., Hwang, B.Y., Lee, M.K. (2015). Optimization of extrac-tion condiextrac-tion of bee pollen using response surface methodology: Correlation between anti-melano-genesis, antioxidant activity, and phenolic content. Molecules, 20(11), 19764-19774. DOI: 10.3390/mol-ecules201119656
Kroyer, G., & Hegedus, N. (2001). Evaluation of bio-active properties of pollen extracts as functional dietary food supplement. Innovative Food Science Emerging Technology, 2, 171-174. DOI: 10.1016/ S1466-8564(01)00039-X
Lee, S.K., Mbwambo, Z.H., Chung, H.S., Luyengi, L., Games, E.J.C., Mehta, R.G. (1998). Evaluation of the antioxidant potential of natural products. Combina-torial Chemistry & High Throughput Screening, 1, 35-46.
Loublier, Y., Ducruet, V., Pham-Delegue, M.H., Douault, P., Vear, F., Degas, C., Masson, C., (1991). The pollen as an attraction parameter for pollinators to sunflower (Helianthus annuus L.). Acta Horticulture, 288, 394-398. DOI: 10.17660/Acta Hortic.1991.288.66 Marghitas, L.A., Stanciu, O.G., Dezmirean, D.S., Bobis, O., Popescu, O., Bogdanov, S., Campos, M.G. (2009). In vitro antioxidant capacity of honey bee-collected pollen of selected floral origin harvested from Roma-nia. Food Chemistry, 115(3), 878-883. DOI: 10.1016/j. foodchem.2009.01.014
Morais, M., Moreira, L., Feas, X., & Estevinho, L.M. (2011). Honeybee-collected pollen from five
Portu-J. APIC. SCI. Vol. 63 No. 1 2019
79
guese Natural Parks: palynological origin, phenolic content, antioxidant properties and antimicrobial activity. Food and Chemical Toxicology, 49(5), 1096-1101. DOI: 10.1016/j.fct.2011.01.020
Negri, G., Teixeira, E.W., Alves, M.L.T.M.F., Moretti, A.C.C., Otsuk, I.P., Borguini, R.G., Salatino, A. (2011). Hydroxycinnamic acid amide derivatives, phenolic compounds and antioxidant activities of extracts of pollen samples from Southeast Brazil. Journal of Agriculture and Food Chemistry, 59(10), 5516-5522. DOI: 10.1021/jf200602k
Nicolson, S.W., & Human, H. (2013). Chemical compo-sition of the ‘low quality’ pollen of sunflower (He-lianthus annuus, Asteraceae). Apidologie, 44, 144-152. DOI: 10.1007/s13592-012-0166-5
Pascoal, A., Rodrigues, S., Teixeira, A., Feás, X., Este-vinho, L.M. (2014). Biological activities of commercial bee pollens: Antimicrobial, antimutagenic, antioxi-dant and anti- inflammatory. Food and Chemical Tox-icology, 63, 233-239. DOI: 10.1016/j.fct.2013.11.010 Püskülcü, H., & Ikiz, F. (1989). Introdiction to Statis-tic. Bilgehan Presss, p 333, Bornova, Izmir, Turkey (in Turkish).
Rzepecka-Stojko, A., Maciejewska-Paszek, I., Stec, M., Kurzeja, E., Keska, A., Pawlowska-Goral, K. (2010). The influence of extraction method on obtaining polyphenolic compounds from bee pollen. Farmako-logiczny Przegląd Naukowy, 1, 38.
Rzepecka-Stojko, A., Stec, M., Kurzeja, E., Gawrońska, E., Pawłowska-Góral, K. (2012). The effect of storage of bee pollen extract on polyphenol content. Polish Journal of Environment Studies, 21(4), 1007-1011. Saa-Otero, M.P., Díaz-Losada, E., & Fernández-Gómez, E. (2000). Analysis of fatty acids, proteins and ethereal extract in honeybee pollen - Consider-ations of their floral origin. Grana, 39, 175-181. DOI: 0.1080/00173130051084287
Seppanen, T., Laakso, I., Wojcicki, J., & Samochowiec, L. (1989). An analytical study on fatty acids in pol-len extract. Phytotherapy Research, 3, 115-116. DOI:
10.1002/ptr.2650030311
Serra Bonvehi, J., Soliva Torrentó, M., & Centelles Lorente, E. (2001). Evaluation of polyphenolic com-pounds in honeybee-collected pollen produced in Spain. Journal of Agriculture and Food Chemistry 49, 1848-1853. DOI: 10.1021/jf0012300
Silva da Rocha, A., Rocha, E.K., Alves, L.M., Amaral de Moraes, B., Carvalho de Castro, T., Albarello, N., Si-moes-Gurgel, C. (2015). Production and optimization through elicitation of carotenoid pigments in the in vitro cultures of Cleome rosea Vahl (Cleomaceae). Journal of Plant Biochemistry and Biotechnology, 24, 105-113. DOI: 10.1007/s13562-013-0241-7
Skujins, S. (1998). Handbook for ICP-AES (Varıan-Vista). A hort Guide To Vista Series ICP AES Opera-tion. Varian Int. AG Zug.Version 1.0. pp 29. Switzer-land.
Wójcicki, J., Samochowiec, L., Bartłomowicz, B., Hinek, A., Jaworska, M., Gawrońska-Szklarz, B. (1986). Effect of pollen extract on the development of experimen-tal atherosclerosis in rabbits. Atherosclerosis, 62, 39-45. DOI: 10.1016/0021-9150(86)90017-1
Yoo, K.M., Lee, K.W., Park, J.B., Lee, H.J., Hwang, I.K. (2004). Variation in major and total antioxidant ac-tivity of Yuzu (Citrus junos SiebexTanaka) during
maturation and between cultivars. Journal of
Agri-culture and Food Chemistry, 52, 5907-5913. DOI: 10.1021/jf0498158