■Г' , , ^ ;·<.*
І - . Т ' · і і · ■ ' I r , 'y'r''^.;’5K.1rif г*!| <■■'■<': г ■ ;К Jÿ‘ İSI г - ѵ З - . у . ^ . ѵ ws —'ѵ. ií Í . . I.· -1 . / . U Г с '-.V У . s f J I. щ ; f » і
■ “ r*C'· VQ
AGGREGATE PRODUCTION PLANNING AN APPLICATION IN OZKAŞIKÇI FLOUR MILL
A THESIS
SUBMITTED TO THE DEPARTMENT OF MANAGEMENT AND
THE GRADUATE SCHOOL OF BUSINESS ADMINISTRATION OF
BILKENT UNIVERSITY
IN PARTIAL FULLFILLMENT OF THE REQUIREMENTS FOR THE DEGREE OF
MASTER OF BUSINESS ADMINISTRATION
Ύ5
\ J S
. с гн
I39C
I certify that I have read this thesis and in my opinion it is fully adequate, in scope and in quality, as a thesis for the degree of Master of Business Administration.
1-A
Dr.Erdal EREL
I certify that I have read this thesis and in my opinion it is fully adequate, in scope and in quality, as a thesis for the degree of Master of Business Administration.
Dr.Erol ÇAKMAK
I certify that I have read this thesis and in my opinion it is fully adequate, in scope and in quality, as a thesis for the degree of Master of Business Administration.
ABSTRACT
AGGREGATE PRODUCTION PLANNING AN APPLICATION IN OZKA^IKCI FLOUR MILL
BY
ÇAGAN ALPAS
M.B.A. THESIS
BILKENT UNIVERSITY - ANKARA JULY, 1996
Supervisor : Dr.Erdal EREL
Aggregate planning is medium-range capacity planning that typically covers a time horizon of anywhere from 3 months to 18 months. The goal of aggregate planning is to achieve a feasible production plan that will effectively utilize the organization’s resources to satisfy expected demand.
In this study. Aggregate Production Planning is applied to 0zka?ik9i Flour Mill in order to maximize the total profit by using the optimal allocation of export and domestic sales to the plant capacity. A nonlinear programming (NP) model is developed and the proposed model is run on GAMS (General Algebraic Modeling System) software package. Alternative scenarios are applied to the model in order to find optimal allocation of export and domestic production and to maximize the total profit.
ÖZET
GENEL ÜRETİM PLANLAMASI
ÖZKAŞIKÇI UN FABRİKASINDA UYGULAMA
HAZIRLAYAN ÇAĞAN ALPAS
İŞLETME YÜKSEK LİSANS TEZİ BİLKENT ÜNİVERSİTESİ - ANKARA
TEMMUZ, 1996
Tez Yöneticisi : Dr.Erdal EREL
Genel Üretim Planlaması orta dereceli kapasite planlaması olup, 3 ila 18 aylık zaman dilimini kapsar. Genel Üretim Planlamasının amacı mümkün olan üretim planlamasını, firmanın kaynaklarını en iyi şekilde kullanarak başarmak ve beklenen talebi karşılamaktır.
Bu çalışmada Özkaşıkçı Un Fabrikasına Genel Üretim Planlaması uygulanmıştır. Amaç iç piyasa ve ihracat satış dağılımının fabrika kapasitesine optimum şekilde yapılarak toplam karı arttırmaktır. Doğrusal olmayan programlama modeli geliştirilmiş ve önerilen model GAMS (General Algebraic Modeling System) paket programı kullanılarak
I gratefiilly acknowledge the encouragement, guidance, advise and friendly supervision of Prof Dr. Erdal Erel during the preparation of this thesis.
I would like to extend my best regards to Dr.Erol Çakmak for his sincere support and providing invaluable knowledge during this study.
Finally, I would like to express my gratitude to my girl friend İdil Aras, my sister and my mother for their endless and continious support not only during the thesis work, but throughout my MBA education.
ACKNOWLEDGMENTS
TABLE OF CONTENTS
ABSTRACT...1
Ö ZET... ii
ACKNOWLEDGMENTS...iii
LIST OF SYMBOLS AND PARAMETERS... vi
LIST OF TABLES AND FIGURES... viii
CHAPTER 1. INTRODUCTION... I CHAPTER 2. LITERATURE SURVEY... 4
2.1. Linear Decision R ule...5
2.2. Linear Programming...6
2.3. Management Coefficients M odel...7
2.4. Goal Programming...7
2.5. Parametric Production Planning...8
2.6. Search Decision R ule...8
2.7. Nonlinear Programming... 8
CHAPTER 3. GENERAL INFORMATION ABOUT THE WFIEAT AND FLOUR MARKET IN TURKEY AND ÖZKAŞIKÇI FLOUR MILL... 10
3.1. Flour market in Turkey...10
3.2. Flour consumption in Turkey... 11
3.3. Why Turkey became an importer of wheat ? ... 13
3 .4. Factors affecting the importation of wheat... 14
3.5. How flour is milled ? ... 15
3.6. Description of özkaşıkçı Flour M ill...16
3.6.1. Brief history of özkaşıkçı Flour M ill... 16
3.6.2. Organizational structure of Özkaşıkçı Flour M ill... 16
CHAPTER 4. MODEL BUILDING... 23
4.1. Raw material balance for export and domestic purposes... 23
4.2. Flour and by-product quantities for export and domestic purposes...24
4.3. Demand for export and domestic sales... 24
4.4. Capacity constraint... 26
4.5. Balance of production quantities... 27
4.6. Wheat costs for export and domestic purposes... 28
4.7. Unit production cost... 30
4.8. Cost function for domestic and export flour production purposes...34
4.9. Price determination for export and domestic market purposes... 35
4.10. Holding cost of domestic products and raw materials...36
4.11. Penalty cost of Domestic Products... 37
4.12. Total revenue...38
4.13. Objective function... 38
CHAPTER 5. RESULTS AND DISCUSSIONS... 41
5.1. Scenario 1 ... 41 5.2. Scenario 2 ... 44 5.3. Scenario 3 ... 47 CHAPTER 6. CONCLUSION...50 6.1. Managerial Implications... 50 6.2. Recommendations...51 REFERENCES... .52
LIST OF SYMBOLS
FD(n) FE(n) XEP(n) XDP(n)
Production quantity for domestic sales in month n, in mton. Production quantity for export sales in month n , in mton.
Amount of wheat needed for export purpose production in month n, in mton
Amount of wheat needed for domestic purpose production in month n, in mton XE(n) XD(n) BY(n) SEC(n) YE(n) YD(n) DI(n)
Amount of purchased wheat for export purposes in month n , in mton Amount of purchased wheat for domestic purposes in month n , in mton Bran and razmol quantity obtained after milling in month n , in mton Flour 2 obtained after milling in month n, in mton
Export flour demand from foreign markets in month n, in mton Domestic demand for flour in month n , in mton
Amount of flour for domestic market carried from month n to n+1 in mton
WDI(n) WEI(n)
Amount of wheat for domestic market carried from month n to n+1 in mton
Amount of wheat for export market carried from month n to n+1 in mton
PC(n) CFE(n) CFD(n)
Production cost in USD/mton
Unit cost of export flour in USD/mton Unit cost of domestic flour in USD/mton
HC(n) Holding Cost of Domestic Products in USD
PenC(n) Penalty cost for term of 45 days in domestic market in USD REV(n) Total revenue in month n, in USD
Z Total Profitin USD
CWE(n) Unit cost of wheat for export production in USD/mton CWD(n) Unit cost of wheat for domestic production in USD/mton HCEW(n) Holding cost of wheat that will be used for export purpose in
USD/mton.
HCDW(n) Holding cost of wheat that will be used for domestic purpose in USD/mton. LIST OF PARAMETERS PBY PSEC DOL CIF PD PE
Price of Bran and Razmol in USD Price of Flour 2 in USD
Dollar rate in TL
CIF price of wheat on the board of the vessel in USD/mton Selling price of flour in domestic market in USD/mton Selling price of flour in export market in USD/mton
Table 3.1 :Milling capacity in Turkey... 12
Table 3.2 forecasted flour consumption for 1996... 12
Table 3.3 :0zka§ik9i’s existing products and their uses... 21
Table 3.4 :1993 Domestic sales...21
Table 3.5 ; 1994 Domestic sales... 21
Table 3.6 ; 1995 Domestic sales... 22
Table 3.7 ; Customer Types...22
Table 4.1 : Domestic and Export Sales Figures (1991-1995)... 25
Table 4.2 : Forecasted 1996 Budget... 32
Table 5.1: Existing values...41
Table 5.2 : The results of Scenario 1... 42
Table 5.3 : Comparison of Scenario 2 and 3... 49
LIST OF FIGURES Figure 3.1: Organizational Structure of Ozka^ikfi Flour M ill...18
Figure 5.1 : Total Profit vs Domestic Demand (Scenario2)...45
Figure 5.2 : Total Profit vs Export Demand (Scenario2)...45 LIST OF TABLES
CHAPTER 1
INTRODUCTION
Aggregate plans are directed toward the achivement of two principal goals: (1) providing enough production capacity to satisfy forecasted market demand and to provide some flexibilitiy so that customer needs can be met and (2) keeping production costs low. Although other objectives may be important, both satisfied customers and low production costs are absolutely necessary for the survival and success of systems of production (Gaither, 1980).
Planners try to determine the best way to meet forecasted product demand by adjusting production rates, work force levels, inventory levels, overtime work, subcontracting rates, and other controlable variables (Stair, 1980).
In this study, aggregate production planning is applied to a company which produces wheat flour for both domestic and export markets. The period of one year is divided into twelve equal intervals (months), and for each interval unit cost of products (export, domestic) are determined. The goal is to maximize the total profit.
There are several methods to solve the aggregate production planning problem. The basic ones are Linear Decision Rule, Managements Coefficients Model, Linear Programming, Parametric Production Planning, Search Decision Rule, Production Switching Heuristics and Nonlinear Programming. The second chapter explains these alternative methods. When the problem is defined, one of the alternatives namely NL programming, will be selected for application.
In Chapter 3, general information about the wheat and flour market in Turkey is presented. Wheat and flour consumption in Turkey and the current government policy on them are explained. The reasons and the advantages of the importation of wheat for flour producers and wheat traders are discussed. Production procedure of wheat flour is described. At the end of the chapter, description o f Ozka^ikfi Flour Mill is added.
In chapter 4, nonlinear programming is discussed and justified as the most appropriate method for this aggregate production planning problem. Accordingly, the NP model is constructed and the underlying assumptions are explained. In order to maximize the total profit, the required data are determined, collected and processed in the constraints. The package program GAMS (General Algebraic Modehng System) is chosen for solving the NP problem.
In Chapter 5, the solution of GAMS is demonstrated. Alternative scenarios are applied to the model in order to find the optimal allocation and to maximize the total profit.
In the final chapter, the results of the analysis are compared with the total profit of the existing situation. Also, the conclusions of the study are presented.
CHAPTER 2
LITERATURE SURVEY
Recognition of the widespread existence of aggregate planning problem has led to the publication of a number of different aproaches. In this chapter, these aproaches are analyzed in order to select the most appropriate one for this study.
An early approach that has become a standard for comparison is the Linear Decision Rule (LDR) (Holt et al., 1955). A linear programming approach (LP) has been advanced (Hansmann et al., 1960).
Extensions to the LP approach have included a tranportation formulation (Bowman, 1956) and, more recently, goal programming formulations proposed (Lee and Moore, 1974) and (Goodman, 1976). Elmaleh and Eilon (1974) have suggested a switching procedure to be used in industries in which production is limited to discrete levels. Other approaches which have been presented include the management coefficients model (MCM) developed (Bowman, 1963), Parametric Production Planning (Jones, 1967) and
Holt, Modigliani, Muth and Simon of the Carnegie Institute of Technology developed the linear decision rules (Holt et al, 1955). LDR develops a single quadratic mathematical cost function for a particular production system that includes these costs - regular payroll, hiring, layoff, overtime inventory carrying, back order or shortage, and set up. This composite mathematical cost function covers each time period in the planning horizon and includes two principal decision variables - the number of units of output to be produced and the size of work force in each time period.
The quadratic composite mathematical cost function is differentiated by calculus methods to yield two linear mathematical fimctions, one is used to compute the number of units to produce during the next time period and the other is used to compute the work size during the next time period. These two linear equations are typically used at the beginning of each period to plan the forthcoming production capacity and work force size, thus the number of workers to be hired or laid off, number of overtime hours required, expected fluctuations in inventories, and machine changeovers can all be deducted (Gaither, 1980).
LP models are methods for obtaining optimum solutions to problems involving the allocation of scarce resources in terms of cost minimization or profit maximization with linear constraints and objective function.
In terms of aggregate planning, the goal would usually be to minimize the sum of costs reletad to regular labor time, overtime, subcontracting, inventory holding costs, and costs associated with changing the size of the work size. Constraints involve capacities of work force, inventories, and subcontracting.
E.H.Bowman (1963) proposed formulating the problem in terms of a transportation-type programming model as a way to obtain aggregate plans that would match capacities with demand requirements and minimize costs. In order to use this approach, planners must identify capacity (supply) of regular time, overtime, subcontracting, and inventory on a period-by-period basis as well as related costs of each variable.
The main limitations of LP models are the assumptions of linear relationships among variables, the inability to continously adjust output rates, and the need to specify a single objective (e.g., to minimize costs) instead of using multiple objectives (e.g., to minimize costs while stabilizing the work force) (Stevenson, 1986).
2.3.Maiiageinent Coefficients Model (MCM):
The management coeffients model is a capacity planning technique that results in heuristics - usefel guides to action. The basic assumption underlying this approach is that managers develop capacity plans in practice by using complex criteria and intuition. This technique uses the historical data surrounding a manager’s past capacity planning decisions and develops a predictive regression equation to be used to formulate future capacity plans.
This approach to capacity planning does not try to explain why managers make certain capacity planning decisions, given that certain market and operations conditions are present. It only attemps to describe the decision processes of indiviual managers. Although there is some evidence that the technique performs quite well under some circumstances, numerous obstacles to its widespread use exist (Bowman, 1963). Chief among these weaknesses is the dependence of the technique on the individual expertise of analysts to effectively build a regression model that reflects a manager’s decision - making behaviour (Gaither,1980).
2.4.GoaI Programming (GP):
Goal programming is a variation of LP that permits the user to specify multiple goals in a priority-based way. The solution represents an attempt to optimize the goals according to priorities. Several applications of goal programming to aggregate planning have been reported in the literature (Ignizio,1985).
2.5.Parametric Production Planning (PPP);
This approach, developed by C.H.Jones (1967) also employs a search procedure to determine the coefficients for decison rules for production rate and work force. Production and work force equations which are similar to the LDR are established. This approach can be applied to most cost functions.
2.6.Searcli Decision R u le:
The search decision rule, developed by W.H.Taubert (1960), is a pattern search algorithm that tries to find the minimum cost combination of various work force and production levels. A computer is needed to make thousands of systematic searches for points that produce a cost reduction. Search rules such as this do not yield optimal solution, but are flexible enough to be used on any type of cost function. Because of this adaptability to the real world, the search decision rule is a widely used heuristic.
2.7.NonUncar Programming (NP):
The very first approach to Nonlinear Programming (Ignizio, 1963) was based on the modification of existing, pattern search methods (Hooke and Jeeves, 1961). Specifically, the “pattern search” method of Hooke and Jeeves (1961) was converted into an algorithm and code for nonlinear programming.
In most cases, the key change to the conventional code is the simple replacement of the scalar objective function, with the achievement vector. Modification of most search algorithms to accomodate the resulting evaluation of the achievement vector is typically a minor procedure.
Of the classical algorithms converted, the best results, by far, have been achieved with algorithms based upon ;
• pattern search (Hooke and Jeeves, 1961), •th e Gifffith / Stewart technique (1961), and
•generalized reduced gradient methods (Lasdon, 1970)
The results accomplished with the modified pattern search method for NP (Draus et al., 1977; Ignizio, 1963, 1976a, 1979b, 1981b; McCammon and Thompson, 1980; Ng,1981) have been particularly impressive. Engineering design problems (e.g., phased arrays, transducer design) with thousands of variables and hundreds of rows are routinely solved with the latest versions of NP/PS (i.e., nonlinear programming via modified pattern search).
CHAPTER 3
GENERAL INFORMATION
ABOUT THE WHEAT AND FLOUR MARKET IN TUIUKEY
AND
OZKA§IKCI FLOUR MILL
3.1.Flour Market in Turkey :
Wheat has a great importance in the nutrition of the world population. Turkey, with its 200 kgs/year per capita consumption, being in the first places among the countries in which nutrition is based primarily on wheat. In the market consumption, bakery products like bread, macaroni and biscuit are taking the biggest share. Flour, which is used in the bakeries as intermediate product, is milled in the factories with different sizes, all around the country.
In Turkey grain is produced by individual farmers and sold to traders, mills and Turkish Grain Board (TGB) at the open market conditions. Market is effected and ruled (in a way) by the declaration of the supporting prices by TGB on the basis of government policy at the current year. Supporting prices contain some government subsidy and prices are generally higher than the international markets, and grain importations are restricted by high import taxes for the local consumption purposes. For the millers who export wheat flour, these restrictions are not valid, and within 9 months after importing wheat, an aggreed amount (for example; 72 % extraction) of flour has to be exported.
3.2.Flour Consumption in Turkey :
When it comes to the flour consumption in Turkey, a rough calculation from the milling capacities (Table 3.1) can be made, however idle capacity assumptions are not reliable. So another way to calculate the consumption is to take per capita consumption of 200 kg/year (wheat) into consideration. This figure changes according to different sources. So, from per capita consumption one can calculate total flour consumption as approximately 9.500.000 mtons for 1996. Total consumption is seperated regionally by depending on the population density (Table 3.2). It can be stated that the increase in the wheat flour consumption for 1996 can be calculated as follows;
T/VliLE3.1 : MILLING CAI’ACITY IN TURKEY
REGION
NUMBER OF DAILY YEARLY
FACTORIES Ci\PACITY CAFACH Y
MARMARA 176 14,174 4,252,200
AEGEAN 77 6,324 1,897,200
BLACK SEA 97 8,068 2,420,400
MID.ANATOLIA 215 19,166 5.749,400
EAST ANATOLIA 37 3,427 1,028,100
SOUTH EAST ANATOLIA 62 5,177 1.553,100
MEDITERRANEAN 54 3,930 1,179,000
TOTAL 718 60,266 18,079,400
Source : 5 Years Plan - Flour Industry Report Turldsh Millers Association
FABLE 3.2 : FORECASTED IXOUR CONSUMPTION FOR 1996
Ri'-GION TONS % MARMARA 2,092,850 22.03 AEGEAN 1,471,550 15.49 BLACK SEA 1,376,550 14.49 MID.ANATOLIA 1,802.150 18.97 EAST ANATOLIA 1,154,250 12.15
SOUTH EAST ANATOLIA 570,950 6.01
MEDITERRANEAN 1,031,700 10.86
TOTAL 9^00,000 100
Source : 5 Years Plan - Flour Industry Report Turkish Millers Association
65.000.000 * 2% = 1.300.000 population increase
1.300.000 * 200(kg/year) = 260.000 mtons consumption increase
3.3.Why Turkey became an importer of wheat ?
For the past two years, decrease in the cultivated regions by i) inheritable division, ii) insufficient rains in the region, iii) the increase in the price of equipments, fertilizer and seed due to high inflation rate, iv) insufficent agricultural defense, v) unconscious seed generation (although the seed replacement period is 2 years in Europe, time period varies between 10 years to 20 years in Turkey) and vi) untrained farmers who have low technical and agricultural knowledge forced the millers and traders to import wheat and Turkey became an importer of wheat. In 1995, Turkey’s wheat production was 13.5 million tons. This figure has reached 14.5 million tons by the need of 1 million tons for seed wheat. If the wheat consumption figures of Turkey is taken into consideration, it can be said that net import was around 1 million tons.
^ Increase in the population and consumption :
Wheat import brings some advantages to importers like; (1) Financial; the value of imported wheat can be transfered 90 days after the receivement of commodity by adding some amount of interest or using different types of credit systems like General Sales Manager (GSM), (2) Import wheat is generally used in any percentage to upgrade the quality of wheat mbcture and flour in domestic market. There is an importation agreement between the importer firm and exporter firm, so that the specifications may not be lower than the specifications written on the contract, (3) Treasury and Foreign Trade Undersecretary (TFTU) gives a permission to millers to import wheat without paying custom tax, value added tax (VAT) and bank-insurance-dealing tax (BIDT) for 9 months. Within this period, importer millers are free to use this wheat in domestic or export market but have to export 72% of these imported wheat amount. (For example; if TFTU gives a permission for the import of 25.000 mton wheat, the firm has to export 18.000 mton wheat flour in order to carry out its obligations in 9 months) Millers are able to be the owner of 25.000 mton of homogeneous wheat from the lower price, (4) Turkey has a good position in the export of wheat flour (3rd place in the world), biscuit and macaroni (World Grain, 1996). To keep its quality position on top, minimum requirement of import wheat is around 500-600.000 mtons.
Wheat coming from different regions across the world, is sent to laboratories for quality testing. Food technicians inspect and classify wheat in order to define and store according to its specifications. Then, wheat is automatically sent to its bin. Iron and steel articles are seperated by Magnetic Seperator; also coarse materails are removed in Drum Sieves. After the first cleaning, wheat is seperated into bins according to its laboratory results.
Different types of wheat can be blended by any percentage. Beaters in screen cylinder scour off impurities and roughage. Then stones, sticks and fine materials are removed through screen in air channels by seperators. With the Stone Seperators, stones are removed from wheat due to gyratory motion and air cushion. Cockle and broken wheat are seperated through air chaimel. Breaks and reducing rolls grind wheat into flour. The ground wheat is carried through the pheunomatic cyclones and there it seperates protein rich flour. The ground wheat is sifted through successive screens of increasing fineness by sifters. Air currents and sieves separate bran and classify particles, middling or semolina. Finally, flour left on the bran is seperated by bran pohsher.
3.5.HOW flour is milled ?
3.6.Dcscription of Ozka^ik^i Flour M ill:
In this section, the study is going to present the brief history, organizational structure, customer relations and existing status of Ozka^ik^i Flour Mill.
3.6.1 .Brief history of 6zka$ik(:i Flour M ill:
Ozka§ik9i Flour Mill was founded as Bulkon Food Industry and Trading Inc. in 1957 in Ankara, Turkey. At that time, daily capacity of Ozka^ikfi was 40 mton. Due to the increasing demand of customers, the mill was renewed in 1975 to a production capacity of 90 mton a day and 300 mton in 1977.
Ozka^ikfi has started to construct the 21st century mill which is about to be completed. With its 1.050 mton daily capacity, it will be the biggest and the most modern mill in Turkey and in the Middle East.
Ozka§ik9i products are not only consumed in Turkey but also in Middle East and North African countries. Between years of 1992 and 1995, Ozka§ik9i has exported over 100.000 mton of wheat flour. Quality of 0zka§ik9i products comply with all national and international standarts.
3.6.2. Organizational Structure of Ozka$ik9i Flour M ill:
Since all the firms in this industry are family owned and managed, the success of the firm depends highly on the skills of the family members. Огка§ік9і has already proven that it has a capable and visionary leader who exemplified the company in terms of name, profitability, and investments.
Even though leadership is not in the hands of a single leader, the general manager who is also the biggest shareholder of the company handles the leadership by himself because this is a comparetively small company. It is fortunate that he is a capable leader.
Flexibility of the organization is important specially in environments similar to those in Turkey where uncertainty is very high. Since the influence of the general manager is very high in 0zka§ik9i, the flexibility of that person is reflected as the flexibility of the company.
The organization chart (Figure 3.1) summarizes a number of activities and relationships within organization. Defined on the chart are the primary organizational activities of 0zka§ik9i Flour Mill such as; finance, marketing, manufacturing and purchasing.
Ozka§ik9i has functional structure in which employees are grouped together according to similar tasks and resources. All employees who perform similar tasks are located in the same group. Dedication is crucial for key employees. In Ozka§ik9i, dedication is high especially for the blue collar workers.
0zka§ik9i Flour Mill runs two shifts. At the moment, overtime is not used. Estimation of the number of personnel in Sincan plant is based on the level of automation (control) of the mills and experience. By a further automation of wheat silo, there will be a considerable decrease in co-operators.
э о о Uh va лс N О о О) о □ со "(δ с о
Information system in 0zka§ik9i makes data available up and down the hierarchy and across several departments to inform managers of diverse activities. Plans represent organizational and departmental targets for future performance, and schedules, and schedules represent the defined sequence of activities needed to accomplish those targets. The budget is one widely used plan in Ozka^ik?! Flour Mill.
3.6.3.Custoincr Relations of Ozka^ik^i Flour M ill;
Since long term relationships are important in the industry, customers seek for a steady and trustworthy partner. 0zka§ik9i has founded its distinctive competitive advantage on the quality of the flour it produces. The company enjoys a good reputation in the industry because of the high quality of its products. Since the price difference among the different types of flour is minimal, differentiation on the quality offered plays a significant role in the industry. Ozkajik?! claims that it produces the highest quality flour in Turkey.
0zka§ik9i has its own truck fleet to use for inbound and outbound logistics. However, almost all of its competitors have their own fleets varying in size which prevents
0zka§ik9i from gaining a competitive advantage in this seemingly unimportant area.
When it comes to selling, customer relations play the second most important role besides the reputation of the company. Therefore, an effective sales force can greatly increase the level of sales. For now, Ozka^ikgi has an adaquate number of salespeople whose education level is higher than the industry average.
Research and Development is mainly focused on process improvement rather than on product development. The main aim of R&D in this industry is to lower the cost of production. However, research is also done to determine the proper amount of additives to pour into mix to reach the required quality level. 0zka§ik9i has one of the most advanced R&D laboratories among the Turkish flour factories. They invest on R&D according to the feedback given from the Marketing Department, focusing therefore on the real needs of the consumers.
Within reasonable limits, the firms must deliver the orders on time. After repeated late deliveries, the firms start to lose its customers. 0zka§ik(ji’s major weakness stems from its inability to keep adequate amounts of inventory. This is due to the lack of the necessary finacial resources that have been used up in new investments.
3.6.3.£xisting Status of Özka^ik^i in the Domestic M arket:
TABLE 3.3 : Ozka?ik?rs existing products and their uses. Ty p e PRODUCT USE ITPE 1 PURPLE BAKLAV^VLIK & BOREKLIK ( ORIENTAL TYPES OF FOODS) TYPE 1 PINK YUFKiVLIK ( SPECLUL TYPE OF PRODUC E
TYPEl RED BRb:AI)
TYPE 2 ORVNGE BREAD
ITPE 2 BLUE
SANDWICU & SLMH ( ORIENTAL TY1»E OF FOOD)
TYPE 3 GREEN IiRI<:AD
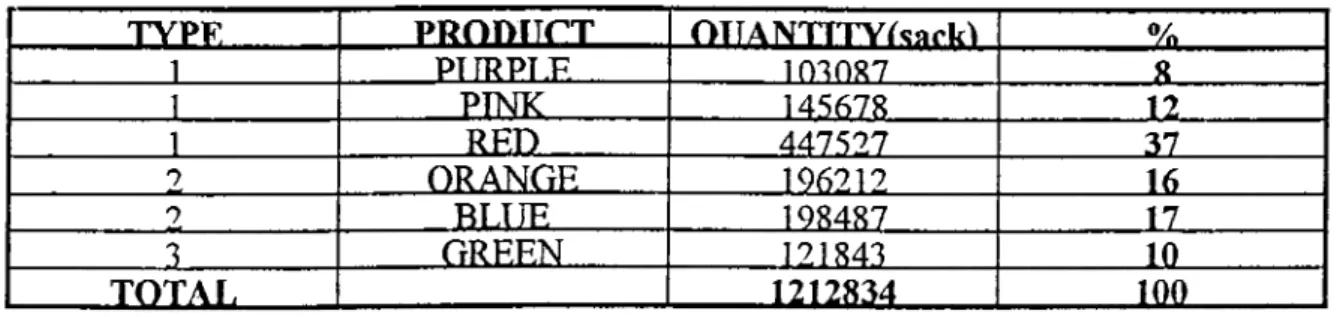
Ozka§ik9i’s sales in 1993,1994 and 1995 according to its product range is given below.
TABLE 3.4 : 1993 Domestic Sales
TYPE PRODITCT OTTANTTITYt^iirk) %
1 PTTRPT.F 1030X7 X 1 PINK 145678 12 1 RED 44757,7 37 2 ORANGE 196212 16 2 BLUE 198487 17 3 GREEN 121843 10
____ TOTAL____
____ 1212834____
TOOTABLE 3.5 : 1994 Domestic Sales
TYPE P R O D lirT OUANTITYIsark) %
1 PTTPPT.E 86879 1 1 1 PINK 117938 16 1 RED 329896 43 2 ORANGE 133720 18 2 BLUE 62616 8 3 GREEN 31636 4 _____ TOTAL 762635______ IQQ_______ 21
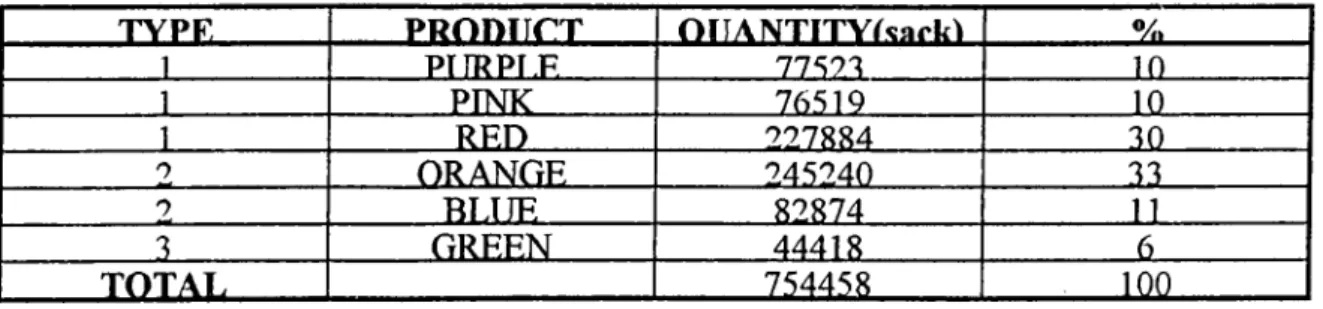
TABLE 3.6 ; 1995 Domestic Sales
TYPE J B n D ilC IL OTIANTITYtsflfkl ÜÍL
JL PTIRPÍR ■ZZ521. in .PRÍK. 76519 in R E D 227884 J£L Q R A N G E 24524Q J il. BLUE· 82874 _ L L G R E E N ■ 4 4 4 18 ..
TOTAL
As can be seen from the tables, 0zka§ik9i’s domestic sales are concentrated on flours for the bread bakeries which are Red and Orange. As can also be seen from the above tables, there is a decrease in the domestic sales in 1994 in comparison to 1993. The main reasons are the economic crises by the beginning of March 1994, and allocation of production capacity to exports by the beginning of the year.
With the sales figures above, 0zka§ik9i’s market share is roughly 0.6% depending on the total consumption figures in Section 3.2. This figure puts 0zka§ik9i in top 5 companies in a market of severe competition with 718 mills. In addition, though there is not any reliable statistics for the competitors’ market share, there are estimates for the biggest which is around 1% market share.
Ozka§ik9i sales figures and product types given in the above tables, also reveals its customer type as given in (Table 3.7).
TABLE 3.7 : Customer Types C iis t f t in p r T v n e % R a ld a v a i^ R o rp .k R
CHAPTER 4
MODEL BUILDING
The notations in the equations are written in General Algebraic Modeling System (GAMS) format.
4.1.Raw Material Balance for Export and Domestic Purposes ;
Foreign and domestic markets require various types of wheat flour in order to produce different types of products like baklava,yufka. Diflerent types of wheat are blended to produce these various types of wheat flours. But in this study, it is assumed that each export and domestic product is milled from one type of imported wheat in order to compare the positive and negative effects of export and domestic markets.
Imported wheat taken into plant is used for either domestic or export purpose. At the end of each month, excess wheat is stored in the wheat silos for the next month usage. The amount of imported wheat either domestic or export purpose usage can be seperated in two parts as shown in Equations (4.1) and (4.2). At the end of the year, the holded amount of raw materials for both export and domestic purposes are assumed to be zero.
XE(n) = XEP (n) + AVEl (n) (ii=l to 12) XD(n) = XDP (n) + WDl (n) (ii=l to 12)
(4.1) (4.2)
4.2.Flour and By-product Quantities for Export and Domestic Purposes :
In this study, it is assumed that the plant is working with an extraction rate of 72%. In other words, 720 kg of wheat flour can be extracted from 1,000 kg wheat as shown in Equations (4.3) and (4.4). The remainings are by-products. By-products can be classified as Bran, Rasmol and Flour 2. 12% of by-product is Bran, 12% of by-product is Rasmol and the remaining 4% is Flour 2. By using these data. Equations (4.5) and (4.6) can be developed. Bran and Rasmol are similiar by-products as a chemical structure. Domestic market prices of these products can be assumed as almost the same. These are used in feed industry as raw material and to produce special types of breads like diet bread.
FE(n) = XEP(n) * 0.72 (n=l to 12) (4.3) FD(n) = XDP(n) * 0.72 (n=l to 12) (4.4) BY(n) = (XDP(n) + XEP(n)) * 0.24 (n=l to 12) (4.5) SEC (n) = (XDP(n) + XEP(n)) * 0.04 (n=l to 12) (4.6)
4.3.Demand for Export and Domestic Sales :
Ozka§ik9i has a long term agreement with two companies which are in North Africa to supply wheat flour on monthly basis. World Food Programme which is a branch of United Nations announces food aid tender to Turkish millers and traders at least 6 times in a year for the exportation to Iraq, Georgia and Azerbaijan.
If the monthly export sales (Table 4,1) of Ozka^ikgi are taken into consideration, it can be said that these figures are not less than 3.000 mton and not greater than 4.000 mton as shown in Equation (4.7).
4.000 > YE(n) > 3.000 (n=l to 12) (4.7)
TABLE 4.1: DOMESTIC AND EXI>ORT SALES FIGURES (1991-1995)
YEAR DOMESTIC (KG) % EXPORT (KG) % TOTAL (KG) 1991 48905200 78 13500000 22 62405200 1992 51676900 79 13787350 21 65464250 1993 59616700 82 12951000 18 72567700 1994 38131750 54 32347000 46 70478750 1995 40334050 45 49185750 55 89519800 238664600 66 121771100 34 360435700
Ozka§ik9i’s statistics (Table 4.1) show that between 1991 and 1995, the average of monthly domestic sales are not less than 4.000 mton and not greater than 6.000 mton. According to the experts, domestic demand of Ozka^ikgi changes between the ranges as in Equation (4.8);
6.000 ^ YD(n) > 4.000 (n=l to 12) (4.8)
4.4.Capacity Constraint :
Ozka§ik(?i Flour Mill has three units and each unit has a milling capacity of 13 mton/hour. In other words, Ozka^ik?! has a production capacity of 936 mton / day. Today, 2/3 of its capacity is utilized. It is also assumed that the plant works 26 days in a month. For the breakdowns and holidays 10 % of total production capacity can be deducted as in the calculation below;
Monthly Capacity = 936*26*(2/3) = 16.224 - 1622.4 (10 % of 16.224) = 14.600 mton
Milling capacity of Ozka^ik?! for every month n, for n=l to 12 can be developed as in Equation (4.9).
XEP (n) + XDP (n) ^ 14.600 (4.9)
Fullfilment of capacity can be true for minimizing production cost. But there is no way to fullfill the capacity of Ozka^ikgi either through domestic or export sales. In Turkey, there are numerous competitors who have roughly equal market shares. Domestic market demand changes with the population and wheat consumption per capita. According to last year’s figures, market demand was around 9.500.000 mtons of flour and the 0zka§ik9i’s domestic sales were almost 40.500 mtons.
Customers are powerful in the flour industry and they are price sensitive (i.e. the location of mill is not effective as the selling price). Millers can reach any customer in Turkey by its competetive price without looking the destination. Lower pricing of the same high quality product in the domestic market provides higher market shares.
It is also true for export market that high competition in foreign market disables the Ozka§ik9i Flour Mill to fullfill its capacity by only export.
4.5.Balance of Production Quantities :
Export products are milled by order. Commodity does not inventoried in plant or in any warehouses; instead, it is directly loaded into the vessel, truck or trailer and sent to the related country. It means that holding cost of export product can be assumed to be zero. Demand of export is equal to the production quantity as shown in Equation (4.10).
FE(n) -YE(n) = 0 (n=l to 12) (4.10)
Ozka5ik9i has to hold different types and certain amount of domestic products in order to satisfy the local customer needs. And also local customers generally need matured wheat flour. They prefer to use matured wheat flour for bread, yufka or baklava products (oriental type of products). Domestic products first milled, matured and then sended to the customers according to their needs.
In this study, it is assumed that the plant starts to mill with zero inventory level. Equation (4.11) shows the domestic product balance for January (n=l).
FD(1)-YD(1)-DI(1) = 0 (4.11)
Excess of domestic products from the first month demand are stored for the next month consumption as shown in the Equation (4.12).
FD(n)-YD(n)-DI(ii)+DI(n-l) = 0 (n=2 to 12) (4.12)
4.6.Wheat Costs for Export and Domestic purposes :
Unit cost of imported wheat depends on the purpose it will be used. If the imported wheat is used in export purpose, then the importation will be free from the custom tax, VAT, BIDT,etc. For the case of export flour production, unit cost of wheat can be calculated as follows;
Unit Cost of Wheat for Export Production ( USD/mton ) = CIF (Cost + Insurance + Freight) value of commodity on the board of the vessel (USD/mton) + Turkish Grain Board Silo Rent (4 USD/mton) + Harbour Expenses (2 USD / mton) + Custom
c if value of the commodity is a parameter that is determined by world market prices. If all these fixed costs are added, we can reach Equation (4.13).
Unit Cost of Wheat for Export Production ( USD/mton ) = CIF value of commodity + 17
CWE(n)= CIF + 17 (n=l to 12) (4.13)
In domestic flour production case, there is 3% (of CIF value) custom tax for millers who do not have permission from TFTU. And also for the other custom expenses (Like VAT, import fee, BIDT,etc), almost 1.5 % of CIF value is assumed. Totally it reaches to 4.5 % of CIF value of the commodity.
Unit Cost of Wheat for Domestic Production ( USD/mton) = CIF value of commodity on the board of the vessel (USD/mton) + (4.5% of CIF value of the commodity) + Turkish Grain Board Silo Rent (4 USD / mton) + Harbour Expenses (2 USD / niton) + Custom Expenses (1 USD / mton) + Transportation of goods from port to plant assumed to be (10 USD / mton).
If all these fixed costs are added, Equation (4.14) can be derived as written below;
Unit Cost of Wheat for Domestic Production ( USD/mton) = CIF value of commodity + (4.5% of CIF value of the commodity) + 17
CWD(n) = 1.045*CIF + 17 (n=l to 12) (4.14)
Turkish Grain Board (TGB) silo rent, port and custom tariflfes are declared by government on yearly basis in USD. In this study, Derince-Izmit Port is prefered as check point for the importation since Derince Port has higher discharging capacity, lower tariffes according to other ports, modem, maximum silo capacity and closest port to Ozka^ikgi Flour Mill.
4.7.Unit Production Cost :
Unit production cost consists of fixed and variable terms. Gross wages ot production, quality control, tranportation and purchasing departments, depreciation, car expenses, travelling expenses, tmck expenses and other expenses related to the production are assumed to be the fixed costs of Ozka5ik9i Flour Mill.
On monthly basis, these figures are approximately forecasted in 1996 Budget (Table 4.2) and summerized below:
O Gross wages of production, purchasing, quality control and transportation departments
= (26.129.000,000 + 1.935.000.000 + 1.870.000.000 + 1.616.000.000) / 12 = 2.650,000.000 TL
(Annual inflation increase is as in forecasted 1996 Budget) OMonthly Depreciation : 5.000.000.000 TL
OCar expenses : 1.114.000.000/ 12 = 93.000.000 TL OTruck expenses : 6.138.000.000 / 12 s 512.000.000 TL OTravelling expenses : 1.127.000.000/12 s 94.000.000 TL OOther expenses : 4.413.000.000 / 12 = 368.000.000 TL
Summation of the above items yields the FC as sliown in Equation (4.16a);
FC = 2.650.000.000 + 5.000.000.000 + 93.000.000 + 94.000.000 + 512.000.000 + 368.000.000 (TL/mton)
FC = 8.717.000.000 (4.16a)
σ> Ю O CD lO о CD со x^ 00 N - O CO Ю (Ν CO h - T— CD г - CD CD CO CM O X— O т— CD 00 CO 00 см со Χί· T— X— O XÍ· N -S Ю T “ X—X— 00 X—X— X—(O X—O Χί Ю о 04 CO со CO N -н ю 00 00 CM O X— Ю X— CD O ο Xl-О) h - h*. Ю CM со 00 LO CM O O O co ш T—X—T - X— со T— X— X—O Ю X— Û O í ТГ со Ю N . > юCD 00 00 CMlO h - а> CD oo 00т— h - X f T—COX—OX—O N·O X— COLO о T” X—X— CD см X— Τ CO X—O Χί N 2 C4J CO со Ю CO 1 . ю 00 00CM CO ЮΟ ooCO O ο N Ι ο σ> O- r- lO CO h- xr X—X— O O xi· CM T—T—X— h- о X— X—CO X-- O XÍ· CO о OI CO со Ю CO ю oo 00CM CO σ>CM CM CO ooCD O CM X— Û. CD O- h- lO CDо CO χ^ O r^ CD O X— N LU T—T—X— ЮCD T— T—iO O xi· 00 (0 см CO см Ю Ю О юσ> O - h*· Юoo 00 CM OO со Ю x r O CO CD OCO xi*O OCM X—CO 3 ’М* X—X—X— X— X—VO O xi- Ю < см CO см Ю LO ю 00 00 CM X— ю T— O CD CM CM O xi· N CD r - h - Ю см UO X f CD Ю CD O CD CD 3 T~ X—Χ CO h - X— Ю O CO CO 3 см CO см Ю Ю X— о Ю Ю ΙΟ Ю h - CD CD <o CD CD O X t CO 2 CD CO CO X— CD00x r CO CDCO00O 00 LO 3 ОО Χ Χ X— CM(ОT— LO O CO LO -J 3 Τ COсм Ю x^ Ι X— ο Ο ΙΟ ΙΟ lO 00r - r>*. COoo COO CD N -о CDCOCOX— COсо x f COCDΧ 00O CO CD о < СО Χ Χ T— CMсо T— ΙΟ O CO CO о 2 Τ CO см Ю xi-о X— о а : Ο ΙΟ ΙΟ Ю CMт—CMCO00 xi· CMO CM CM « CDCOCOX— CMю χ^ CO00 CD00 O Ю Χί (/) о. 00 χ Χ COCDX— x r O CO ο Н < Τ COсм Ю LO 2 сс Ο Юιό ΙΟ CM00 h- X f xi· O 00 O Ю CO Э О) COCOX— CMсо COCOoo N. h- O CO O < 00 X—T“ T“ Ю00T— x r O CO 00 н- 2 τ COсм Ю xt ш X” о ω ο CDЮh- h- CDCOCOCDCOCMO N N Q О <DCO CMсо CMX—COCOΧί O Ю Χί э m ш U . CDт - Г-. ю OЮ οCD со CD00 lO CDχ^ CMr^ X—ο O oo N <7> 2 CDCMCMCD ЮCDCD CM00 XÍ· O CD X— σ> < (O CO CM O CM OO τ 3 v - CMX— Ю T“ ο T -Ш h -(0 < О Ш о : О U . 4-* ω о О (Л 0) 'l— JS5 (0 ( 0 CL (D (/) ÿ '¡Z eu —· eu ¿S ω ^ ^ ex ex CD Q> Q ro (0 o> Q c O (D ω ID e ф ex (Dф c Ф ex X Ф Έ *L·. Ф Φ O c eu c eu .E ’eu CDΦ (D CD Φ CDC Φ ex CD Φ CD 4-*(D O O c O 0
Electricity, sack, additive materials, repair and maintenance are the variable costs of the Ozka^ikfi Flour Mill, 0zka§ik9i does not pay for the water source because the company has its own water resources.
О Kwh price of electricity is estimated as 5.000 TL for the whole year (Annual increase in the price of electricity is included). The mill consumes 60 kw/ton . This means that the cost of electricity to produce 1 mton of wheat flour is 300.000 TL (5.000 TL/kwh * 60 kwh/mton).
Э It is assumed that the average unit price of sack is 17.000 TL. Each sack that is 80 gr contains net 50 kg product or by-product. To produce 1 mton of wheat flour, the cost of sacks comes to 17.000*20 = 340.000 TL. It is assumed that the price of export, domestic and by-products sack types and the prices are almost same.
О For the additive materials, unit price is assumed as 12.500 TL/mton. Additive materials
are used to improve the quality of dough.
О For the repair and maintenance expenses of the mill, unit price is assumed as
3.500 TL/mton.
Equation (4.16b) shows the coefficient of variable cost.
VC= 300.000 + 17.000*20 + 12.500 + 3.500 ( TL / mton)
VC = 656.000 (4.16b)
Variable cost is directly proportional with the milling capacity of plant. By combining fixed and variable parts of the production cost, unit production cost of Özka^ik?! is obtained in TL/kg in the Equation (4.15).
PC(n) = (FC + VC * (XEP(n) + XDP(n))) / (XEP (n) + XDP (n)) (n=l to 12) (4.15)
In this study, all selling prices and costs have been calculated in USD/mton in order to reflect the effect of inflation. To convert the unit of Equation(4.15) to USD/mton, it has been divided by dollar rate (DOL) and multiplied by 1,000 as in Equation (4.16).
PC(n) = [( FC + VC · (XEP(n) + XDP(n))) / (XEP (n) + XDP (n))] " [l.OOO/DOL] (n=l to 12) (4.16)
4.8.Cost Functions for Domestic and Export Flour Production Purposes :
Unit cost of export or domestic flour consists of the purchase cost of wheat and the production costs. (Note that by using 1 mton wheat, 0.72 mton wheat flour is produced) To produce 1 mton of wheat flour, l/(0.72) s 1.38 mton of wheat is needed as shown in Equations (4.17) and (4.18).
Wheat flour market is a very competitive market in the world. Millers are not able to make large profits from this business. All world millers who export wheat flour work with a profit margin of not more than 5%. European Countries, which are our biggest competitors, support their exporters and producers by giving different types of incentives and subsidies. Turkey is in the third position in the world as a wheat flour exporter. The main reason of this is the nearest location of Turkey to Middle East and North African countries.
Most of the millers settle near the ports in order to eliminate the transportation costs between the ports and the plants. It can be said that the location of 0zka§ik9i can be seen as one of its weaknesses because it is far from the ports compared with its competitors.
In the domestic market, profit margins show satisfactory figures than the ones of the export market. Especially in luxury products, you can make much more profits compared with the ordinary ones such as bread. But the payment terms (changes between 45 and 55 days) of domestic market are longer than export market and this also brings some financial loss.
According to 0zka§ik9i’s last three years statistics, the maximum profit margins obtained from the export and domestic sales are 5% and 18%, respectively. The prices will be used as parameter in this model since they are exogenous.
4.9.Price Determination for Expoi*t and Domestic Purposes :
Holding or carrying costs relate to phsically holding items in storage. They include interest, insurance, taxes, depreciation, obsolescence, deterioration, spoilage, pilferage, breakage, and warehousing costs (heat, light, rent, security).
Holding costs also include opportunity costs associated with having funds tied up in inventory that could be used elsewhere. In any case typical annual holding costs often range from 20 percent to 40 percent of the value of an item. Inventory levels too low can result in increased production costs, higher raw material costs, lost sales and dissatisfied customers.
The uncertanities of both supply and demand for finished goods cause managers to hold a stock of finished goods to act as a buffer (i.e.safety stock) to be used when demand is greater than anticipated or when supply is less than expected. Buffer stocks are usually more economical than placing emergency special orders.
The number of by-product silos is limited. Thus, the by-products are directly sent to the customers. So, by-product quantity that is hold at the end of the month can be assumed as zero. In domestic market, the excess products are held the next month consumption. The ten percent of the cost of domestic product is assumed as monthly holding cost as in the Equation (4.19) by taking yearly 120% interest rate into consideration.
HC(n) = 0.10*DI(n)*CFD(n) (n=l to 12) (4.19)
The holding cost of raw materials that are used either in domestic or export purpose also bring some financial loss. This loss can be assumed as 10% of cost of unit of raw materials as in the Equations (4.20) and (4.21).
HCEW(n) = WEI(ii) * CWE(n) * 0.10 (ii=l tol2) HCDW(n) = WDI(ii) * CWD(n) * 0.10 (n=l to 12)
(4.20) (4.21)
4.11.Penalty Cost of Domestic Products :
Domestic products sell into local market between 45 and 55 days payment term. This payment term also brings some financial loss on the domestic product as a penalty cost. This financial loss can be assumed as 15% of the selling price of domestic product as in Equation(4.22).
PenC (n) = 0.15 * PD(n) * YD(ii) (n=l to 12) (4.22)
4 .12.Total Revenue :
Ozka§iktrs revenue vsfill come from three sources : (1) The revenue made by domestic sales, (2) The revenue made by export sales and (3) The revenue made by by-products.
REV(n) = FE (n) * PE (n) + FE(n) » 12 + FD (n) · PD (n) + UY (n) * PUY + SEC(n) · PSEC (n=l to 12) (4.23)
According to the last declaration of Central Bank, the incentive (freight premium) was USD 15/mton. The payment of these premiums is done by Central Bank with the order of government. Central Bank issues two year loans and distribute to the exporters. According to the last announcement of the government, these papers can be discounted in banks or used to pay the collected debts of the exporter firms in the government sectors like ТЕК.
In this study, incentive USD 15/mton is considered as USD 12/mton because of the financial loss of the present value of it in two years. This is shown in Equation (4.23).
4.13.0bjcctive Function:
ÖzkaşıkçTs objective is to maximize the total profit. The cost of products, holding costs and penalty costs are deducted from the total revenue in order to maximize the total profit as shown in Equation(4.24).
As a summary, we can present the above formulation as follows;
12
M/VX Z = Z [ (ItEV(n) - CFE(n)'*FE(n) - CFD(n)*IT)(n) - IIC(ii) - PcnC(n) - IlCEW(n) - Ha)W(n) ]
XE(n) = XEP (n) + WEI (n) (n=l to 12) XD(n) = XDP (n) + WDI (n) (n=l to 12) FE(n) = XEP(n) * 0.72 (n=l to 12) FD(n) = XDP(n) * 0.72 (n=l to 12) BY(n) = ( XDP(n) + XEP(n) ) * 0.24 (n=l to 12) SEC (n) = ( XDP(n) + XEP(n) ) * 0.04 (n=l to 12) 4.000 > YE(n) > 3.000 (n=l to 12) 6.000 > YD(n) > 4.000 (n=l to 12) XEP (n) + XDP (n) < 14.600 (n=l to 12) FE(n) -YE(n) = 0 (n=l to 12) FD(1)-YD(1)-DI(1) = 0 FD(n)-YD(n)-DI(n)+DI(n-l) = 0 (n=2 to 12) CWE(n) = GIF + 17 (n=l to 12) CWD(n)= 1.045*CIF+17 (n=l to 12)
PC(n) = [(FC + VC*(XEP(n) + XDP(n)))/(XEP(n) + XDP(n))]*[ l.OOO/DOL ] CFE(n) = ( 1.38* CWE(n) + PC (n) ) (n=l to 12)
CFD(n) = ( 1.38* CWD(n) + PC(n) ) (n=l to 12)
39
HCEW (n) = WEI (n) * CWE(n) * 0.10 (n=l to 12) HCDW (n) = WDI (n)* CWD(n) * 0.10 (n=l to 12) PenC (n) - 0.15 * PD(n) * YD(n) (n= 1 to 12)
lΠV(n) = I'E (n) * PE (n) + EEOi) * 12 + FD (n) * PD (n) + BY (n)*PBY + SEC(n)*PSEC (n=l to 12)
HC(n)= 0.10*DI(n)*CFD(n) (n-1 to 12)
NUMBER OF CONSTRAINTS
NUMBER OF DECISION VARIABLES NUMBER OF PARAMETERS
NUMBER OF NONLINEAR CONSTRAINTS
276 301
6
72
In Chapter 5, the model is run by using the formulation above. The results of the model are presented and discussed.
CHAPTER 5
RESULTS AND DISCUSSIONS
In this chapter, three alternative scenarios are identified and discussed. Under each scenario, the firm’s total profit level and capacity utilization will be evaluated under changing export demand from the market and domestic market demand or government’s new export amendment.
5.1.Scenario 1 :
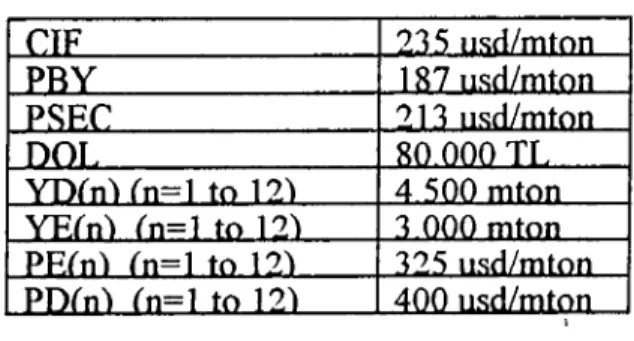
In the first scenario, under 0zka§ik9i’s current position, its profit is evaluated. During the evaluation, selling prices, the cost of wheat, selling prices of by-products and constant dollar rate are put into the model as in Table 5.1.
Table 5.1. Existing Values
CIF 235 usd/mton
PBY 187 usd/mton
PSEC 213 usd/mton
DOL 80.000 TL . . .
YDfn'» (n=i to 121 4.500 mton YEtn^ in=l to 12^ 3.000 mton PEinl in=l to 12'> 325 usd/mton PDInl (n=UQ-L2:i____ 400 iLsd/mfon
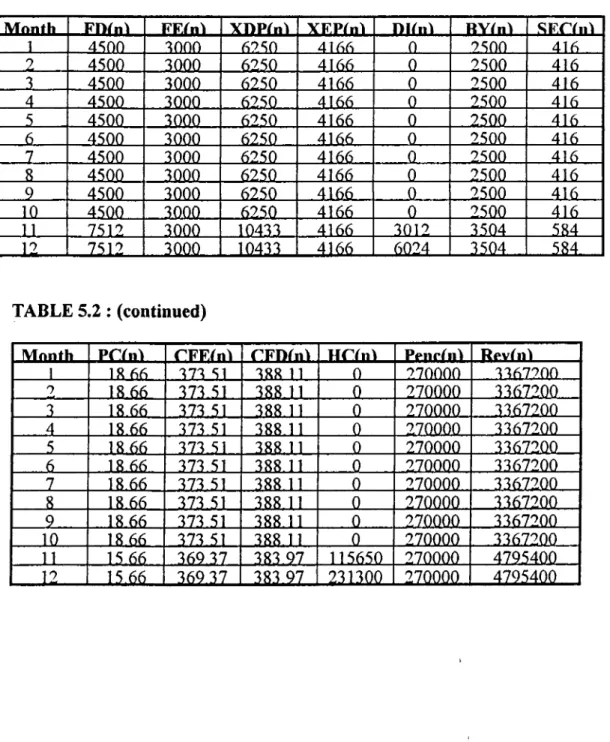
When the model is run, the optimal value for profit is found to be USD 3.020.919. The values of important variables are presented in Table 5.2. GAMS outputs are shown in Appendix A.
TABLE 5.2: THE RESULTS OF SCENARIO 1 (mtons)
M o n t h F F T n t X D P i n l X F P i n l D B i A B Y i n t S E C i n l 1 . 4 5 0 0 3 0 0 0 6 2 5 0 4 1 6 6 0 2 5 0 0 4 1 6 . 2 _ 4 5 0 0 3 0 0 0 6 2 5 0 4 1 6 6 0 2 5 0 0 . 4 1 6 . 3 . 4 5 0 0 3 0 0 0 6 2 5 0 4 1 6 6 0 2 5 0 0 4 1 6 4 4 5 0 0 3 0 0 0 6 2 5 0 4 1 6 6 0 2 5 0 0 4 1 6 5 _ 4 5 0 0 3 0 0 0 6 2 5 0 . 4 1 6 6 0 2 5 0 0 4 1 6 6 4 5 0 0 3 0 0 0 6 2 5 0 4 1 6 6 0 2 5 0 0 . 4 1 6 7 . 4 5 0 0 3 0 0 0 6 2 5 0 4 1 6 6 0 2 5 0 0 4 1 6 8 4 5 0 0 3 0 0 0 6 2 5 0 4 1 6 6 0 2 5 0 0 4 1 6 9 4 5 0 0 3 0 0 0 6 2 5 0 4 1 6 6 0 2 5 0 0 4 1 6 1 0 4 5 0 0 3 0 0 0 6 2 5 0 4 1 6 6 0 2 5 0 0 4 1 6 1 1 . 7 5 1 2 3 0 0 0 1 0 4 3 3 4 1 6 6 3 0 1 2 3 5 0 4 5 8 4 ____ 1 2 ____ 7 5 1 2 .... 3QQ.Q·.... 1 0 4 3 3 0 0 2 4 3 5 0 4 .... .... 5 8 4 ... TABLE 5.2: (continued) M o n t h p r i n t C F F i n t C F D i n t I f C i n t P e n r i n t R e v i n t 1 1 8 6 6 3 7 3 5 1 3 8 8 1 1 0 2 7 0 0 0 0 3 3 6 7 2 0 0 2 1 8 .6 6 3 7 3 5 1 3 8 8 . 1 1 0 2 7 0 0 0 0 3 3 6 7 2 0 0 3 18 .6 6 3 7 3 . 5 1 3 8 8 . 1 1 0 2 7 0 0 0 0 3 3 6 7 2 0 0 4 18 .6 6 3 7 3 5 1 3 8 8 1 1 0 2 7 0 0 0 0 3 3 6 7 2 0 0 5 18 .6 6 3 7 3 5 1 3 8 8 . 1 1 0 2 7 0 0 0 0 3 3 6 7 2 0 0 6 1 8 .6 6 3 7 3 . 5 1 3 8 8 . 1 1 0 2 7 0 0 0 0 3 3 6 7 2 0 0 7 1 8 .6 6 3 7 3 . 5 1 3 8 8 1 1 0 2 7 0 0 0 0 3 3 6 7 2 0 0 8 1 8 .6 6 3 7 3 . 5 1 3 8 8 . 1 1 0 2 7 0 0 0 0 3 3 6 7 2 0 0 9 1 8 .6 6 3 7 3 5 1 3 8 8 . 1 1 0 2 7 0 0 0 0 3 3 6 7 2 0 0 1 0 1 8 .6 6 3 7 3 . 5 1 3 8 8 . 1 1 0 2 7 0 0 0 0 3 3 6 7 2 0 0 1 1 1 5 .6 6 3 6 9 3 7 3 8 3 .9 7 1 1 5 6 5 0 2 7 0 0 0 0 4 7 9 5 4 0 0 ____ 1 2 ____ 1 5 .0 0 3 6 9 .3 7 3 8 3 .9 7 2 3 1 3 0 0 . 27Q .00.0.· 4 7 9 5 4 0 0
In the first scenario, production is made according to the amount of demand until the 11th month. After the 11th month, full capacity is utilized in order to maximize total profit. The model has minimized the unit production cost by utilizing full capacity. The decrease in the unit production cost directly caused the unit flour cost to fall and thus affecting total profit. At the same time, the model increased the rate of by-products and realized sales in cash to the domestic market.
The model did not keep raw materials on inventory since it is not found profitable. In the last two months the excess of wheat flour in domestic demand is kept on hand and this some amount of loss to be incurred.
Since the benefits of utilizing full capacity are greater than holding cost of domestic products, the model found this profitable.
As there are no changes occured in domestic demand, the penalty cost of domestic products remain unchanged.
All these changes are observed as increases in revenues and this has increased the total profit.
5.2.Sceiiario 2 :
In this scenario, sensitivity analysis is applied to the model. The values which are kept constant in the previous model (Table 5.1) except demand values are put in this model.
This scenario is going to be examined in two ways. First of all, by keeping the value of export demand in first scenario constant, and changing the demand in domestic market, changes in total profit is going to be examined. Secondly, by keeping the demand in domestic market constant at its level in the first scenario and changing the export demand, changes in total profit is going to be examined. In both cases, the maximum total profits are to be compared under full capacity utilization.
In Figure 5.1, export demand is fixed to its existing value 3,000 mtons. Running the model 11 times, the total profit values are observed for differing domestic demands. In Figure 5.1 maximum total profit is found to be USD 4,221,409. In order to reach this
!.-vel^ 7,500 mtons domestic products and 3,000 mtons export products are sold. In Figure 5.2, the model is run 10 times and maximum '
- / v order to reach this higher profit level 6,000 mton export and 4,500 niton domestic products are sold.
Total Profit vs Domestic Demand YE(n)=3000 a <0 D fO o 4500CX)0 1 4000000 3500000 -3000000 >. ,ij i 1 1 ^ “ 2500000 -i; 2000000-^ .!·■■■ h r 1500000 -1000000 - ' ih ii; !' 500000 - **’'·! / !! 0 - .. . 'iij ‘ i ': ,'i * —H- -I——H H— — H
Domestic Demand (YD(n)) In mton
Figure 5.1 : Total Profit vs Domestic Demand
Total Profit vs Export Demand YD(n)=4500 500CXXX) 45CXXXXD g 4000000 = 3500000 ^ 3000000 g 2500000 2 2000000 5 1500000 i 1000000 500000 0 ! I ♦ 'V
•i.' . ,ii -i:'' i t - i ' i h h h ' : . , ‘ i*‘ ' ill .' · ■ . .1 Ip i l l ' ' i; i i'!;·!'' · " ; : l | ‘ г · ! Γ ■·;... i- 'i*H i I'l ? "j “ i . ' ' h · i i V i i 1 i ‘ i l i j i l l l l h : h V i i " i t . !... i, , ■i 1 ■ i > f r ■’ i !
Export Demand (YE(n)) in mton
Figure 5.2 : Total Profit vs Export Demand
As a result of the comparison of Figures 5.1 and 5.2, it is seen that export intensive work is much more profitable than that of domestic market intensive work.
In Figure 5.1, the maximum profit level is reached through the sale of 7,500 mtons of domestic market flour which is not feasible for Czka^ik^i at the moment, which can realize 5,500 - 6,000 mtons of domestic market sales.
In Figure 5.2, Ozka^ik?! realized maximum profit by selling 6,000 mtons export product. Ozka^ikgi have reached these values on monthly basis in previous crisis years. This sale amount depends not only on the firm’s marketing policy but also the current government export incentives and applications.
As a conclusion, the reasons for differences in profit levels in these two figures may be listed as follows:
i. The cost of wheat which is to be used for export is lower than that of domestic market. ii. USD 12/ mton export incentive given to exporters by the government.
iii. The penalty cost in the domestic market brought by forward sales may be considered as a financial loss. Although the profit margin in the domestic market may seem higher than the export, payment dues proves the export to be more profitable.
iv. Keeping domestic market product inventory also causes financial loss. On the other hand, export works through orders and does not include holding cost.
By-product amounts and the unit production cost have no eflfect in Scenario 2 since two cases with full capacity utilization are compared. In both, there are no changes observed in the amount of by-product and its revenue. Besides, since full capacity is utilized, the effect of unit production cost is negligible for both cases.
5.3.Sccnario 3:
In this scenario, we assume that amendments are made to the export régime and the level of freight premium is anulled. In this case, change in Ôzka§ikçi’s total profit is going to be observed and the capacity utilization will be discussed accordingly.
Just like in Scenario 2, export and domestic market demands are consecutively kept constant, thus, model is run for both situations.
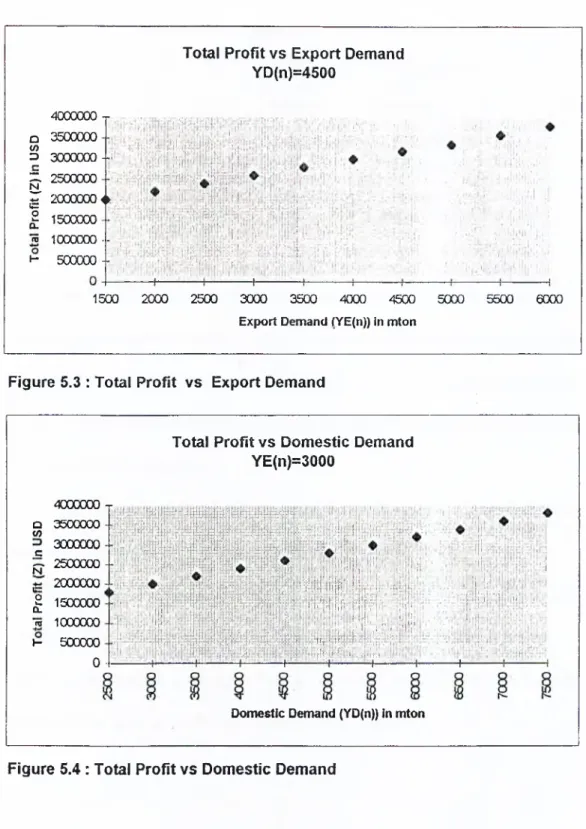
In the first situation (Figure 5.3) domestic demand is kept constant at 4,500 mtons, and total profits are observed for 10 different values run. When the export demand reaches 6,000 mtons, total profit becomes USD 3,774,775.
In the second situation (Figure 5.4) by keeping the export demand constant at 3,000 mtons, the domestic market demands are run 11 times. When the domestic market demand is 7.500 mtons, the total profit becomes USD 3,789,409.
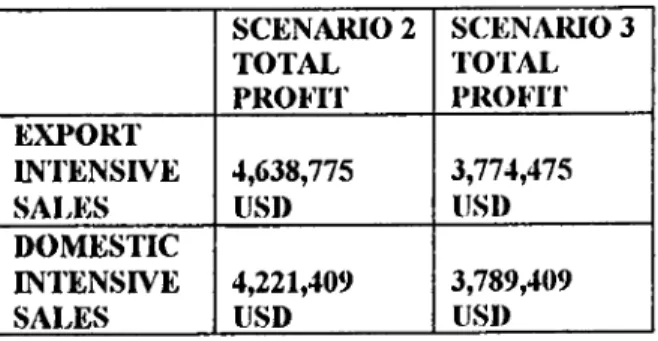
When the outcomes of Scenario 3 and 2 are compared, the effects of the anullment of the export incentives on the company’s total profit could be seen (Table 5.3).