CANCER-TESTIS GENE EXPRESSION AS A BIOMARKER OF THE GENETIC VARIATION IN THE ONE CARBON METABOLIC PATHWAY
A THESIS SUBMITTED TO
THE DEPARTMENT OF MOLECULAR BIOLOGY AND GENETICS AND THE INSTITUTE OF ENGINEERING AND SCIENCES OF
BILKENT UNIVERSITY
IN PARTIAL FULFILLMENT OF THE REQUIREMENTS FOR THE DEGREE OF MASTER OF SCIENCE
BY
AHMET RASİM BARUTÇU AUGUST 2008
II
I certify that I have read this thesis and that in my opinion it is fully adequate, in scope and in quality, as a thesis for the degree of Master of Science.
Assist. Prof. Dr. Ali Osmay Güre
I certify that I have read this thesis and that in my opinion it is fully adequate, in scope and in quality, as a thesis for the degree of Master of Science.
Prof. Dr. Bensu KARAHALİL
I certify that I have read this thesis and that in my opinion it is fully adequate, in scope and in quality, as a thesis for the degree of Master of Science.
Assist. Prof. Dr. Zeynep KALAYLIOĞLU-WHEELER
Approved for the Institute of Engineering and Science
Director of Institute of Engineering and Science Prof. Dr. Mehmet Baray
III
CANCER-TESTIS GENE EXPRESSION AS A BIOMARKER OF THE GENETIC VARIATION IN THE ONE CARBON METABOLIC PATHWAY
Ahmet Rasim Barutçu
MSc. in Molecular Biology and Genetics Supervisor: Assist. Prof. Dr. Ali Osmay Güre
August 2008, 87 Pages
ABSTRACT
S-adenosyl methionine (SAM) is the sole methyl donor for all biological reactions in humans. Folate consumption, required for SAM generation, is also essential for dTMP synthesis and both events occur via enzymes of the one-carbon pathway. Frequently occurring alleles of these enzymes have occasionally been associated with several diseases including cancer. However, the cumulative effects of the polymorphic variants of these enzymes on S-adenosylmethionine production have not been studied. The identification of a biomarker that can reflect the collective effect of these allelic variants is critical in moving the field forwards. We hypothesized that Cancer-Testis (CT) genes, whose expression strongly correlates with DNA hypomethylation, could be such a biomarker. In this study, we have pursued an extensive correlation of CT expression and allelic variants of the several one-carbon pathway enzyme genes , including methyltetrahydrofolatereductase (MTHFR), methionine synthase (MS), reduced folate carrier (RFC) and methionine synthase reductase (MTRR) in non-small cell lung cancer. Our results revealed linkage disequilibrium among alleles as well as correlations between given genootypes and CT gene expression, and illuminate the critical next steps that need to be pursued.
IV
BİR KARBON METABOLİK YOLUNDAKİ GENETİK FARKLILIKLARIN BELİRLEYİCİSİ OLARAK KANSER-TESTİS GEN İFADESİ
Ahmet Rasim Barutçu
Moleküler Biyoloji ve Genetik Yüksek Lisansı Tez Yöneticisi: Yard. Prof. Dr. Ali Osmay Güre
Ağustos 2008, 87 Sayfa
ÖZET
İnsanlarda bütün biyolojik tepkimelerde kullanılan tek metil grubu vericisi S-adenozilmetiyonin (SAM)’dir. SAM üretimi için gereken folik asit tüketimi, deoksitimidin monofosfat (dTMP) sentezi için gereklidir ve her iki olay da bir karbon metabolik yolundaki enzimler sayesinde gerçekleşir. Bu enzimlerde sıkça görülen aleller kanser dâhil birçok hastalık ile ilişkilendirilmiştir. Ancak, bu enzimlerde görülen polimorfizmlerin SAM üretimine olan kümülatif etkisi şu ana kadar çalışılmamıştır. Bir karbon metabolik yolundaki enzim alellerinin kümülatif etkisine duyarlı ve buna cevap verebilecek biyolojik bir belirleyicinin teşhisi, bu alanda ilerleme kaydedilmesi için önemlidir. Hipotezimize göre transkripsiyonları DNA demtilasyonu ile ilişkili olan Kanser-Testis (KT) genleri, böyle bir biyolojik belirteç olabilir. Bu çalışmada, küçük hücre dışı akciğer kanserinde (KHDAK) KT gen ifadesi ile bir karbon metabolik yolundaki, metilentetrahidrofolat redüktaz (MTHFR), metiyonin sentaz (MS), indirgenmiş folat taşıyıcısı (RFC) ve metiyonin sentaz redüktaz (MTRR) enzim alelleri ilişkiyi araştırdık. Sonuçlarımız, enzim alelleri arasında linkage disequilibrium olduğunu göstermiş, ayrıca belli bir haplotip ile CT gen ifadesi arasındaki ilişkiyi açığa çıkarmış ve izlenecek adımlarda önemli noktaları aydınlatmıştır.
V TO MY FAMILY
VI
ACKNOWLEDGEMENTS
First of all, I would like to thank Assist. Prof. Dr. Ali Osmay Güre for his endless support, supervision and guidance. I am grateful for his patience and this thesis could not have been prepared without him. I feel very lucky and honored to work with Dr. Ali Güre for I believe I have gained the maximum experience in my master study by working with him.
We would never be able to finalize my results without the help of Assist. Prof. Dr. Zeynep Kalaylıoğlu-Wheeler. I would like to thank her for the time and effort she has dedicated. She performed critical statistical analyses without which interpretation of some of our results might have been impossible. She has been a genuine support for my study.
I would also like to thank Prof. Dr. Bensu Karahalil for her valuable knowledge and guidance. She graciously made precious contributions to my study.
I was delighted to have such a wonderful and amiable team of colleagues. They were not only colleagues, but marvelous friends in and out of the lab. I will never forget our monthly and weekly “meetings” and “feasts”. I would like thank Aydan Bulut, Duygu Akbaş, Şükrü Atakan, Derya Dönertaş, Esen Oktay and Ender Avcı for their support. I do not know if I will have such a laboratory team in my academic life. I would also like to thank the MBG family for creating such a laboratory environment.
Last but never the least; I would like to thank my father for raising such an individual and I wish he could see me making this work come true. I would like to thank my dear family and my companion for their never-ending love and support.
During this the course of this study, towards my Master’s degree, I received a Scholarship 2210 from TÜBİTAK.
7
Table of contents
ABSTRACT………...III ÖZET……….……….……..IV DEDICATION PAGE………..……….V ABSTRACT………...III ÖZET……….……….……..IV DEDICATION PAGE………..……….V ACKNOWLEDGEMENTS... VI TABLE OF CONTENTS ... 7 LIST OF TABLES ... 9 ABBREVIATIONS ... 12 CHAPTER1. INTRODUCTION ... 13 1.1 DNA methylation ... 131.2 DNA Methylation and Cancer ... 14
1.3 Cancer Testis (CT) Genes ... 15
1.3.1 CT Gene Expression Regulation ... 16
1.4 S-Adenosylmethionine: The universal methyl donor... 19
1.5 One carbon pathway ... 20
1.6 Folate deficiency and DNA damage ... 23
1.7 One carbon pathway enzyme variants ... 24
1.7.1 Methylenetetrahydrofolate reductase (MTHFR) ... 24
1.7.2 Methionine synthase reductase (MTRR) ... 26
1.7.3 Methionine synthase (MTR) ... 26
1.7.4 Reduced Folate Carrier (RFC) ... 27
8
1.8 Cancer and one carbon pathway enzyme variants ... 28
1.9 The aim of the study ... 31
CHAPTER 2. MATERIALS AND METHODS ... 33
2.1 The PCR Method... 33
2.2 DNA Samples ... 34
2.3 Restriction Fragment Length Polymorphism (RFLP) Analysis... 36
2.3.1 Digestion Products ... 37 2.4 c-DNA Synthesis ... 43 2.5 Cell Culture ... 43 2.6 RNA Isolation ... 43 2.7 Real Time PCR ... 44 2.8 Statistical Analysis ... 45 CHAPTER 3. RESULTS ... 46
3.1 One carbon pathway enzyme genotype frequencies of lung cancer patients ... 46
3.2 Distribution of one carbon enzyme genotypes ... 48
3.3 One carbon enzyme allele distribution . ... 50
3.4 CT expression associations with one carbon enzyme genotype combinations ... 51
3.5 One carbon enzyme genotype associations in lung cancer patients ... 53
3.6 Univariate power analysis... 54
3.7 Multivariate power analysis ... 55
CHAPTER 4. DISCUSSION ... 58
AND FUTURE PERSPECTIVES ... 58
CHAPTER 5. REFERENCES ... 73
9
List of tables
Table 1.The one-carbon pathway enzyme allele activity differences. ... 28
Table 2. PCR primers used for RFLP analysis ... 33
Table 3. Nested PCR primers used for RFLP analysis ... 34
Table 4. CT gene expression profile of CT (+) tumor samples ... 35
Table 5. CT gene expression profile of CT(-) tumor samples ... 36
Table 6. Expected RFLP product sizes ... 37
Table 8. A222V (C677T) variant of the MTHFR gene... 38
Table 9. E429A (A1298C) variant of the MTHFR gene ... 39
Table 10. D919G (A2756G) variant of the MTR gene ... 40
Table 11. I22M (A66G) variant of the MTRR gene ... 41
Table 12. R27H (G80A) variant of the RFC gene ... 42
Table 13 One carbon enzyme distributions in lung cancer patients and Hardy-Weinberg expectations. ... 47
Table 14. Distribution of 1-carbon enzyme genotypes among CT-positive and -negative lung cancer patients I: Chi-square test. ... 49
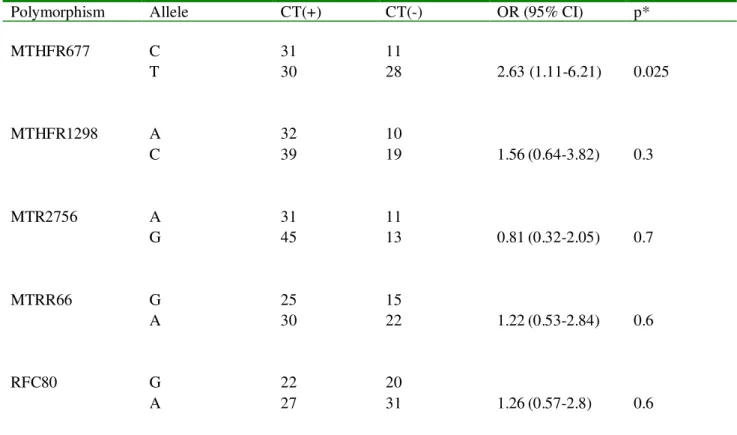
Table 15.Distribution of 1-carbon enzyme genotypes among CT (+) and CT (-) lung cancer patients II: Odds ratios ... 50
Table 16. One carbon enzyme allele distribution among CT-positive and -negative lung cancer patients. ... 51
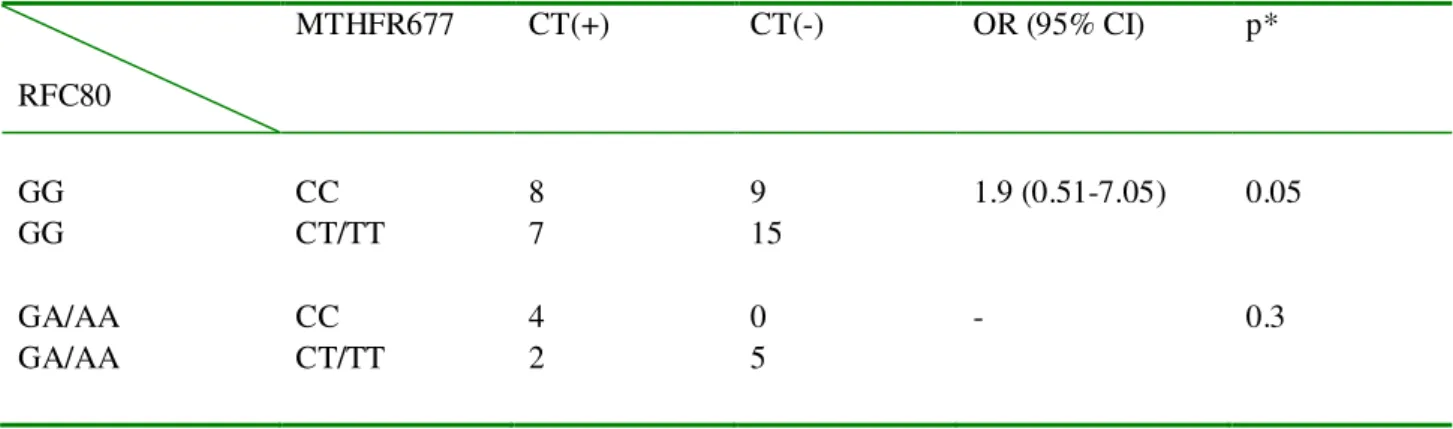
10 Table 17. CT expression associations with 1-carbon enzyme genotype combinations in lung
cancer patients I: MTHFR677 C>T and RFC80 G>A. ... 52
Table 18. CT expression associations with 1-carbon enzyme genotype combinations in lung cancer patients II: MTHFR1298 A>C and RFC80 G>A ... 53
Table 19. One carbon enzyme genotype associations in lung cancer patients ... 54
Table 20. Univariate power analysis* ... 55
Table 21. Multivariate power analysis* ... 56
Table 22. Genotype typing inconsistencies ... 59
Table 23. The microarray meta-analysis showing the average fold changes of gene expression for the listed genes in cancer. ... 70
Table 24 (Supplementary Table 1). The genotype data of the CT (+) lung cancer patients 81
11
List of Figures
Figure 1. CT gene expression is regulated by DNA methylation ... 18
Figure 2.The chemical structure of S-adenosylmethionine ... 19
Figure 3. The one carbon pathway. ... 21
Figure 4. RFPL analysis of RFC G80A polymorphism. ... 60
Figure 5. An exemplary Q-PCR melting-curve analysis. ... 62
Figure 6. A possible copy number variation in the MTRR A66G polymorphism .... 63
Figure 7. Proposed model I ... 67
Figure 8. Proposed model II ... 69
Figure 9. Q-PCR results showing the expression levels of TS ... 71
Supplementary Figure 1. RFLP results of the MTHFR C677T polymorphism ... 83
Supplementary Figure 2. RFLP results of the MTHFR A1298C polymorphism. ... 84
Supplementary Figure 3. RFLP results of the MTR A2756G polymorphism ... 85
Supplementary Figure 4. RFLP results of the MTRR A66G polymorphism ... 86
12
Abbreviations
DHF - Dihydrofolate MTA- Methylthioadenosine MTHFR- Methylenetetrahydrofolate reductase MTR – Methionine synthaseMTRR - Methionine synthase reductase RFC – Reduced Folate Carrier
RFLP – Restriction Fragment Length Polymorphism SAM – S-adenosyl methionine
SAH – S-adenosyl homocysteine SNP – Single nucleotide polymorphism THF - Tetrahydrofolate
13
CHAPTER1. INTRODUCTION
1.1 DNA methylation
The inheritance of information which is not based on DNA sequence is known as epigenetics [1]. DNA methylation is a crucial determinant in gene expression, DNA stability and chromatin modifications. The vitality of DNA methylation for vertebrates has not only been shown in embryonic lethality of DNA methyl transferase-1 (DNMT1) knockout mice, but also by its deregulation in various diseases, especially cancer [2]. DNA methylation is thought to be evolved to silence viral sequences and transposable elements as well as to regulate gene transcription [3]. DNA methylation is a heritable, tissue and cell specific modification of cytosine residues in CpG sequences. The methyl group can be attached at the N4 or C5 positions of the cytosine residues of prokaryotic or eukaryotic genomic DNA[4]. The distribution of the CpG residues in the genome is not equal, some regions such as the Alu repeats and transcription start sites contain a higher frequency of CpG residues than other regions [84].
Most of the mammalian genome consists of extended regions that are deficient for CpG’s. CpG residues are at 20% of their predicted frequency in the mammalian genome. This is thought to be a direct consequence of an increased mutation rate of the 5-methylcytosine residues found in CpG sequences from cytosine to thymine. Most methylated CpG’s are found in clusters, called a CpG island which corresponds to 1% of the human genome. The term CpG island refers to a 500 base pair window with an increased G:C content of at least 55%, and an observed to expected CpG frequency of at least 0.65. These islands may span the 5’ regions of approximately half of the human genes including exons, promoters and untranslated regions.
Up to 80% of all cytosine residues, which are not related to CpG islands, are normally methylated. In contrast, the CpG residues in CpG islands, especially at the gene promoter regions of actively transcribed genes, are usually unmethylated. The major genomic regions which have methylated CpG islands are the inactive X chromosome in female and silenced alleles of parentally imprinted genes [5]. The CpG methylation also occurs at the sites with a low frequency of CpG’s such as repeat DNA sites, heterochromatin, telomeres, non-coding regions and exons. Methylation of the “bulk” of the genome enables the silencing of these non-coding
14 regions, which prevents the transcription of repeat elements and parasitic DNA sequences. DNA methylation has also attracted a considerable interest in the cell differentiation and tissue specific gene expression process [6].
DNA methylation is a dynamic process in which involves DNA methyltransferases (Dnmt1, Dnmt3a and Dnmt3b), methyl-binding proteins, histone modifying enzymes, chromatin remodeling factors and their molecular complexes [84]. It has been previously shown that cyclical and dynamic methylation/demetylation of the CpG residues in a model containing the ps2 gene promoter occurs with the presence of MeCP2 (a methyl-binding protein), SWI/SNF (a histone remodeling complex), DNMT1 and DNMT3a and DNMT3b [7]. DNMT1 is responsible for the maintenance methylation of the genome after each round of replication. During the replication of eukaryotic genomic DNA, approximately 40 million CpG dinucleotides are converted into the hemimethylated state in the newly synthesized DNA strand. These hemimethylated CpG sites must be methylated precisely to maintain the original DNA methylation pattern. DNMT1 is located at the replication fork and methylates newly biosynthesized DNA strands directly after the replication. DNMT3a and DNMT3b methyltransferases methylate CpG dinucleotides without preference for hemimethylated DNA, and are responsible for the de novo methylation of DNA [8].
1.2 DNA Methylation and Cancer
For over a decade, abnormalities of DNA methylation in cancer cells have been recognized [9]. In cancer, the usual pattern of methylation is observed to be genomic hypomethylation and gene-specific hypermethylation. Hypermethylation, which is also related to transcriptional silencing, is a common mechanism for the inactivation of several tumor suppressor genes in cancer [10]. Methylations of such genes seem to occur early in carcinogenesis, and in some cases increasing progressively leading to malignant phenotypes [11]. Hypermethylation occurs not only at the promoter of tumor suppressor genes, but also at the promoter regions of other genes involved in cancer progression such as DNA repair, cell cycle regulation, apoptosis, hormonal response and cell adherence genes [12]. Previously, it has
15 been suggested that a tumor-type specific profile of DNA hypermethylation exists and thus allows us to use these hypermethylated loci as biomarkers of tumorigenesis [13], [11].
On the other hand, global DNA hypomethylation is also seen in early carcinogenesis [14]. It has been previously shown that DNA hypomethylation causes genomic instability, thus resulting in increased levels of DNA damage, mutation rates, copy number alterationd and loss of heterozygosity. Chen et al have shown that hypomethylation in murine embryonic stem cells lacking Dnmt1, at the same time significantly elevating mutation rates in two model genes [15]. It has been suggested that there is a direct correlation between the methylation capacity of the cell and genetic instability [16]. Abnormal DNA methylation has been associated with tumor aggressiveness and poor prognosis [17]. Precancerous cells showing aberrant DNA methylation profiles designate increased malignancy [18]. The reason for the instability of genomic DNA observed along DNAhypomethylation might be the lack of a splice variant of Dnmt3b which results in chromosomal instability through hypomethylation of pericentromeric satellite regions [19]. In addition, Dnmt1 over-expression observed in cancer cells has been observed to associate with increased CpG island methylation in a cancer-specific manner [19].
In normal cells, DNA methylation allows the condensation of the chromatin structure through the recruitment of the chromatin-organizing proteins such as histone remodeling complexes or polycomb group proteins [20]. In a DNA-hypomethylated cell, this arrangement is lost which results in chromatin decondensation and chromosomal rearrangements [21].
1.3 Cancer Testis (CT) Genes
CT genes are a group of genes which are consistently expressed in spermatogonia, oogonia and trophoblast cells, but not expressed in any other healthy tissues except cancer cells [22]. CT genes can be categorized as families based on sequence similary. Some families such as MAGE-A and SSX contain more than 8 members, while others like NY-ESO-1 consist of only two. As will be explained below, despite the dissimilarity of their sequences, there is overwhelming evidence that tumor-specific aberrant CT gene expression occurs in a coordinate fashion. More than half of 40 CT genes, so far identified, are located on the X chromosome [22],[23]. CT gene promoters (NY-ESO-1, MAGE-A1, SSX4 and SSX 7) lack a TATA box
16 [24], {unpublished data}. An interesting aspect of CT genes is that most of them are thought to have risen due to duplications [23] and thus, they are located juxtameric to each other forming gene clusters.
1.3.1 CT Gene Expression Regulation
Since CT genes are diverse, sequence-wise, it can be envisioned that they are possibly regulated via unique transcription factors. Yet, the fact that all CT genes, studied to date, are co-expressed, suggests the presence of a general mechanism behind their expression in cancer. DNA methylation is thought to be the major control mechanism for the expression and silencing of CT genes. This assumption was previously verified by a detailed analysis of the CpG islands of a model CT gene, MAGEA1 [24]. It has been shown that the critical CpG islands at the promoter region remain significantly methylated in vivo where the gene is not expressed [24]. Similary, expression of all other CT genes, studied to date, correlates with the demethylation of their promoter-proximal DNA regions [24](our unpublished data).
An example to such an experiment is detailed below SSX expression correlates with its methylation status. The southern blot figure below shows the change in expression of SSX genes, along with their methylation status (Figure 1). The general demethylation observed for the SSX gene region seems to occur in parallel to L1 repeat demetylation, which in turn, is considered to reflect the general methylation state of the genome.
The probes used in the assay were SSX 1, 2, 3, 4 and 5 (a mixture of SSX genes) and L1. SSX probe recognizes all of the SSX exons whereas L1 probe recognizes all of the L1 repeat sites. In this experiment, the genomic DNA from different cancer cell lines was cleaved by MspI and HspII enzymes. Then, the digested products were separated by agarose gel electrophoresis. Following the transfer of the DNA to the nitrocellulose membrane, the membrane wass exposed to a hybridization probe, a single DNA fragment with a specific sequence whose presence in the target DNA is to be determined. Then by autoradiography, the pattern of hybridization was visualized.
17 Both MspI and HspII cut at CCGG, yet MspI enzyme cuts DNA regardless of the methylation status while HspII cuts only the unmethylated DNA. Thus, the methylated SSX or L1 sequence will not be digested by HspII, as seen for the Calu-3 cell line. On the other hand, the unmethylated SSX or L1 sequences will be digested by HspII and, as observed for the SK-LC17 cell line. . In fact, for this cell line, the digestion pattern observed for the two enzymes is identical suggesting complete demetylation of SSX gene proximal CCGG sites. Below the southern blot figure, semi-quantitative PCR results show that the expression of SSX genes increase in parallel to the decrease of methylation within the SSX , as well as in L1 genomic DNA.
18 Figure 1. Southern blot and PCR showing the expression levels along with their methylation status of SSX genes and L1 repeats. Probes: SSX1 and L1. M: Msp1, H: HspII
Thus, there are many examples demonstrating a clear relationship between hypomethylation of genomic DNA and CT gene induction in cancer. CT genes can be upregulated by DNA methyl transferase inhibitors [25] and histone deacetylase inhibitors as well [22]. In 2005, Gure et al reported that in NSCLC (non-small cell lung cancer), CT gene expression is frequently observed. In the same study, CT genes were found to be coordinately expressed. Among 9 CT genes studied, expression of every single CT was found to correlate significantly with any other [26].
Moreover, CT genes were found to be significantly associated with less differentiated, higher grade of tumors, later stages of cancer and worse outcome. Larger tumor size and invasion capacity are also correlated with CT expression [26]. It was also observed that CT
19 expression increases as the tumors progress [26]. Therefore, one can presume that the hypomethylation observed in cancer cells causes demethylation in the promoter regions of CT genes, thus increasing their expression. . Most importantly, in the same study, overall survival of patients without (or with low levels of) CT gene expression was found to be significantly better than those with high level CT gene expression in their tumors. Thus, given this relationship, if the CT expression levels of tumors can be decreased, it can be hypothesized that this would result in improved survival. In this study, I have addressed this question with reference to the one-carbon pathway.
1.4 S-Adenosylmethionine: The universal methyl donor
S-adenosylmethionine (SAM) is a coenzyme involved in methyl group transfers. It is synthesized from ATP and methionine by methionine adenosyltransferase. In this reaction, the tri-phosphate group is cleaved from ATP and methionine is covalently attached. Figure 2 shows the chemical structure of SAM.
Figure 2.The chemical structure of S-adenosylmethionine. The methyl group attached to the sulfur atom is reactive and is donated to an acceptor, forming S-adenosylhomocysteine., adapted from [27].
The methyl group attached to the sulfur atom is chemically reactive and thus allows the donation of this methyl group to an acceptor substrate in the methylation reactions. The product
20 following these transmethylation reactions, is S-adenosylhomocysteine (SAH) is formed by the demethylation of SAM.
Since SAM is the only methyl donor in the cell, the efficiency of SAM production might possibly effect methylation reactions including DNA and histone methylation. A recent study showed that rats fed with a methyl-deficient diet displayed significantly reduced levels of SAM, reduced ratios of SAM to SAH (SAM’s more stable metabolite) and that this correlated with elevated levels of DNA hypomethylation [28]. Since CT gene expression is controlled by DNA methylation, a deficiency in SAM production could in turn be crucial in the regulation of CT genes. The low production of SAM might result in DNA hypomethylation, causing CT up-regulation and poor prognosis in cancer. For this reason, we have focused on the one carbon pathway in order to investigate the possible mechanisms which consequently results in reduced SAM production and DNA hypomethylation.
1.5 One carbon pathway
One carbon metabolism is an intervention of two pathways enabling the cross-talk between epigenetic and genetic processes, which involves DNA methylation and DNA synthesis. One carbon metabolism is vitally important for the maintenance of methionine cycle, nucleotide synthesis and biological methylation reactions. Folate is the most important input substrate utilized in the one carbon pathway. Folate is not only an essential co-factor for the de novo biosynthesis of purines and pyrimidines, it also plays an important role in DNA synthesis, stability and integrity [29]. Figure 3 summarizes those particular events in the one carbon pathway which we chose to focus on.
21 Diet Serum Folate
RFC
Folic Acid DHF THF 5-10-methylene THF 5-methylene THFMTHFR
Methionine HcyMTR
MTRR
B12 SAM Biological Methylation reactions SAH dUMP dTMPTS
DNA synthesisFigure 3. The one carbon pathway. Annotations: MTHFR- Methylenetetrahydrofolate reductase, MTRR-Methionine synthase reductase, MTR- MTRR-Methionine synthase, RFC- Reduced Folate Carrier, TS- Thymidylate synthase, DHF- Dihydrofolate, THF-Tetrahydrofolate, SAM- adenosylmethionine, SAH-
S-adenosylhomocysteine, Hcy- homocysteine
Folate may be gathered from two sources; either from foods or from blood by serum folate. Because folate cannot pass through the cell membrane when its glutamate tail is longer than 3, it is absorbed in the small intestine after the hydrolysis of polyglutamate chain by glutamate carboxypeptidase II (GCPII) [30]. Two receptors can transport folate from blood to into the cells. The folate receptor (FR), and the reduced folate carrier (RFC). The FR has a higher affinity for oxidized folate when compared to RFC. When taken into the cell, folate is first converted to dihydrofolate, and then to tetrahydrofolate (THF) by the enzyme dihydrofolate reductase (DHFR). The following reaction generates the origin of one carbon units by the breakage of β-carbon of
22 serine. In this reaction catalayzed by serine hydroxymethyltransferase (SHMT), THF is converted to N5-N10-methylene-THF while glycine is produced. N5-N10-methylene-THF is a crucial intermediate factor for the direction of the pathway [30].
For thymidine synthesis, deoxythymidylate monophosphate (dTMP) is synthesized from deoxyuridylate monophophate (dUMP) by thymidylate synthase (TS). TS transfers a methyl group from N5-N10-methylene-tetrahydrofolate. The non-reversible methylation of dUMP to dTMP results in the oxidation of N5-N10-methylene-THF to the inactive dihydrofolate, which can be converted back to THF by DHFR [31].
For de novo methionine biosynthesis and methylation reactions, methylene tetrahydrofolate reductase (MTHFR) converts N5-N10-methylene-THF to 5-methyl-THF. This step creates the only source of 5-methyl-THF in the one carbon pathway. Methionine synthase (MTR or MS), a cobalamin dependent enzyme which is activated by methionine synthase reductase (MTRR or MSR), transfers one methyl group from 5-methyl-THF in order to convert homocysteine (Hcy) into methionine. Dimethyl glycine is also produced from choline and betaine for methionine generation. Methionine synthesis ensures the provision of the universal methyl donor S-adenosyl methionine (SAM), with the activation of methionine by methionine adenosyl transferase and ATP. SAM is used to methylate more than 80 important biomolecules such as DNA, RNA, and proteins including histones. During this process, SAM is converted into S-adenosyl-homocysteine (SAH), which is either hydrolyzed to homocysteine (Hcy) to initiate a new remethylation cycle or transsulphurated to cysteine by cystathionine β-synthase [30].
In a cell, every methylation process requires a methyl group transfer from SAM. All of the metabolic methylation reactions are under the effect of SAM, which directs the utilization of Hcy and indicates the level of methylation. As explained before, the SAM/SAH ratio in a cell determines the cellular methylation potential. SAH is known to be an inhibitor of methyltransferases [23]. The level of SAM in the cell is regulated by two mechanisms. First of all, SAM suppresses the synthesis of N5-methylene-THF by inhibiting the MTHFR enzyme. Thus, methionine level and therefore Hcy level decreases when SAM increases. On the other hand, homocysteine can also be converted to methionine through SAH hydrolase. Therefore, N5
-23 methylene-THF is an important molecule determining the pathway between remethylation and transsulphuration reactions. If there is sufficient N5-methylene-THF entering the methylation pathway, the direction of the SAH favors cysteine synthesis; if not, SAH is used to produce methionine [32]. The source of N5-methylene-THF is folate acquired by diet. Folate, as well as B12 and B6 vitamins, which function as co-enzymes for MTR and cysthation synthase,
respectively, regulate the homocysteine removal and in turn, prevent SAH accumulation [33].
1.6 Folate deficiency and DNA damage
There is accumulating evidence that folate deficiency, either due to low dietary folate intake or due to low blood folate levels, is related to tumorigenesis [1]. Perturbations of the one carbon metabolism are thus, thought to play vital roles in neoplastic development by affecting gene regulation through DNA methylation and genome integrity through DNA synthesis and repair [34].Folate deficiency has been shown to induce hepatocellular carcinoma development in rats [1]. Diets deficient in various methyl donor groups (folic acid, choline, methionine and vitamin B12) have been shown to induce DNA hypomethylation, site-specific DNA
hypermethylation, double strand breaks, and upregulation of DNMT’s [1].
Low dietary folate intake is strongly associated with DNA damage through uracil misincorporation or by DNA hypomethylation leading to genome instability [35]. Decreased cytosolic levels of N5-N10-methylene-THF caused by low folate status decreases the dTMP synthesis and increase the dUMP/dTMP ratio [35]. The increase of uracil pool in the cell elevates the rate of DNA-polymerase-mediated dUTP misincorporation into the DNA [36]. Uracil is excised from DNA by uracil-DNA glycosylase and apyrimidinic endonuclease, generating nicks which will be ligated by DNA ligase. However, if these nicks (single strand breaks) are located on two opposite strands, less repairable and hazardous double strand breaks may form. Uracil mediated double strand breakage is the major cause of deletions, duplications, chromosome breaks, micronucleus formation, chromatid recombinations, fragile sites and translocations which play important roles in tumorigenesis [35]. In cell culture, folate depletion can increase the
24 intracellular dUMP/dTMP ratio up to 10 fold. Folate depletion induced DNA breakage has been observed in lymphocytes and rodent cell lines in vitro [37], [38].
Decreasing folate levels can cause upregulation of DNA damage and cell cycle checkpoint related genes such as p53, p16 and p21 as well [37]. The normal levels of dNTPs for normal DNA/RNA synthesis are directly dependent on intracellular folate availability. Maintenance of folate concentration from diet or supplements is correlated with a protective effect and reduced incidence of number of cancers [39].
On the other hand, genomic instability caused by global hypomethylation is characterized by an elevated rate of DNA sequence changes, aneuploidy, chromosome translocations and gene amplifications [40]. A balance between the two critical reactions (methylation and DNA synthesis/repair) must be reached so one does not compromise the other [41].
1.7 One carbon pathway enzyme variants
Table 1 summarizes studies where polymorphic variants of the one carbon pathway enzyme activities were investigated utilizing various assays. From the enzymatic activity data obtained from the literature, one can infer that the variations of the enzymes partaking in SAM generation can create disturbances in the methylation process.
1.7.1 Methylenetetrahydrofolate reductase (MTHFR)
All four enzymes which I focused on in this study have allelic variants in the population and are associated with cancer. Different studies have focused on each of these alleles individually, despite the possibility that the net cumulative effect of various alleles is what ultimately determines SAM production efficiency. A large number of allelic variants of the one carbon pathway enzymes described. For example, there are 65 SNPs found on the MTHFR. However, among these, only 10 are gene non-synonymous SNPs that are found in more than
25 10% of the population are only 2 for MTHFR [42]. For some of these alleles, an association with decreased enzymatic activity has been described [42], (Table 1). Cancer risk generally has been linked to such hypomorphic alleles of one carbon pathway enzymes [33]. The major variant of the MTHFR gene, C677T transition (rs1801133), resulting in an Ala to Val change in aa.222, was found to decrease the activity of the MTHFR enzyme by %70 [43], (Table 1). This common variant of the MTHFR gene is associated with an increased risk of cancer [44]. MTHFR 677 TT homozygosity causes a significant increase in the homocysteine levels and DNA hypomethylation when compared to the wild-type allele [45].
Apart from the C677T transition, A1298C transition (rs1801131), converting Glu 429 to Ala, of the MTHFR enzyme causes a 15% reduction in the activity and results in increased levels of plasma homocysteine levels [45], Table 1. The impaired activity of MTHFR, especially along with the low folate status, results in less production of N5-methylene-THF and methionine, thus proceeds to hypomethylation [45]. In another study, carriers of A1298C polymorphism do not appear to have high levels of plasma Hcy (Table 1) but have a lesser degree of MTHFR activity reduction compared to C677T variants, when tested by biochemical assays [46]. However, when combined with other variants, A1298C polymorphism becomes effective in determining the Hcy and folate levels. Individuals heterozygote for both alleles for both the C677T and A1298C variants have significantly increased plasma Hcy levels when compared to 677 CC / 1298 AA homozygotes [47]. Although in several studies, the 677TT variant of MTHFR was found preferentially associated with cancer [48], in other studies, this variant was found to reduce cancer risk by directing the pathway to thymidine synthesis and thus preventing uracil accumulation [49]. In the MTHFR gene, as high as 65 SNP’s exist in a population of 240 individuals. Interestingly, the combinations of different polymorphisms in the gene coding MTHFR result in an additive effect of reduction in the enzyme activity [42]. So, it becomes an important aspect to study the polymorphisms collectively to overcome the possibility of missing the effect of a polymorphism that can be observed only when within the context of a particular genotype.
26 1.7.2 Methionine synthase reductase (MTRR)
Methionine synthase reductase (MTRR), an intermediate methyl carrier during the remethylation of Hcy to methionine, may be another important determinant of SAM production. In the past decade, an A to G polymorphism (A66G) in the 66th base pair (rs1801394), resulting in an isoleucine to methionine substitution in the 22nd aminoacid, was found to be associated with neural tube defects and cancer, especially in the absence of B12 vitamin and in the presence
of the MTHFR C677T variant [48],[50]. In one study where a biochemical assay was used, demonstrated that the 66 GG variant of the MTRR enzyme had only 25% enzymatic activity compared to the wild-type protein [51], (Table 1). This low enzymatic activity results in an inefficient production of SAM [52]. This is likely due to the decreased capacity of MTRR to activate MTR, in turn would lead to impaired production of methionine from Hcy. Not independently, but when combined with the 677T MTHFR variant, a cell carrying the MTRR 66G variant will have a lower capacity of remethylation, which will direct to DNA hypomethylation, instability and damage [48].
1.7.3 Methionine synthase (MTR)
A variation in the methionine synthase (MTR) enzyme (A2756G), which results in a subsitution of aspartic acid to glycine in the 919th aminoacid, also decreases the rate of methylation of Hcy to methionine (rs1805087). Although an increased plasma Hcy concentration is not observed in neural tube defect patients carrying the hypomorphic allele, it is thought to have an additive effect along with other variants of other enzymes, and especially the MTRR variants [53]. This aspartic acid to glycine substitution occurs in the vicinity of the binding domain of vitamin B12 of the MTR [54]. It was observed that plasma homocysteine levels are
lower in MTR 2756 GG individuals when compared to the more common AA genotype [48], (Table 1).
27 1.7.4 Reduced Folate Carrier (RFC)
Another important variant in the one carbon pathway is in the reduced folate carrier (RFC) enzyme. The RFC gene codes an integral membrane protein which intakes the folate into the cell. A guanine to adenine transition (rs1051266) at the 80th base pair (G80A) of RFC is related to a moderate degree of elevated plasma Hcy and plasma folate levels [55]. This arginine to histidine transition results in a higher affinity of RFC for folate impairing its subsequent intracellular release [55]. A recent study pointed out that this polymorphism reduces N5 -methyl-tetrahydrofolate transport efficiency to 54% compared to the wild-type allele [56], (Table 1).
1.7.5 Thymidylate synthase (TYMS)
The enhancer region of the thymidylate synthase gene contains a number of 28-base-pair tandem repeats. These repeats are either two repeats or three repeats, while three repeats occurring most frequently. The triple repeat has been associated with a 2.6 fold increase in the expression of TYMS [57]. One study showed that 3rpt/3rpt subjects have lower plasma folate and higher plasma Hcy levels than those with other genotypes [58]. This tandem repeat polymorphism, combined with reduced folate intake, has been associated with lung adenocarcinomas, [59]. Conversely, among those individuals with the 3rpt/3rpt genotype, higher folate intake was correlated with a 50% reduced risk of cancer [60].On the other hand, in individuals carrying a 2rpt/2rpt genotype, higher folate intake is correlated with a 50% increased cancer risk [60].Similar results were shown for vitamin B12, but not with vitamin B6, methionine
28 Table 1.The one-carbon pathway enzyme allele activity differences*.
Enzymatic activity Assay Genotypes Reference
CC CT TT MTHFR C677T Micobiological 100% 65% 30% [53] Biochemical 100% 55% [42] RBC folate 100% 90% 82% [61] RBC folate 100% 90% 112% [45] Plasma folate 100% 96% 75% [45] Total Hcy 100% 101% 121% [55] Total Hcy 100% 108% 123% [45] DNA hypomethylation 100% 98% 121% [45] CpG Hypermethylation 100% 82% 28% [62] MTHFR A1298C AA AC CC Biochemical 100% 102% [42] Plasma folate 100% 112% 114% [46] Plasma folate 100% 110% 107% [45] Total Hcy 100% 75% 77% [46] Total Hcy 100% 90% 115% [45]
Genomic DNA methylation 100% 231% 182% [46]
DNA hypomethylation 100% 102% 119% [45] CpG Hypermethylation 100% 107% 24% [62] MTR A2756G AA AG GG CpG Hypermethylation 100% 28% 3% [62] AA AG GG MTRR A66G Biochemical 100% 25% [51] GG GA AA
RFC G80A Plasma (total) Hcy 100% 103% 124% [55]
5-CHO-mH4F transport 100% 57% [56]
*Bold numbers show differences that were found to be statistically significant 1.8 Cancer and one carbon pathway enzyme variants
Epidemiologic studies where these alleles were studied individually and in pairs, suggested that they could be associated with cancer. Additive and synergistic effects of one carbon pathway enzyme variants and related dietary factors, such as folic acid and methionine
29 consumption, are complex and in order to clarify the association of each allelic variant with cancer, these, as well as their interactions with dietary factors need to be studies carefully. On the basis of functional effects of these polymorphic variants, there ought to be a correlation between the incidence of cancer and the hypoactive alleles of these enzymes.
However, there seems to be an inverse association between the MTHFR 677TT and cancer, especially in situations with sufficient folate intake [49]. A study has shown that the 2rpt/2rpt phenotype of TYMS and MTHFR 677 TT together result in a statistically decreased risk of hepatocellular carcinoma [41], MTHFR 677TT and 1298CC, together, are also associated with a reduced risk of cancer [41]. It seems likely that in folate deficiency, MTHFR 677TT becomes almost totally incapable of producing N5-methylene-THF and thus, these cells have an impaired methylation capacity [52]. On the other hand, even when there is sufficient folate in the one carbon pool, the hypomorphic MTHFR protein will not be able to convert N5-N10 -methylene-THF effectively; so, TYMS will use it for thymidine synthesis. One can envision that because this will prevent the accumulation of uracil and therefore, prevent uracil misincorporation, the “T” allele will protect against tumorigenesis by avoiding DNA damage caused by dUMP. In contrast, the TT allele was also shown to increase the cancer risk by 2.64 fold in folate deficiency and 1.6 fold in folate sufficiency [44]. Friso et al have shown that the MTHFR 677 TT allele associates with a significantly lower level of methyl cytosine in DNA, when compared to 677 CC and CT tissues, but only under conditions of low folate status [63]. At higher folate levels, the methyl cytosine levels did not differ from that among the 677 “CC” individuals [63]. That the 677 TT individuals have low levels of methyl cytosine in their DNA and elevated levels of plasma Hcy suggests that the MTHFR TT allele results in insufficient amounts of N5-methylene-THF that can’t meet the demands for the de novo methylation. In another study, the MTHFR 677TT and the MTRR 66GG variant combination showed the highest amount of DNA damage, calculated by micronucleus formation [47]. Vaughn et al showed that the MTRR alleles have no effect on plasma folate and plasma vitamin B12, in the presence of a 677 CC or CT allele. However, in those individuals homozygous for the 677 T allele, the existence of MTRR AG or GG allele resulted in a significant increase in plasma homocysteine
30 levels [64]. This observation suggests that the functional MTRR 66 A/A allele compensates for a hypoactive MTHFR 677 TT allele.
It is worthwhile to point out that the association of MTHFR 677 variants is different in different stages and types of cancer. While the 677 CC and CT alleles are related to a reduced risk in renal cell carcionoma [65], they are related to an elevated risk in colorectal cancer [48]]. The effect may be different at different stages of the oncogenesis process. Supporting this is the observation that folate deficiency predisposes to colon cancer, but once neoplastic lesions are present, folate supplementation actually accelerates colon cancer transformation {Kim, 2003}. Folate supplementation after a certain stage of tumorigenesis may enhance DNA synthesis in an already transformed cell.
In a study implemented by Chango et al, the RFC allele does not seem to affect plasma homocysteine levels when the MTHFR 677 allele is CC or CT. However, in the presence of the 677 TT allele, RFC GA and AA will influence the utilization of folate [55].
It is a challenging task to determine whether uracil misincorporation or errors in methylation process causes oncogenesis. Moreover, how the genes in the one carbon metabolism respond to folate deficiency is largely unknown. For instance, in the HCT116 cell line, folate deficiency appeared to preferentially shuttle the flow of one carbon units to the methionine cycle to protect methylation reactions and thereby suppress DNA synthesis. However in Caco2 cells in the same experimental setup, the metabolic priority in response to folate depletion was to shuttle the available folate pools to the nucleotide biosynthesis pathway at the expense of the methionine cycle[31].
The studies of the one carbon pathway enzyme variants suggest that folate has an important role in modulating epigenetic features of the DNA that controls gene expression [66]. Since the end product of the one carbon pathway, S-adenosylmethionine, will be utilized for the de novo methylation of DNA, the efficiency of the production of SAM will affect gene expression via DNA methylation. Folate depletion is thought to cause tumorigenesis either by impairing methylation or by hindering DNA synthesis {Kim, 2003}. When the effects of one the
31 carbon metabolism enzymes are combined with the effects of low folate intake, significant results on the alterations of DNA methylation are obtained suggesting the roles of both events.
.
1.9 The aim of the study
The role of DNA methylation in differentiation, disease and tissue specific gene expression has received considerable attention. In many circumstances, DNA methylation can on its own be an effective mechanism for gene silencing [24]. Methylated silent genes can be re-activated by using demethylating agents [67]. It has been proposed that the methylation of CpG sites at gene promoter regions inhibits the recruitment of the transcription machinery and thus strongly represses the expression [24]. DNA methylation is proposed to be the basic mechanism for the regulation of CT genes such as MAGE [24] and SSX (Gure, 2005}. Interestingly, spermatogonia cells undergo epigenetic reprogramming, which involves genomic hypomethylation [68].
Since genomic hypomethylation causes an increase in CT expression which is associated with developed stages of cancer and poor outcome (Gure, 2005}, the reversal of the genomic hypomethylation might improve prognosis. Because the methylation process requires the effective production of SAM by the one carbon pathway, we decided to investigate the relationship between CT gene expression and the allelic variants of the one carbon pathway, which we think are the primary effectors of SAM production.
It is already known that a variety of enzyme variants in the one carbon pathway cause perturbations in the methylation cycle. Several epidemiologic studies have shown that variants of one carbon pathway enzymes are correlated with oncogenesis in different ways [69]. One can envision that the perturbations of the one carbon pathway hindering the methylation capacity of the cell may result in an additive effect resulting in DNA hypomethylation and might lead thus, to CT positivity and poor prognosis. We hypothesized that there could be a correlation between the allelic variants of the one carbon pathway enzymes and CT expression. The importance of such correlation would be that if CT positivity can be predicted by the allele variants a cancer
32 patient, the possible conversion of high CT expression to a low state by the addition of dietary supplements such as folic acid could improve the prognosis of the patient.
One can envision that typing for the one carbon enzyme alleles among individuals who have a high-risk of developing cancer might help us suggest precautions towards restoring the patient’s impaired methylation capacity, such as the fortification or the supplementation of the diet by folic acid.
In this study, I determined the one carbon pathway enzyme genotypes of lung cancer tumors and cell lines, and studied the correlation of these genotypes with CT expression levels. The allelic variants I chose to study were the non-synonymous, highly prevalent and for which there were a large number of epidemiologic studies indicating a correlation with cancer. The selected variants include MTHFR C677T, MTHFR A1298C, MTRR A66G, MTR A2756G and RFC G80A single nucleotide polymorphisms.
I, thus, determined the one carbon enzyme genotypes of individuals who were previously typed for CT expression, using the restriction fragment length polymorphism assay (RFLP). In this method, the region containing the single nucleotide polymorphism (SNP) is amplified by PCR. The PCR product is subsequently digested with a specific endonuclease, which can recognize and cut DNA wherever a specific short sequence exists. This process is called a restriction digestion. This method can only be used if the allelic variant can be distinguished by a specific restriction endonuclease. Thus, restriction enzymes were selected such that the PCR product of one allele would be digested whereas the other allele would not. When the digestion products are analyzed by agarose gel electrophoresis, the allele is determined according to the molecular weights of the digestion products.
In summary, apart from many epigenetic mechanisms which may be perturbed in cancer, DNA hypomethylation seem to be the major actor for the ectopic expression of CT genes. By elucidating the underlying mechanisms which might thus cause CT expression, we potentially will have described a novel biomarker useful for the determination of tumorigenesis as well as improving the prognosis and lifespan of a cancer patient.
33
CHAPTER 2. MATERIALS AND METHODS
2.1 The PCR Method
The standart reaction mixture contained 1µg of genomic DNA, 1µl of 10mM dNTP mix (Finnzymes, Cat. No: F-506L), 2µl of 25mM primer mix, 2.5 µl of 10X Buffer (Finnzymes Dnazyme II HotStart Reaction Buffer, Cat. No: F-522), 0.5 µl Hot Start Taq Polymerase (Finnzymes, Cat. No: F-504L) added up to 25 µl with ddH2O. Then, the tubes are transferred to
the Perkin Elmer (PE9700) thermal cycler for 35 cycles. Before the reaction, initial denaturation was performed at 94 oC for 10mins. Each cycle consisted of 30sec at 94 oC, 30sec at Tm oC, and 30 sec at 72 oC. Then, the mixture was incubated at 72 oC for 7mins for final annealing and a final hold of 4 oC. See Table 2 for primer pairs, Tm values and Table 3 for nested primers.
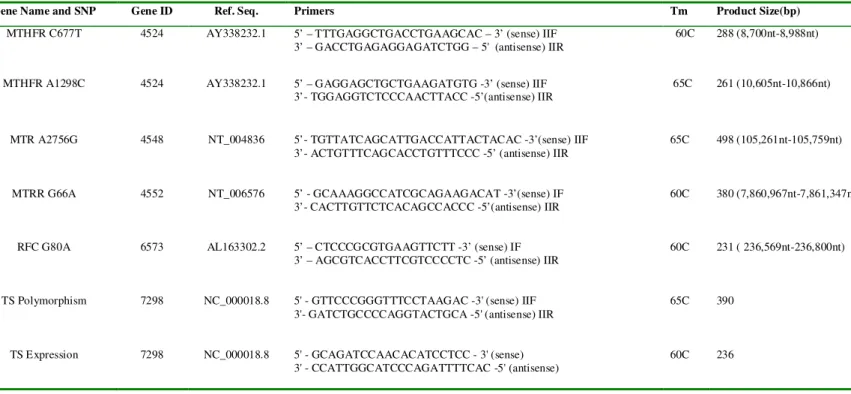
Table 2. PCR primers used for RFLP analysis
Gene Name and SNP Gene ID Ref. Seq. Primers Tm Product Size(bp)
MTHFR C677T 4524 AY338232.1 5’ – TTTGAGGCTGACCTGAAGCAC – 3’ (sense) IIF 3’ – GACCTGAGAGGAGATCTGG – 5' (antisense) IIR
60C 288 (8,700nt-8,988nt)
MTHFR A1298C 4524 AY338232.1 5’ – GAGGAGCTGCTGAAGATGTG -3’ (sense) IIF 3’- TGGAGGTCTCCCAACTTACC -5’(antisense) IIR
65C 261 (10,605nt-10,866nt)
MTR A2756G 4548 NT_004836 5’- TGTTATCAGCATTGACCATTACTACAC -3’(sense) IIF 3’- ACTGTTTCAGCACCTGTTTCCC -5’ (antisense) IIR
65C 498 (105,261nt-105,759nt)
MTRR G66A 4552 NT_006576 5’ - GCAAAGGCCATCGCAGAAGACAT -3’(sense) IF 3’- CACTTGTTCTCACAGCCACCC -5’(antisense) IIR
60C 380 (7,860,967nt-7,861,347nt)
RFC G80A 6573 AL163302.2 5’ – CTCCCGCGTGAAGTTCTT -3’ (sense) IF 3’ – AGCGTCACCTTCGTCCCCTC -5’ (antisense) IIR
60C 231 ( 236,569nt-236,800nt)
TS Polymorphism 7298 NC_000018.8 5' - GTTCCCGGGTTTCCTAAGAC -3' (sense) IIF 3'- GATCTGCCCCAGGTACTGCA -5' (antisense) IIR
65C 390
TS Expression 7298 NC_000018.8 5' - GCAGATCCAACACATCCTCC - 3' (sense) 3' - CCATTGGCATCCCAGATTTTCAC -5' (antisense)
34 Table 3. Nested PCR primers used for RFLP analysis
Gene Name and
SNP Ref. Seq. Nested Primers Product size (bp) nested Tm
MTHFR C677T AY338232.1 5’- TGAAGGAGAAGGTGTCTGCGGGA – 3’ (sense nested) IF 3’- AGGACGGTGCGGTGAGAGTG -5’ (antisense nested) IR
198 (8723nt-8921nt) 60oC
MTHFR A1298C AY338232.1 5’ – GAGGAGCTGACCAGTGAAG -3’(sense nested) IF 3’- GGTAAGTTGGGAGACCTCCA -5’ (antisense nested) IR
136 (10.629nt-10.765nt) 60oC
MTR A2756G NT_004836 5’- TGTTCCCAGCTGTTAGATGAAAATC -3’(sense nested) IF 3’- GATCCAAAGCCTTTTACACTCCTC – 5’(antisense nested) IR
211(105.334nt-105.545nt)
65oC
MTRR G66A NT_006576 3’-GTGAAGATCTGCAGAAAATCCATGTA -5’(antisense nested) IR* 66bp (7,860,967nt-7,861,032nt)
60oC
RFC G80A AL163302.2 5’- AGCCGTAGAAGCAAAGGTAGC – 3’(sense nested) IIF 3’ – TGCATTCGTCTCCAGGGTG – 5’(antisense nested) IR
154bp (236,646nt-236,667nt)
55oC
TS NC_000018.8 5'-AGCAGGAAGAGGCGGAGC-3'(sense nested) 3'- CCGGCCACAGGCATG -5'(antisense nested)
172bp 60oC
*The 5’(forward) nested primer used for MTRR was identical to that shown in Table 2.
2.2 DNA Samples
Tumor samples from 763 lung cancer patients were previously collected and typed for CT expression (Gure, 2005). All of the samples were scored for the positivity of CT expression. The scores corresponding to different expression levels of each CT gene ranged between a negative (-) to three positives (+++). We then selected, genomic DNA prepared from these tumor samples with the highest and the lowest amount of CT expression and used them for one carbon pathway allele genotype analysis. Table 4 shows the label, cancer type and the CT expression scores of the samples. Table 4a and Table 4b the CT(+) and CT (-) lung cancer samples used to for this study respectively.
35 Table 4. CT gene expression profile of CT (+) tumor samples
Lu CT(+) HISTOLOGY NY-ESO-1 LAGE-1 MAGE-A1 MAGE-A3 MAGE-A4 MAGE-A10 CT-7 SSX-2 SSX-4
31 SQCC (+++) (+/-) (+) (+++) (+++) (+) 68 Adeno (+++) (+) (+) (-) 87 Adeno (-) (-) (+++) (+++) (+++) 89 Adeno (+++) (+++) (+++) (+++) (+/-) (+) (+/-) 111 Lgcell (-) (-) (+++) (+++) (+++) (+++) 131 SQCC (+++) (+/-) (+) (+++) (+++) 168 SQCC (+++) (+++) (+++) (+++) (+++) (+) 185 NSCLC (+++) (+++) (+++) (+++) (+/-) (-) (-) (++) (-) 186 Adeno (+++) (+++) (+++) 219 SQCC (+) (+) (+++) (+++) (+++) (-) (+/-) (+++) 223 SQCC (+++) (+++) (+++) (-) 649 AdenoBAC (+++) (+/-) (+++) (+++) (+/-) (+++) (-) (-) 652 SQCC (+++) (+++) (+++) (+++) (+++) (+++) (-) (-) 658 AdenoBAC (+/-) (+++) (+++) (+++) (+++) (+/-) (+++) 726 Adeno (+++) (+++) (+++) (+++) (+++) (+++) (++) (+++) 736 Adeno (+++) (+++) (+++) (+++) (+++) (+++) (+/-) (-) 739 Lgcell (+++) (+++) (+++) (+++) (+++) (+++) (++) (+++) 745 SQCC (+++) (+++) (+++) (+++) (+++) (+/-) (++) (-) 752 (+++) (+++) (+++) (+++) (+++) (+/-) (-) (-) 753 (++) (+/-) (+++) (+++) (+++) (+/-) (-) 759 (+++) (+++) (+++) (+++) (+++) (+/-) (-)
36 Table 5. CT gene expression profile of CT(-) tumor samples
Lu CT(-) HISTOLOGY NY-ESO-1 LAGE-1 MAGE-A1 MAGE-A3 MAGE-A4 MAGE-A10 CT-7 SSX-2 SSX-4
69 BAC (-) (-) (-) (-) (-) 77 SQCC (-) (-) (-) (-) (-) 88 Adeno (-) (-) (-) (-) (-) 90 Adeno (-) (-) (-) (-) (-) 108 Adeno (-) (-) (-) (-) (-) 110 Adeno (-) (-) (-) (-) (-) 112 SQCC (-) (-) (-) (-) (-) 180 Adeno (-) (-) (-) (-) (-) (-) (-) 183 BAC (-) (-) (-) (-) (-) (-) (-) 191 Adeno (-) (-) (-) (-) (-) (-) 221 Adeno (-) (-) (-) (-) (-) 225 Adeno (-) (-) (-) (-) (-) (-) (-) (-) 639 AdenoBAC (-) (-) (-) (-) (-) (-) (-) 656 AdenoBAC (-) (-) (-) (-) (-) (-) 657 SQCC (-) (-) (-) (-) (-) (-) 670 AdenoBAC (-) (-) (-) (-) (-) (-) 692 AdenoBAC (-) (-) (-) (-) (-) (-) (-) (-) 693 (-) (-) (-) (-) (-) (-) (-) (-) 694 (-) (-) (-) (-) (-) (-) (-) (-) 698 Adeno (-) (-) (-) (-) (-) (-) (-) (-) 706 Adeno (-) (-) (-) (-) (-) (-) (-) (-) 707 Adeno (-) (-) (-) (-) (-) (-) (-) (-) 713 AdenoBAC (-) (-) (-) (-) (-) (-) (-) (-) 716 Adeno (-) (-) (-) (-) (-) (-) (-) (-) 718 AdenoBAC (-) (-) (-) (-) (-) (-) (-) (-) 728 AdenoBAC (-) (-) (-) (-) (-) (-) (-) (-) 748 AdenoBAC (-) (-) (-) (-) (-) (-) (-) (-) 749 Adeno (-) (-) (-) (-) (-) (-) (-) (-) 751 AdenoBAC (-) (-) (-) (-) (-) (-) (-) (-) 763 (-) (-) (-) (-) (-) (-)
37 RFLP analysis was done as previously described [43]. Following the PCR reaction, 5 µl of PCR product was mixed with 1 µl of restriction endonuclease enzyme (New England Biolabs), 1 µl of Buffer 2 (New England Biolabs), added up to 10 µl with ddH2O. The mixture
was incubated at 37oC overnight. Table 4 shows the expected sizes of the digestion products for each primer pair.
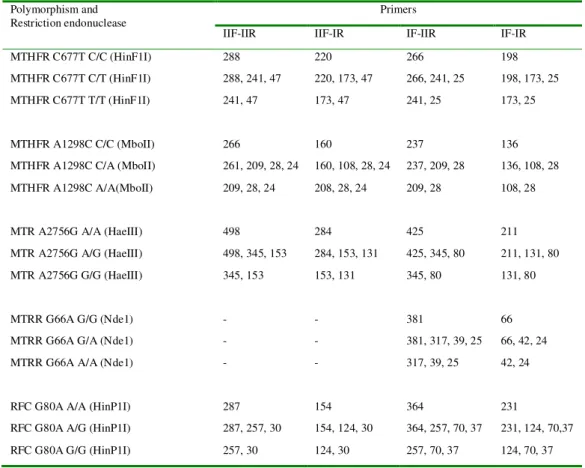
Table 6. Expected RFLP product sizes Polymorphism and
Restriction endonuclease
Primers
IIF-IIR IIF-IR IF-IIR IF-IR MTHFR C677T C/C (HinF1I) 288 220 266 198 MTHFR C677T C/T (HinF1I) 288, 241, 47 220, 173, 47 266, 241, 25 198, 173, 25 MTHFR C677T T/T (HinF1I) 241, 47 173, 47 241, 25 173, 25
MTHFR A1298C C/C (MboII) 266 160 237 136 MTHFR A1298C C/A (MboII) 261, 209, 28, 24 160, 108, 28, 24 237, 209, 28 136, 108, 28 MTHFR A1298C A/A(MboII) 209, 28, 24 208, 28, 24 209, 28 108, 28
MTR A2756G A/A (HaeIII) 498 284 425 211 MTR A2756G A/G (HaeIII) 498, 345, 153 284, 153, 131 425, 345, 80 211, 131, 80 MTR A2756G G/G (HaeIII) 345, 153 153, 131 345, 80 131, 80
MTRR G66A G/G (Nde1) - - 381 66
MTRR G66A G/A (Nde1) - - 381, 317, 39, 25 66, 42, 24 MTRR G66A A/A (Nde1) - - 317, 39, 25 42, 24
RFC G80A A/A (HinP1I) 287 154 364 231
RFC G80A A/G (HinP1I) 287, 257, 30 154, 124, 30 364, 257, 70, 37 231, 124, 70,37 RFC G80A G/G (HinP1I) 257, 30 124, 30 257, 70, 37 124, 70, 37
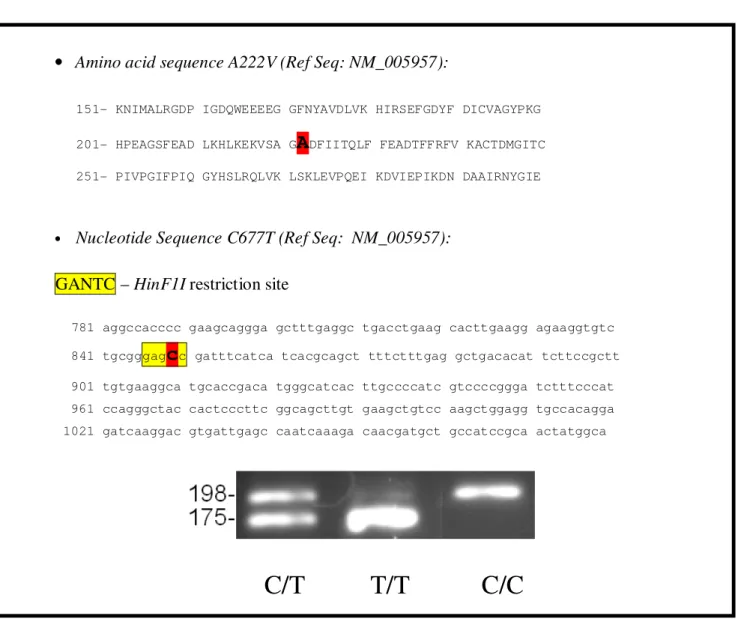
38 2.3.1.1 MTHFR C677T
The MTHFR C677T polymorphism creates a HinF1I restriction site. Table 6 shows the transition of the protein and the nucleotide sequence and the digestion products of all alleles. Upon digestion, HinF1I will be able to cut the “T” allele whereas the “C” allele will remain uncut.
Table 7. A222V (C677T) variant of the MTHFR gene
• Amino acid sequence A222V (Ref Seq: NM_005957):
151- KNIMALRGDP IGDQWEEEEG GFNYAVDLVK HIRSEFGDYF DICVAGYPKG 201- HPEAGSFEAD LKHLKEKVSA G
A
DFIITQLF FEADTFFRFV KACTDMGITC251- PIVPGIFPIQ GYHSLRQLVK LSKLEVPQEI KDVIEPIKDN DAAIRNYGIE
• Nucleotide Sequence C677T (Ref Seq: NM_005957):
GANTC – HinF1I restriction site
781 aggccacccc gaagcaggga gctttgaggc tgacctgaag cacttgaagg agaaggtgtc 841 tgcgggag
c
c gatttcatca tcacgcagct tttctttgag gctgacacat tcttccgctt901 tgtgaaggca tgcaccgaca tgggcatcac ttgccccatc gtccccggga tctttcccat 961 ccagggctac cactcccttc ggcagcttgt gaagctgtcc aagctggagg tgccacagga 1021 gatcaaggac gtgattgagc caatcaaaga caacgatgct gccatccgca actatggca
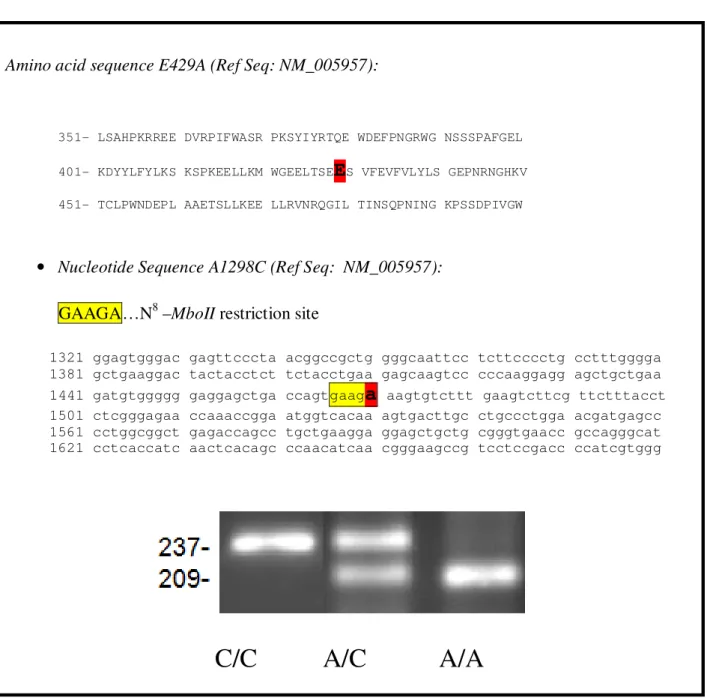
39 2.3.1.2 MTHFR A1298C
Upon the transition of adenine to cytosine at the 1298th position of the MTHFR gene, the recognition site of the MboII enzyme becomes abolished. Therefore, the undigested products will indicate the presence of an “C” allele whereas the “A” allele will result in digestion. The amino acid and the nucleotide alterations are designated in Table 7.
Table 8.E429A (A1298C) variant of the MTHFR gene
Amino acid sequence E429A (Ref Seq: NM_005957):
351- LSAHPKRREE DVRPIFWASR PKSYIYRTQE WDEFPNGRWG NSSSPAFGEL 401- KDYYLFYLKS KSPKEELLKM WGEELTSE
E
S VFEVFVLYLS GEPNRNGHKV451- TCLPWNDEPL AAETSLLKEE LLRVNRQGIL TINSQPNING KPSSDPIVGW
• Nucleotide Sequence A1298C (Ref Seq: NM_005957):
GAAGA…N8 –MboII restriction site
1321 ggagtgggac gagttcccta acggccgctg gggcaattcc tcttcccctg cctttgggga 1381 gctgaaggac tactacctct tctacctgaa gagcaagtcc cccaaggagg agctgctgaa 1441 gatgtggggg gaggagctga ccagtgaag
a
aagtgtcttt gaagtcttcg ttctttacct 1501 ctcgggagaa ccaaaccgga atggtcacaa agtgacttgc ctgccctgga acgatgagcc 1561 cctggcggct gagaccagcc tgctgaagga ggagctgctg cgggtgaacc gccagggcat 1621 cctcaccatc aactcacagc ccaacatcaa cgggaagccg tcctccgacc ccatcgtggg
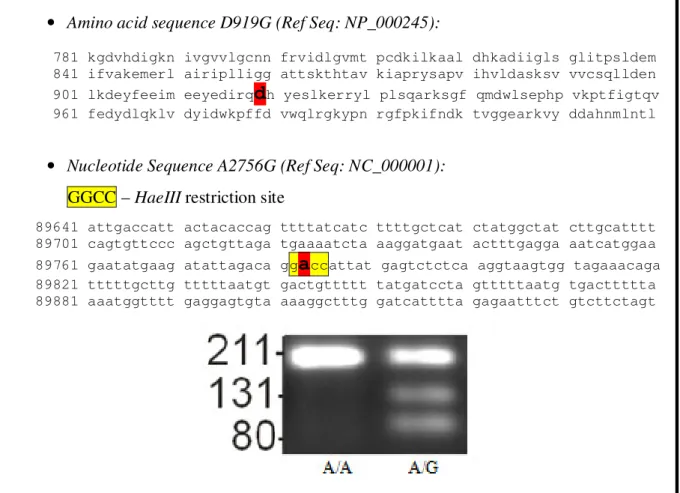
40 2.3.1.3 MTR A2756G
The A to G transition of this polymorphism creates a HaeIII restriction site. Thus, the G allele will be able to be digested. The information about the transition is indicated in Table 8.
Table 9. D919G (A2756G) variant of the MTR gene
• Amino acid sequence D919G (Ref Seq: NP_000245):
781 kgdvhdigkn ivgvvlgcnn frvidlgvmt pcdkilkaal dhkadiigls glitpsldem 841 ifvakemerl airiplligg attskthtav kiaprysapv ihvldasksv vvcsqllden 901 lkdeyfeeim eeyedirq
d
h yeslkerryl plsqarksgf qmdwlsephp vkptfigtqv 961 fedydlqklv dyidwkpffd vwqlrgkypn rgfpkifndk tvggearkvy ddahnmlntl• Nucleotide Sequence A2756G (Ref Seq: NC_000001): GGCC – HaeIII restriction site
89641 attgaccatt actacaccag ttttatcatc ttttgctcat ctatggctat cttgcatttt 89701 cagtgttccc agctgttaga tgaaaatcta aaggatgaat actttgagga aatcatggaa 89761 gaatatgaag atattagaca gg
a
ccattat gagtctctca aggtaagtgg tagaaacaga 89821 tttttgcttg tttttaatgt gactgttttt tatgatccta gtttttaatg tgacttttta 89881 aaatggtttt gaggagtgta aaaggctttg gatcatttta gagaatttct gtcttctagt41 2.3.1.4 MTRR A66G
The A66G transition in the MTRR gene, upon with a substitution of a base with modified primers, creates a restriction site for the NdeI enzyme. The “A” allele will produce digested products where as the “G” allele will remain uncut.
Table 10.I22M (A66G) variant of the MTRR gene
• Amino acid sequence I22M (Ref Seq: NP_002445):
1 mrrflllyat qqgqakaiae e
i
ceqavvhg fsadlhcise sdkydlktet aplvvvvstt 61 gtgdppdtar kfvkeiqnqt lpvdffahlr ygllglgdse ytyfcnggki idkrlqelga 121 rhfydtghad dcvglelvve pwiaglwpal rkhfrssrgq eeisgalpva spassrtdlv• Nucleotide Sequence A66G (Ref Seq: NC_000005):
CATATG – Nde1 restriction site gcaaaggccatcgcagaag
c
aat -primer with a modified base 1681 gccttgaagt gatgaggagg tttctgttac tatatgctac acagcaggga caggcaaagg 1741 ccatcgcaga agaa
ata
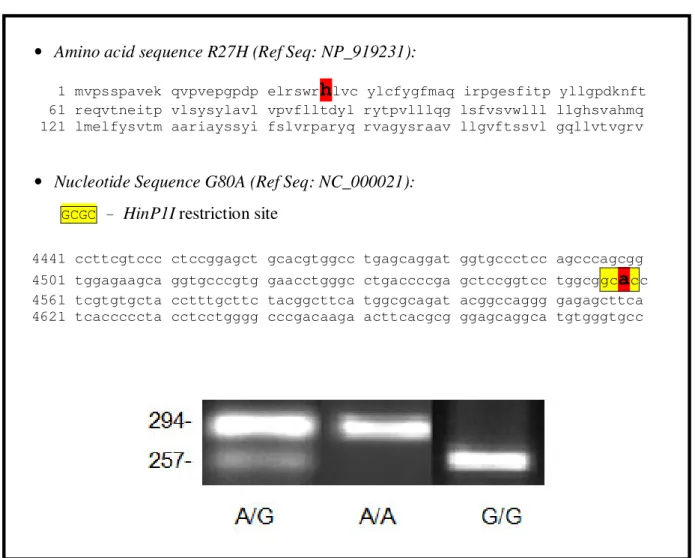
tgt gagcaagctg tggtacatgg attttctgca gatcttcact 1801 gtattagtga atccgataag gttagagccg ttacagtgga ttttaccgtt ttgtgctttg 1861 aagaattttg gttgggaagt gatatttatg aaacaaaagg acactaatac caccacatag 1921 tctttgtttt ttaacagaaa tgtgtttgtt caatggtata gtaagatatc accagcattt42 2.3.1.5 RFC G80A
The G to A transition at the 80th base of the RFC gene abolishes a HinP1I restriction site. So, the G allele will be recognized and cut by HinP1I whereas the A allele will be undigested.
Table 11. R27H (G80A) variant of the RFC gene
• Amino acid sequence R27H (Ref Seq: NP_919231):
1 mvpsspavek qvpvepgpdp elrswr
h
lvc ylcfygfmaq irpgesfitp yllgpdknft 61 reqvtneitp vlsysylavl vpvflltdyl rytpvlllqg lsfvsvwlll llghsvahmq 121 lmelfysvtm aariayssyi fslvrparyq rvagysraav llgvftssvl gqllvtvgrv• Nucleotide Sequence G80A (Ref Seq: NC_000021):
GCGC – HinP1I restriction site
4441 ccttcgtccc ctccggagct gcacgtggcc tgagcaggat ggtgccctcc agcccagcgg 4501 tggagaagca ggtgcccgtg gaacctgggc ctgaccccga gctccggtcc tggcggc
a
cc 4561 tcgtgtgcta cctttgcttc tacggcttca tggcgcagat acggccaggg gagagcttca 4621 tcacccccta cctcctgggg cccgacaaga acttcacgcg ggagcaggca tgtgggtgcc43 2.4 c-DNA Synthesis
c-DNA synthesis was carried out with a c-DNA synthesis kit (Finnzymes DyNAmo cDNA synthesis kit, #F-470L). The master mix contained 10 µl of 2X RT Buffer, 1 µl of random hexamer primer set with a concentration of 300µg/µl, 2 µ l of M-MuLV Rnase H+ reverse transcriptase, maximum 1 µg of template RNA added up to 20 µl with ddH2O. After transferring
to the Perkin Elmer (PE9700) thermal cycler, the mixture was incubated in the following conditions: 25 oC for 10 mins, 37 oC for 30mins, 85 oC for 5 mins and a final hold of 4 oC.
2.5 Cell Culture
Cells were grown at a confluence of approximately 80% in RPMI with 10% fetal calf serum (Hycole), supplemented with glutamine, streptomycin and penicillin. The old medium was removed and the cells were washed with 1X PBS. After removal of the 1X PBS, Trypsin/EDTA solution was added and the cells were left for incubation at 37C for 3 - 4 minutes. When the cells were detached from the surface of the plate, trypsin was inactivated by adding fresh growth medium. The detached cells were suspended using a pipettor and were placed in a falcon tube. The cells then were centrifuged at 800rpm for 5mins and the supernatant containing the Trypsin/EDTA solution was removed. The pellet was re-suspended with fresh medium and cell suspension was plated to a new flask. Fresh medium is added to the flask and placed in 37 oC, %5 CO2 incubator.
2.6 RNA Isolation
Cells were trypsinized as previously described in the Cell Culture section. Cold media is added and the cells are mixed. The cells are transferred into a 15ml falcon tube and centrifuged at 800rpm for 5 mins, at 4 oC. After centrifugation, the media was removed and washed with 1X PBS and 1ml Trizol (Invitrogen) was added. The cells were mixed until they homogenize and transferred into an eppendorf tube. 200µl chloroform was added and the tube was vigorously shaken for 15 seconds. After incubating for 3 minutes at room temperature, the cells were
44 centrifuged at 13.000rpm for 15 mins, at 4 oC. After this step, the supernatant was removed by a pipettor and placed into a new tube. 500 µl isopropanol was added and the supernatant is mixed. The mixture was incubated for 10 mins at room temperature and centrifuged at 13.000 rpm for 10 minutes, at 4 oC. Then the isopropanol was completely removed and 1ml 75% EtOH was added following 8 minutes of centriguation at 8000rpm, at 4 oC. The 75% EtOH wassucked and 1ml 99.8% EtOH was added following the same centrifugation step of 8 mins at 8000rpm, 4 oC. 99.8% EtOH was removed and the pellet is dried under laminar flow for 5-10mins. Lastly, the pellet is dissolved in 20µ l-25µl DNase-RNase free H2O and mixed
2.7 Real Time PCR
The real-time RT-PCR assays were done with the iCycler instrument (BioRad Laboratories) using the Finnzymes Dynamo SYBR Green qPCR kit (Finnzymes Cat #F-410). The primers used for TS expression were 5' -GCAGATCCAACACATCCTCC-3' (sense) and 3'- CCATTGGCATCCCAGATTTTCAC-5' (antisense). β-actin was used as a loading control. The PCR reactions were set up in a volume of 20 µl, containing 2 µl of sample cDNA, 10 µl of 2X Master mix, 5 pmol from each TS specific primers, added up to 20 µl with RNase-DNase free water. The cycling conditions were as follows: 95 °C for 1 min, 58 °C for 1 min, and 72 °C for 1min for 40 cycles with initial melting at 95 °C for 10 min.
Relative expression levels were calculated using the PCR threshold cycle number (CT)
for each sample and control sample (both of which were normalized according to β-actin mRNA for differences in amount of total RNA added to the reaction), using the formula 2−(∆CTsample−∆CTcontrol)[70], [71]. ∆CT represents the difference in CT values between the target and
β-actin transcripts. RT-PCR was performed in triplicates for each sample and average CT values
![Figure 2 .The chemical structure of S-adenosylmethionine. The methyl group attached to the sulfur atom is reactive and is donated to an acceptor, forming S-adenosylhomocysteine., adapted from [27]](https://thumb-eu.123doks.com/thumbv2/9libnet/5621127.111333/19.892.330.623.674.864/figure-chemical-structure-adenosylmethionine-attached-reactive-acceptor-adenosylhomocysteine.webp)