BEHAVIORAL AND COMPUTATIONAL
INVESTIGATION OF THE EFFECT OF PRIOR
KNOWLEDGE ON VISUAL PERCEPTION
a dissertation submitted to
the graduate school of engineering and science
of bilkent university
in partial fulfillment of the requirements for
the degree of
doctor of philosophy
in
neuroscience
By
Buse Merve Ürgen
January 2021
BEHAVIORAL AND COMPUTATIONAL INVESTIGATION OF THE EFFECT OF PRIOR KNOWLEDGE ON VISUAL PERCEP-TION
By Buse Merve Urgen January 2021
We certify that we have read this dissertation and that in our opinion it is fully adequate, in scope and in quality, as a dissertation for the degree of Doctor of Philosophy.
Hiiseyin Boyac1(Advisor)
ttac1
lfuto~
Ka1~1gonu1Emre Akba§
Nahide· Dicle IJ6vencioglu
Didem Kad1hasanoglu
Approved for the Graduate School of Engineering and Science:
Ezhan Kara§an
Direc or of the Graduate School ii
ABSTRACT
BEHAVIORAL AND COMPUTATIONAL
INVESTIGATION OF THE EFFECT OF PRIOR
KNOWLEDGE ON VISUAL PERCEPTION
Buse Merve Ürgen Ph.D. in Neuroscience Advisor: Hüseyin Boyacı
January 2021
Visual perception results from the dynamic interaction of bottom-up and top-down processes. Top-top-down prior knowledge and expectations can guide us to predict upcoming events and even determine what we see in an ambiguous or noisy sensory stimulus. Despite the well-established facilitating effects of expec-tations on recognition or decision-making, whether and how early sensory pro-cesses are affected by expectations remain unclear. This dissertation attempts to investigate the effect of expectations on early visual processes. To this end, we used behavioral experiments to examine the effects of expectation on visual per-ception at the threshold level and implemented a recursive Bayesian model and a recurrent cortical model to unravel the computational mechanisms underlying those effects. In the behavioral experiments, we systematically manipulated ex-pectation’s validity in separate sessions and measured duration thresholds, which is the shortest presentation time sufficient to achieve a certain success level. Our behavioral findings showed that valid expectations do not reduce the thresholds, rather unmet expectations lead them to increase. Next, using a recursive Bayesian updating scheme, we modeled the empirical data obtained in the behavioral ex-periments. Model fitting showed that higher thresholds observed in the unmet expectations are not due to a change in the internal parameters of the system. Instead, additional computations are required by the system to complete the sensory process. Finally, within the predictive processing framework, we imple-mented a recurrent cortical model to explain the behavioral findings and discuss possible neural mechanisms underlying the observed effects. The cortical model findings were in agreement with the Bayesian model results, revealing that longer processing is needed when expectations are not met. Overall, the computational models that are proposed in this study provide a parsimonious explanation for the observed behavioral effects. The proposed experimental paradigm and the computational models offer a novel framework that can be extended and used in
iv
other stimuli, tasks, and sensory modalities.
Keywords: visual perception, perceptual inference, expectation, prior knowledge, predictive processing, computational modeling, Bayesian model, cortical model.
ÖZET
ÖN BİLGİNİN GÖRSEL ALGI ÜZERİNDEKİ
ETKİSİNİN DAVRANIŞSAL VE HESAPLAMALI
MODELLERLE İNCELENMESİ
Buse Merve Ürgen Nörobilim, Doktora Tez Danışmanı: Hüseyin Boyacı
Ocak 2021
Görsel algı, aşağıdan yukarıya ve yukarıdan aşağıya işlenen bilginin dinamik bir etkileşimi ile gerçekleşir. Ön bilgi ve beklentiler, yaklaşan olayların tahmin edilmesi ve hatta belirsiz veya gürültülü bir duyusal uyaranda ne görüldüğünün belirlenmesi için rehberlik edebilir. Beklentilerin, tanıma veya karar verme süreç-leri üzerindeki iyi bilinen kolaylaştırıcı etkisüreç-lerine rağmen, erken duyusal süreçsüreç-lerin beklentilerden etkilenip etkilenmediği ve nasıl etkilendiği belirsizliğini korumak-tadır. Bu tez, beklentilerin erken görsel süreçler üzerindeki etkisini araştırmak-tadır. Bu amaçla, beklentinin görsel algı üzerinde eşik seviyesindeki etkilerini incelemek için davranışsal deneyler yapılmış ve bu etkilerin altında yatan hesapla-malı mekanizmaları ortaya çıkarmak için yinelemeli bir Bayes modeli ve kortikal bir model kullanılmıştır. Davranışsal deneylerde, beklentinin geçerliliği ayrı otu-rumlarda sistematik olarak değiştirilmiş ve belirli bir başarı düzeyine ulaşmak için gereken en kısa sunum süresi olan süre eşikleri ölçülmüştür. Davranışsal bulgular, karşılanan beklentilerin süre eşiklerini azaltmadığını, karşılanmayan beklentilerin süre eşiklerini artırdığını göstermiştir. Daha sonra, yinelemeli bir Bayes modeli kullanılarak, davranışsal deneylerde elde edilen deneysel veriler modellenmiştir. Modelleme sonuçları, karşılanmayan beklentilerde gözlemlenen eşik süresindeki artışın, sistemin iç parametrelerindeki bir değişiklikten kaynaklanmadığını göster-miştir. Bunun yerine, duyusal sürecin tamamlanması için sistem tarafından ek
hesaplamalar gerekmektedir. Son olarak, tahmine dayalı işleme çerçevesinde,
davranışsal bulguların açıklanması ve gözlenen etkilerin altında yatan olası nöral mekanizmalarının tartışılması amacıyla kortikal bir model kullanılmıştır. Kortikal model bulguları, Bayes modeli sonuçlarıyla uyumlu olarak, beklentiler karşılan-madığında daha uzun bir işlemenin gerekli olduğunu ortaya koymuştur. Genel olarak, bu çalışmada önerilen hesaplamalı modeller, gözlemlenen davranışsal
vi
geliştirilmeye açıktır ve farklı uyaranlar, görevler ve duyusal modalitelerde de uygulanabilir.
Anahtar sözcükler : görsel algı, algısal çıkarım, beklenti, ön bilgi, tahmine dayalı süreçler, hesaplamalı modelleme, Bayes modeli, kortikal model.
Acknowledgement
I am grateful to all people who provided their sincere support either in my academic work or personally. Thank you all for your kind contributions to this journey.
First of all, I would like to express my sincere gratitude to my advisor Hüseyin Boyacı, who provided me a research environment where I can enjoy to the full the extensive freedom of conducting research and expressing my ideas. This, I believe, makes it possible to grow up as an independent researcher. I would like to thank him for always making me feel that he believes in me and supporting all of my efforts. I am grateful that his valuable guidance, advice, and patience in every aspect of this journey have taught me a lot.
I would like to express my special gratitude to Katja Doerschner for her en-couragement, valuable advice, and ready support. I would like to thank her for all the guidance and a wide range of opportunities she had provided me throughout the years we worked together. It was an invaluable opportunity to be a part of the Computational and Biological Vision Group (CBVG) led by Hüseyin Boyacı and Katja Doerschner.
I would like to thank Hulusi Kafalıgönül for not only supporting my work with his valuable comments on this dissertation throughout the thesis progress meet-ings but also sharing his experiences and guidance on several aspects of academia, including opportunities for growth. Also, I would like to thank Emre Akbaş and Jennifer Corbett for always providing their support and valuable constructive comments throughout the thesis progress meetings and to the other jury mem-bers Dicle Dövencioğlu and Didem Kadıhasanoğlu for their valuable time and comments on this dissertation.
I believe that it is not everyone’s luck to have a sister who can understand more than your ideas not only in your personal life but also about your research and the path you follow in academia. I would like to thank Burcu Ayşen Ürgen, who has solid support, endless trust, and belief in me. I am grateful that she will be my life-long collaborator with her absolute enthusiasm and dedication to science wherever we are.
viii
environment to conduct research and pursue graduate training. I thank all former and present members of UMRAM with whom we worked, had fun, and spent countless hours for intellectual and non-intellectual discussions. Especially, I want to thank my academic sister, Zahide Pamir, with whom I have shared more than a Ph.D. training. I am grateful for her sincere support, intellectual contributions to my research, and valuable companionship. Also, I want to thank Aydan Ercingöz, for her patience in helping me with all that official documentation for years, and especially I will never forget those days when we united our forces to save our lovely pets! I also thank Koray Ertan for our cheerful, entertaining as well as thought-provoking discussions and exchange of ideas that made us look from different perspectives. Also, I thank Cansu Öğülmüş, Beyza Akkoyunlu, Dilara Erişen, and other members of CBVG with whom I shared wonderful memories and spent many years together side-by-side. I also acknowledge İlayda Nazlı for sharing the data used in Chapter 4.
Finally, and most importantly, I would like to thank my family, Kamil, Belgin, Burcu, Burçin, and Limon, for their unwavering support and belief in me. It is impossible to express what their warm-hearted, considerate, and unconditional support means to me. I thank my mother Belgin and my father Kamil, for being the most reliable and devoted mentors in all matters in my life. I thank my sister Burçin, from whom I learned a lot from her strength, generosity, and sense of justice, and my sister Burcu, from whom I learned a lot from her determination, sensitivity, and curiosity. And I thank my lovely dog Limon, who has changed my perspective on life in every sense. I am grateful to my family for always being the most reliable, warm, and supportive people I could ever hope to know. I dedicate this dissertation to my family.
This work was supported by the Turkish National Scientific and Technological Council (TÜBİTAK 217K163) grant awarded to HB. I also acknowledge that the studies and results presented in this dissertation are partly based on a publication by B.M. Urgen and H. Boyaci, "Unmet expectations delay sensory processes", Vi-sion Research, 181, 1-9, 2021. Also, the studies presented in this dissertation are partly presented in a preprint by B.M. Urgen and H. Boyaci, "When expectations are not met: unraveling the computational mechanisms underlying the effect of expectation on perceptual thresholds", bioRxiv, 545244, 2019.
Contents
1 Introduction 1
1.1 Expectation and attention: involvement of higher-level
mecha-nisms in visual perception . . . 1
1.2 Effect of expectation on visual perception . . . 5
1.2.1 Drift-diffusion model . . . 6
1.2.2 Bayesian model . . . 8
1.3 Mechanistic understanding of the effect of expectation on visual perception . . . 10
1.4 Current Study . . . 14
2 Behavioral Effects of Expectation on Visual Perception 16 2.1 Introduction . . . 16
2.2 Experiment 1 . . . 18
2.2.1 Materials and methods . . . 18
2.2.2 Results . . . 23
2.3 Experiment 2 . . . 24
2.3.1 Materials and Methods . . . 25
2.3.2 Results . . . 25
2.4 Summary and Conclusions . . . 26
3 A recursive Bayesian model: computational mechanisms under-lying the effect of expectation on perceptual thresholds 28 3.1 Introduction . . . 29
3.2 Conceptual Understanding of Bayesian Model . . . 30
CONTENTS x
3.3.1 Implementation of Bayesian Model . . . 32
3.3.2 Model fitting for individual data . . . 35
3.3.3 Model comparison . . . 36
3.4 Results . . . 37
3.5 Summary and Conclusions . . . 45
4 Generalization of the Bayesian model predictions on empirical data 48 4.1 Introduction . . . 48
4.2 Methods . . . 49
4.2.1 Details about the Experiment . . . 49
4.2.2 Modeling . . . 49
4.3 Results . . . 51
4.4 Summary and Conclusions . . . 52
5 A recurrent cortical model: a bridge that links the behavior to brain 55 5.1 Introduction . . . 55
5.2 Methods . . . 59
5.2.1 Energy Function . . . 59
5.2.2 Implementation of the cortical model . . . 60
5.2.3 Cortical model fitting for individual data . . . 65
5.3 Results . . . 65
5.4 Summary and Conclusions . . . 70
6 General Discussion 72 6.1 Expectation affects perceptual thresholds . . . 73
6.2 Unmet expectations delay early visual processes . . . 74
6.3 A recurrent cortical model can explain the behavioral effects of expectation . . . 76
6.4 Future Work . . . 79
6.5 Conclusion . . . 80
CONTENTS xi
List of Figures
1.1 The well-known hidden Dalmatian dog picture,
show-ing the effect of prior knowledge on visual perception.
Reprinted, with permission, from ref. [1]. See Appendix. . . 3
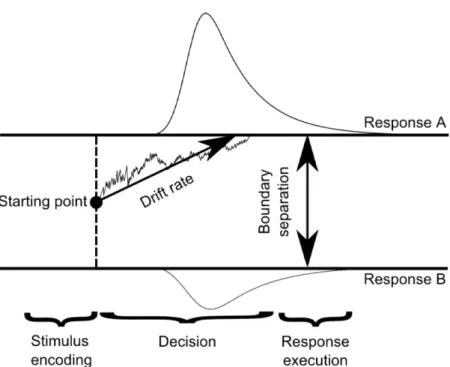
1.2 A simplified illustration of Drift-diffusion model (DDM).
Decisions are suggested to be based on the accumulation of evi-dence from a sensory stimulus. This continues process fluctuates between possible outcomes until it reaches a critical limit or bound-ary for a decision alternative. When the process reaches the critical limit, a decision can be made for that particular decision alterna-tive. See text for details. Reprinted, with permission, from ref.
[2]. See Appendix. . . 7
1.3 The effect of context in visual perception. Reprinted, with
LIST OF FIGURES xiii
1.4 A schematic illustration of the predictive coding model. R
represents representation (prediction) units, and E represents er-ror units. In the predictive coding framework it has been suggested that based on prior knowledge brain computes internal predictions about the upcoming sensory stimulus. These predictions are com-pared with the actual sensory stimulus at each level of the cortical hierarchy. When there is a mismatch between the internal pre-dictions and the sensory stimulus, a prediction error is computed. The predictions are conveyed from higher levels to lower levels via backward connections, and the predictions errors are conveyed from lower levels to higher levels via forward connections. This process has been suggested to be executed by representation (pre-diction) units, and error units. Reprinted, with permission, from
ref. [4]. See Appendix. . . 13
2.1 Experimental design. Sample trial sequences. a. Congruent
(expected) trial. b. Incongruent (unexpected) trial. c: Neutral trial. Except the neutral trials, an informative cue predicted the category of upcoming target image with a certain validity. The va-lidity of the cue was 100%, 75%, and 50% in different experimental sessions. In the neutral trials the cue was a question mark and was not informative about the upcoming target image category. Task of the participants was to detect the spatial location of the target
image. See text for more details. . . 23
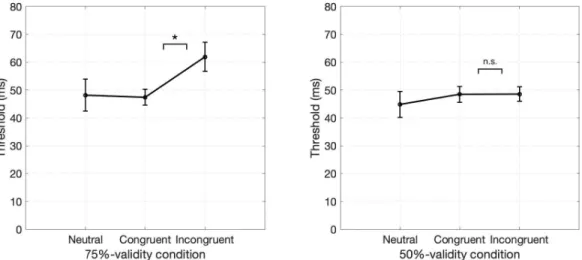
2.2 Results of Experiment 1. a. Duration thresholds of
100%-validity and neutral conditions. b. Duration thresholds of congru-ent and incongrucongru-ent trials in 75%-validity condition. c. Duration thresholds of congruent and incongruent trials in 50%-validity
con-dition. . . 24
2.3 Results of Experiment 2. a. Results of Group 1 who completed
75%-validity and neutral conditions. b. Results of Group 2 who
LIST OF FIGURES xiv
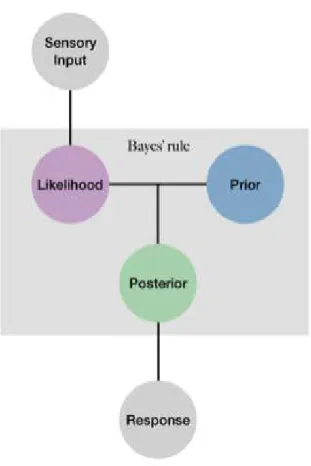
3.1 A simple illustration of the components of a basic Bayesian
model. In this framework, an observer learns the statistical regu-larities in the environment, e.g. stimuli used in a task. The beliefs about the statistical regularities in the environment, also called prior, are represented as a probability distribution. The sensory processing for the observation of the actual sensory stimulus is represented as a likelihood function. While making decisions, the prior and the actual sensory input are combined, and this pro-cess results in posterior estimates. Consequently, a decision can be made based on the posterior beliefs, and a response can be
executed by the observer. . . 31
3.2 Bayesian model adapted to the current experimental
paradigm. Figure shows the calculations done for a single trial
from 75%-validity condition. See text for details. . . 34
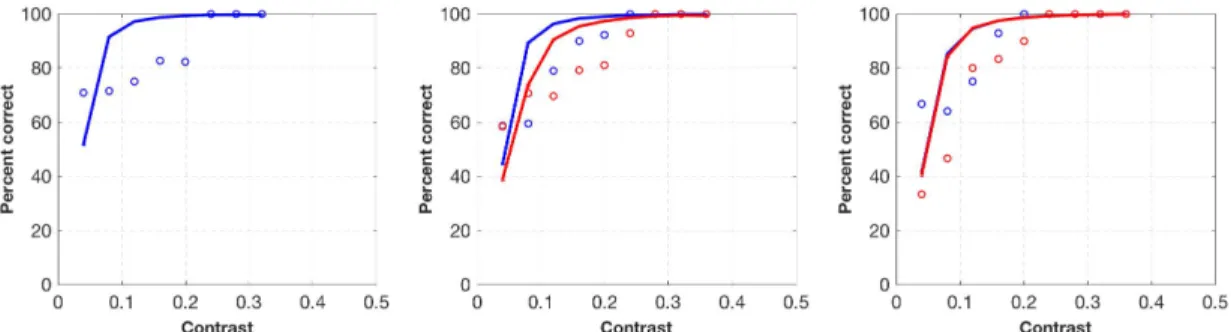
3.3 Bayesian model fitting of restricted and unrestricted
model for Subject 1. Upper panel shows results of the restricted model and lower panel shows results of the unrestricted model for 100%, 75% and 50%-validity conditions. Blue dots indicate observer data in congruent trials, and red dots indicate observer data in incongruent trials. Blue and red lines indicate model fits
for congruent and incongruent trials respectively. . . 37
3.4 Bayesian model fitting of restricted and unrestricted
model for Subject 2. Upper panel shows results of the restricted model and lower panel shows results of the unrestricted model for 100%, 75% and 50%-validity conditions. Blue dots indicate observer data in congruent trials, and red dots indicate observer data in incongruent trials. Blue and red lines indicate model fits
LIST OF FIGURES xv
3.5 Bayesian model fitting of restricted and unrestricted
model for Subject 3. Upper panel shows results of the restricted model and lower panel shows results of the unrestricted model for 100%, 75% and 50%-validity conditions. Blue dots indicate observer data in congruent trials, and red dots indicate observer data in incongruent trials. Blue and red lines indicate model fits
for congruent and incongruent trials respectively. . . 39
3.6 Bayesian model fitting of restricted and unrestricted
model for Subject 4. Upper panel shows results of the restricted model and lower panel shows results of the unrestricted model for 100%, 75% and 50%-validity conditions. Blue dots indicate observer data in congruent trials, and red dots indicate observer data in incongruent trials. Blue and red lines indicate model fits
for congruent and incongruent trials respectively. . . 40
3.7 Bayesian model fitting of restricted and unrestricted
model for Subject 5. Upper panel shows results of the restricted model and lower panel shows results of the unrestricted model for 100%, 75% and 50%-validity conditions. Blue dots indicate observer data in congruent trials, and red dots indicate observer data in incongruent trials. Blue and red lines indicate model fits
for congruent and incongruent trials respectively. . . 41
3.8 Bayesian model fitting of restricted and unrestricted
model for Subject 6. Upper panel shows results of the restricted model and lower panel shows results of the unrestricted model for 100%, 75% and 50%-validity conditions. Blue dots indicate observer data in congruent trials, and red dots indicate observer data in incongruent trials. Blue and red lines indicate model fits
LIST OF FIGURES xvi
3.9 Bayesian model fitting of restricted and unrestricted
model for Subject 7. Upper panel shows results of the restricted model and lower panel shows results of the unrestricted model for 100%, 75% and 50%-validity conditions. Blue dots indicate observer data in congruent trials, and red dots indicate observer data in incongruent trials. Blue and red lines indicate model fits
for congruent and incongruent trials respectively. . . 43
3.10 Bayesian model fitting of restricted and unrestricted model for Subject 8. Upper panel shows results of the restricted model and lower panel shows results of the unrestricted model for 100%, 75% and 50%-validity conditions. Blue dots indicate observer data in congruent trials, and red dots indicate observer data in incongruent trials. Blue and red lines indicate model fits
for congruent and incongruent trials respectively. . . 44
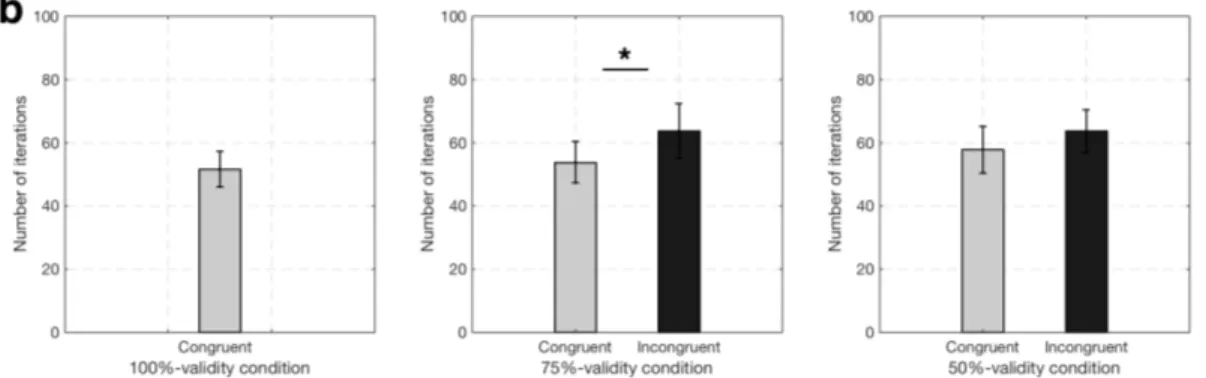
3.11 Number of iterations, N (posterior computations) in con-gruent and inconcon-gruent trials in all validity conditions av-eraged across all observers’ fits. a. 100%-validity condition.
b. 75%-validity condition. c. 50%-validity condition. . . 45
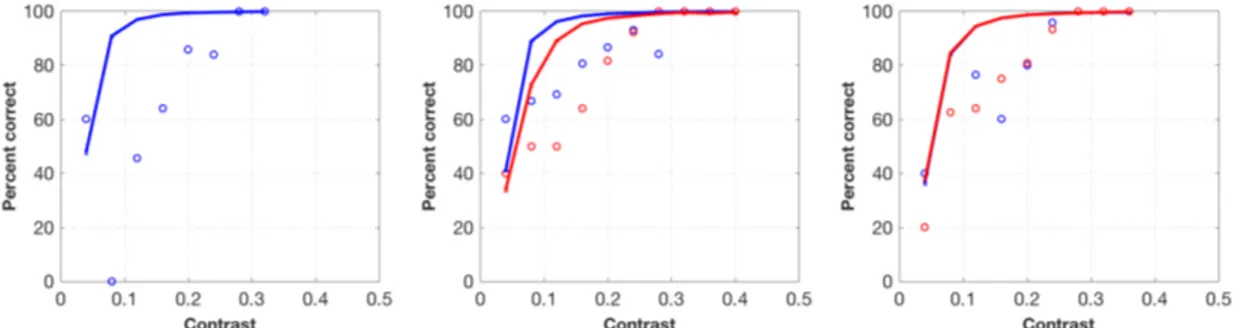
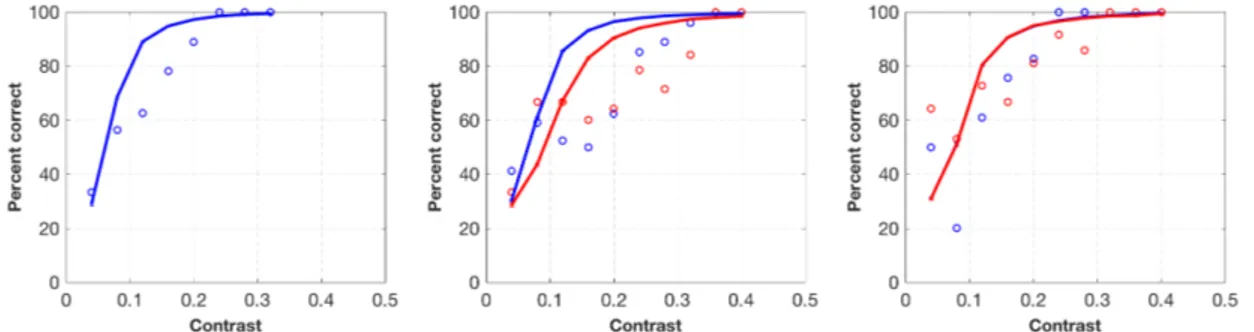
4.1 Bayesian model fitting of a single participant (participant
1) in contrast detection experiment. Panels show results of 100% (left), 75% (middle) and 50%-validity (right) conditions re-spectively. Blue circles indicate observer data in congruent trials, and red circles indicate observer data in incongruent trials. Blue and red lines indicate model fits for congruent and incongruent
trials respectively. . . 52
4.2 Bayesian model fitting of a single participant (participant
2) in contrast detection experiment. Panels show results of 100% (left), 75% (middle) and 50%-validity (right) conditions re-spectively. Blue circles indicate observer data in congruent trials, and red circles indicate observer data in incongruent trials. Blue and red lines indicate model fits for congruent and incongruent
LIST OF FIGURES xvii
4.3 Bayesian model fitting of a single participant (participant
3) in contrast detection experiment. Panels show results of 100% (left), 75% (middle) and 50%-validity (right) conditions re-spectively. Blue circles indicate observer data in congruent trials, and red circles indicate observer data in incongruent trials. Blue and red lines indicate model fits for congruent and incongruent
trials respectively. . . 53
4.4 Bayesian model fitting of a single participant (participant
4) in contrast detection experiment. Panels show results of 100% (left), 75% (middle) and 50%-validity (right) conditions re-spectively. Blue circles indicate observer data in congruent trials, and red circles indicate observer data in incongruent trials. Blue and red lines indicate model fits for congruent and incongruent
trials respectively. . . 54
5.1 Neural network architecture. Each square at each layer in the
figure indicates a neural unit that includes thousands of neurons. Panel A and B show a feedforward architecture, where response of each neural unit only depends on input from the previous layer, and each unit also gives response to the next layer. Panel C and D shows a neural net structure where each neural unit gets input from the previous layer, gives response to the next layer, and it also gives feedback to the previous layer. Reprinted, with permission,
LIST OF FIGURES xviii
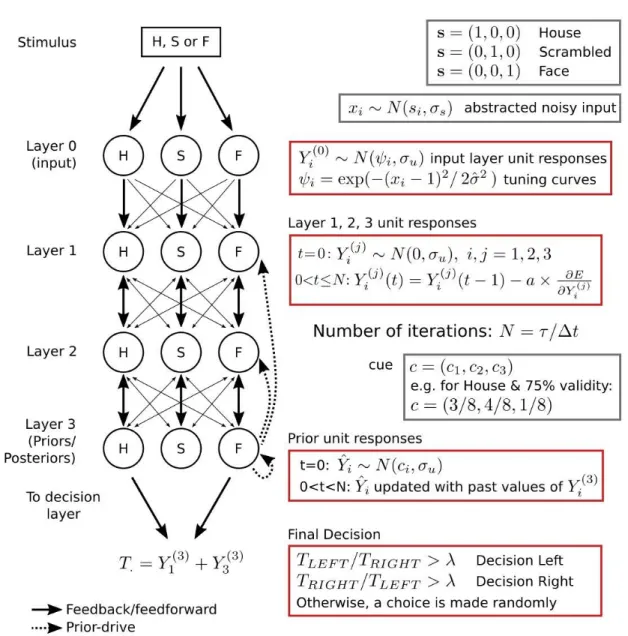
5.2 Cortical model. The model has one input, one decision and
three intermediate layers, and three category-specific feature units for house (H), face (F) and scrambled (S) images. Weights of the connections are depicted by the thickness of the arrows. Priors,
ˆ
Yi, are initialized in the beginning of the trial based on the cue
and its validity. Later they are updated with past values of layer 3 unit responses. All unit responses are updated until the end of the presentation. Number of iterations in a trial is determined by the stimulus presentation duration, τ , divided by ∆t, where ∆t defines how long each iteration lasts in the system. A final decision is made by the model based on the sum of layer 3 house and face
unit responses on the left and right side of the visual field. . . 61
5.3 A basic schematic illustration of the cortical model. The
model shows the same architecture as in Figure 5.2 except that here for simplicity only a feedback connection is shown in the left side of the figure, but all units (on the right side of the figure) have feedback connections with the previous layer. As input a house or face image and a scrambled version of it are given to the network. Layer 1 is assumed to process low-level features, which may correspond to early visual areas. Layer 2 is assumed to process higher-level visual information, e.g. object categories, which may correspond to fusiform face area (FFA) or parahippocampal place area (PPA). The cue, a face or a house sign, is assumed to drive Layer 3 unit responses at each trial, and the unit responses are updated recursively as shown in the figure. Finally, face and house unit responses are conveyed to the decision layer for the final decision. 63
5.4 Cortical model simulations for Subject 1. Blue dots indicate
observer data in congruent trials, and red dots indicate observer data in incongruent trials. Blue and red lines indicate model fits
LIST OF FIGURES xix
5.5 Cortical model simulations for Subject 2. Blue dots indicate
observer data in congruent trials, and red dots indicate observer data in incongruent trials. Blue and red lines indicate model fits
for congruent and incongruent trials respectively. . . 66
5.6 Cortical model simulations for Subject 3. Blue dots indicate
observer data in congruent trials, and red dots indicate observer data in incongruent trials. Blue and red lines indicate model fits
for congruent and incongruent trials respectively. . . 67
5.7 Cortical model simulations for Subject 4. Blue dots indicate
observer data in congruent trials, and red dots indicate observer data in incongruent trials. Blue and red lines indicate model fits
for congruent and incongruent trials respectively. . . 67
5.8 Cortical model simulations for Subject 5. Blue dots indicate
observer data in congruent trials, and red dots indicate observer data in incongruent trials. Blue and red lines indicate model fits
for congruent and incongruent trials respectively. . . 67
5.9 Cortical model simulations for Subject 6. Blue dots indicate
observer data in congruent trials, and red dots indicate observer data in incongruent trials. Blue and red lines indicate model fits
for congruent and incongruent trials respectively. . . 68
5.10 Cortical model simulations for Subject 7. Blue dots indicate observer data in congruent trials, and red dots indicate observer data in incongruent trials. Blue and red lines indicate model fits
for congruent and incongruent trials respectively. . . 68
5.11 Cortical model simulations for Subject 8. Blue dots indicate observer data in congruent trials, and red dots indicate observer data in incongruent trials. Blue and red lines indicate model fits
for congruent and incongruent trials respectively. . . 69
5.12 Cortical model number of iterations, N (posterior compu-tations) in congruent and incongruent trials in all validity conditions. a. 100%-validity condition. b. 75%-validity
LIST OF FIGURES xx
5.13 Cortical model simulations for each unit response at each layer. This simulation shows category-specific (face (blue), house (red) and scrambled (yellow)) unit responses in a congruent (left) and incongruent (right) trial when a face cue is presented in a
75%-validity condition. . . 70
A.1 Logistic function fits for a single participant (1) for each
experimental condition in Experiment 1. . . 92
A.2 Logistic function fits for a single participant (2) for each
experimental condition in Experiment 1. . . 93
A.3 Logistic function fits for a single participant (3) for each
experimental condition in Experiment 1. . . 94
A.4 Logistic function fits for a single participant (4) for each
experimental condition in Experiment 1. . . 95
A.5 Logistic function fits for a single participant (5) for each
experimental condition in Experiment 1. . . 96
A.6 Logistic function fits for a single participant (6) for each
experimental condition in Experiment 1. . . 97
A.7 Logistic function fits for a single participant (7) for each
experimental condition in Experiment 1. . . 98
A.8 Logistic function fits for a single participant (8) for each
experimental condition in Experiment 1. . . 99
A.9 Logistic function fits for a single participant (Group 1) for
each experimental condition in Experiment 2. . . 100
A.10 Logistic function fits for a single participant (Group 1) for
each experimental condition in Experiment 2. . . 100
A.11 Logistic function fits for a single participant (Group 1) for
each experimental condition in Experiment 2. . . 101
A.12 Logistic function fits for a single participant (Group 1) for
each experimental condition in Experiment 2. . . 101
A.13 Logistic function fits for a single participant (Group 1) for
each experimental condition in Experiment 2. . . 102
A.14 Logistic function fits for a single participant (Group 1) for
LIST OF FIGURES xxi
A.15 Logistic function fits for a single participant (Group 2) for
each experimental condition in Experiment 2. . . 103
A.16 Logistic function fits for a single participant (Group 2) for
each experimental condition in Experiment 2. . . 103
A.17 Logistic function fits for a single participant (Group 2) for
each experimental condition in Experiment 2. . . 104
A.18 Logistic function fits for a single participant (Group 2) for
List of Tables
3.1 Notations for Bayesian model. . . 35
Chapter 1
Introduction
Our sensory experiences in the world are not only guided by our own actions. We are usually surrounded by a complex, rich and dynamic environment where our visual experiences also cannot stay intact. Imagine that you are walking around Taksim Square in Istanbul. It may not be easy to find the tube station you want to walk. As the street is too crowded, it is almost impossible to process all sensory information around us, e.g. lots of tourists walking on the street for shopping, sounds of street musicians and demonstrators for entertainment, signboards and their lights, and so on. As our visual system cannot process all sensory information at once in detail, it searches for possible places that the sign of the tube station can be placed. In other words, our visual system uses prior knowledge to predict the most probable place among several other alternatives so that the efficacy of the process culminates.
1.1
Expectation and attention:
involvement of
higher-level mechanisms in visual perception
As already stated in a dynamic and contextually rich environment the visual system cannot process all sensory information at the same level. For this reason,
it is suggested that high-level mechanisms in the brain are involved in information processing to make the process faster and more efficient. Attention is one of the well-known high level mechanisms which is comprehensively studied in the literature. Several studies suggested that while physical properties of a sensory input is being processed, the attention mechanism is involved in the process, allowing the selection of the relevant properties in the environment to the stimulus to be perceived [4]. For instance, if we are searching for a red mug in a room, we specifically look for red objects in the environment, which is the relevant feature (i.e. color) of the object. Through this, we do not have to search for every single item in the room. Thus, this mechanism leads the process to become faster, and detection of the stimulus becomes easier.
In more recent literature, however, it has been suggested that in addition to the attention mechanism, top-down information about prior knowledge and expectations also help in the processing of the sensory input [4]. Prior knowledge and expectations are suggested to help the system to resolve ambiguous input coming from the environment. Figure 1.1 shows a great example of the effect of prior knowledge on visual perception. When one is shown the image in Figure 1.1, it is usually hard to find a meaning in it at first sight. However, when it is told that there is a Dalmatian dog sniffing the ground, it becomes very easy to detect the dog from pebbles. Because prior knowledge is provided about the image, the dog can be detected in a short time. Other examples can be given from the effect of context-based prior knowledge on perception [4, 6]. For instance, we are faster in detecting a lamp in a bedroom (a usual context) than detecting a lamp on a beach (an unusual context) [4, 6]. Or when we want to find a painting in a room, we usually do not check every single place inside the room. Instead, we look at the locations where the painting is more likely to be placed, i.e. the wall. Thus, context-based prior knowledge about the objects leads expectations, which in turn make individuals become faster in detecting the objects.
The two top-down effects, expectation and attention, were previously not ex-amined separately in detail because they show similar behavioral effects. Specifi-cally, both attended and expected stimuli have been shown to be detected faster and more accurately than unattended and unexpected stimuli [4]. Therefore, in
Figure 1.1: The well-known hidden Dalmatian dog picture, showing the effect of prior knowledge on visual perception. Reprinted, with permission, from ref. [1]. See Appendix.
many previous studies the experimental paradigms/tasks examining expectation also necessitate attentional mechanisms to be involved in the process. Specifically, task-relevant features of stimuli (e.g. color), which lead attention mechanisms to involve in the process, were also determined as the ones that induce expectations for participants (e.g. color feature has a probability). This application has been done intentionally in some studies as the nature of the study does not specifically require disentangling the effects of expectation and attention. More recently, how-ever, in the experimental paradigms while attention is defined as the task-relevant stimulus feature (e.g. color), expectation is defined as the stimulus probability (or probability of a stimulus feature) [7]. In some previous studies even though the purpose of the study is to examine the effect of expectation, a distinction between expectation and attention has been overlooked. When task-relevant features of stimuli are also determined as the ones that induce expectations for participants, this would complicate the interpretation of findings in the literature [7]. To this respect, the observed effect could be the result of attention or expectation or an interaction. For example, in a traditional Posner cueing paradigm participants were shown a direction cue, which informs about the upcoming stimulus location with a certain probability (e.g. 80%), and the task is to report the spatial loca-tion of the stimulus. The aim of this paradigm is to examine attenloca-tional shift. However, it should also be considered that the location in this paradigm is both expected and attended for participants. Therefore, the outcome may represent an interaction of attention and expectation.
Consistent with this, in more recent findings attention and expectation are suggested to be two distinct mechanisms, which usually interact [8] but may have different neural effects [4]. Attention has been suggested to modulate the response properties of neurons [9, 10, 11, 12, 13, 14, 15], and it has been consistently shown that there is an increase in neural activity (e.g. BOLD signal during functional magnetic resonance imaging) for an attended stimulus compared to an unattended stimulus [4]. On the other hand, one of the most interesting findings related to the effect of expectation is that expected stimuli lead to decreased neural response compared to the response elicited by unexpected stimuli [4, 8, 16, 17, 18]. The
mechanisms underlying this effect have been a controversial issue and are dis-cussed later in Section 1.3 Mechanistic understanding of the effect of expectation on visual perception. Overall, the findings of these studies have revealed that attention and expectation should be examined separately at both behavioral and neural levels. However, even though we have a fairly comprehensive knowledge about attention mechanism, expectation research is still a field of study in which further work is needed.
1.2
Effect of expectation on visual perception
Prior knowledge and expectations have been shown to play a substantial role in visual perceptual processes. Our perceptual decisions can be strongly biased by expectations that are formed based on the information we previously exposed to [4, 7, 8, 19, 20, 21, 22, 23, 24, 25, 26, 27, 28, 29]. For instance, it is well-established that expected stimulus can be detected, discriminated or recognized more accu-rately and faster than the unexpected stimulus. Based on these findings expecta-tion and prior knowledge have been interpreted to facilitate perceptual processes [6, 7, 19], leading to a more efficient processing. On the other hand, it should also be noted that in most of the previous studies the index that is used to exam-ine or measure the effect of expectation was response times of the participants. As it is very well-known, response time is a measure which can incorporate not only early sensory process, but also cognitive and motor processes. Therefore, these findings may reflect expectation’s effect on perceptual decisions, however, it is still possible that any difference in the role of expectations on different lev-els of information processing had gone unnoticed. Specifically, whether and how expectations affect early sensory processes is still unclear.
Beyond these, even though several research focused on the behavioral effects of expectation on visual perceptual processes, how such effects eventuate has still been a matter of intense debate [30]. In other words, the computational mechanisms that underlie the effects of expectation on perceptual processes have remained elusive. In perceptual decision studies there are two commonly used
models, namely the Drift Diffusion model and Bayesian model, that may account for the observed behavioral effects, and they are discussed in the next sections.
1.2.1
Drift-diffusion model
In the decision-making literature it is very common to use Drift-Diffusion model [31] to unravel possible mechanisms underlying perceptual decision making pro-cesses. Specifically, Drift-diffusion model is mainly used in reaction time mea-surement in the literature (see Figure 1.2 for a simplified illustration of basic Drift-diffusion model). The main assumption of this model is that decisions are based on the accumulation of evidence from a sensory input. More specifically, the Drift Diffusion Model assumes that binary decisions (e.g. 2AFC task) are based on a continuous process that fluctuates between two possible outcomes (e.g decision for Left or Right). As soon as the process reaches a critical upper or lower value (which is called boundary or limit) for a decision alternative (e.g. Left or Right decision), a decision can be made for that particular decision al-ternative. The two main parameters of this model are drift rate and boundary separation. Drift rate is defined as relative amount of information per time unit (processing efficacy) while boundary separation is the distance between the two limits (boundaries), which is an indicator of total amount of information (sensory evidence).
In a recent study researchers investigated the effect of expectation on percep-tual decisions using DDM [32]. In that study the task of the participants was to report the spatial location of target stimulus while the predictive cue was indi-cating the upcoming target stimulus category. During the experiment contrast of the target images was changed adaptively, and response times of individuals were recorded. Results indicated that expectation can modulate boundary separation, which is also defined as the threshold that is required to reach a decision, but not processing efficacy (drift rate).
It should be noted that the DDM model is mostly used in perceptual decision-making studies, where response time (RT) of participants were recorded, and
Figure 1.2: A simplified illustration of Drift-diffusion model (DDM). Decisions are suggested to be based on the accumulation of evidence from a sensory stimulus. This continues process fluctuates between possible outcomes until it reaches a critical limit or boundary for a decision alternative. When the process reaches the critical limit, a decision can be made for that particular decision alternative. See text for details. Reprinted, with permission, from ref. [2]. See Appendix. Starting point Stimulus encoding I I I I I I I I
-Decision Response
execution
Response A
used in the analysis. Therefore, as stated earlier, the effect found in perceptual decisions (using RTs) may reflect a combined effect of early sensory, cognitive, and motor processes. In addition, even though the DDM model is a highly useful model to understand the mechanisms underlying the observed effects it may not take accounts of some important aspects of experimental paradigms/tasks. For instance, in an experiment where the expectation is task-irrelevant (e.g. proba-bility of the stimulus) it may not be possible to take the validity of expectation (e.g. 75%, 50%) into account. Also, the DDM model may not take the temporal dynamics throughout a trial into account [33]. Therefore, further work is needed to elucidate whether expectations affect even early sensory processes together with the mechanisms underlying those effects (if any).
1.2.2
Bayesian model
The challenges explained in the previous section may be resolved using Bayesian models. Over the last two decades Bayesian models of behavior have provided a mathematical explanation to understand, at least, how sensory information and prior knowledge can act together to give a plausible percept. This explanation gets its origin from Helmholtz’s earlier work [34], where he suggested perception as an unconscious inference processes. The interpretation of an ambiguous or noisy sensory stimulus is suggested to be achieved with the involvement of prior knowledge. Bayesian models of behavior formalize this idea and suggest that during information processing sensory input is combined with prior knowledge to find the most probable causes of the sensory input. Among several other alterna-tives the visual system can usually achieve a single percept using prior knowledge. Figure 1.3 shows an example in this sense. The image shown in Figure 1.3 is a blurred image where the objects within the image can be found to be ambiguous at first sight. However, we usually see a street where a car is placed on the road and a pedestrian is placed near the road. In fact, the two objects, the car and the pedestrian, are exactly the same objects, and the differences between them are only their orientation and the location they are placed. Thus, even though we are shown exactly the same object, the system interprets one of them as the
Figure 1.3: The effect of context in visual perception. Reprinted, with permission, from ref. [3]. See Appendix.
car and the other as the pedestrian. This reflects that our (context-based) prior knowledge has a modulatory effect on what we perceive. Indeed, a growing body of research revealed that empirical findings are largely consistent with the as-sumptions of Bayesian models of behavior [20, 23, 35, 36, 37, 38]. Findings of several studies support the idea that perception is a probabilistic inference pro-cess, where the system can make optimal interpretations in some circumstances, and consequently human behavior may approximate Bayesian ideal observer.
Consistent with the Bayesian models of behavior and behavioral findings, it has been consistently shown by numerous neuroimaging research that visual percep-tion results from an interplay between bottom-up sensory input and top-down effects of prior-knowledge. While low-level properties of stimuli are processed via forward connections, there is also a top-down influence (e.g. context-based)
on perceptual processing conveyed from higher levels to lower levels of the cor-tical hierarchy [6, 22, 28, 39, 40, 41]. Specifically, top-down information com-ing from higher regions was shown to have a modulatory effect on the activ-ity of early visual areas as well as further visual processing areas (e.g. FFA) [6, 19, 22, 26, 39, 40, 41, 42, 43, 44], which will be discussed in the next section.
1.3
Mechanistic understanding of the effect of
ex-pectation on visual perception
The neural evidence for the effect of expectations (or predictions or stimulus pre-dictability) on perception and cognition comes from studies that used different types of stimuli (e.g., gratings [8, 19], faces [43], objects [45]), different exper-imental paradigms (e.g., explicit probabilistic cues for expectation [19], statis-tical learning paradigms [17, 45]), different measures/methodologies (e.g., spik-ing activity, local field potentials (LFPs) [17, 46, 47, 48], BOLD response in functional magnetic resonance imaging (fMRI) [8, 16, 19, 43], EEG and MEG [49, 50, 51, 52]) and different brain regions (e.g., primary sensory areas in hu-mans [8, 19], lateral occipital complex (LOC), fusiform gyrus, inferior parietal cortex, posterior parahippocampal gyrus in humans [45], inferotemporal cortex in macaque [17, 46]). Due to this variability in methodology in the literature, it is not straightforward to draw a clear picture about the effect of expectations.
Some electrophysiological studies in non-human primates show that the inferior temporal cortex, an area known to play an important role in the visual processing of objects [53], has a higher response to unpredicted images following statistical learning [17]. On the other hand, some other work found no evidence for the expectation-related change in spiking activity and LFPs in macaque inferior tem-poral cortex [47, 48]. The discrepancy between these findings is suggested to be related to the length of exposure time (i.e., long-term or short-term exposure) to stimulus pairs [48, 54]. Following a long-term exposure to the stimulus pairs, expectations lead to reduced neural responses, but this effect is not consistently
revealed following short-term exposure [54].
Neuroimaging findings in humans suggest that expectations can influence early and late stages of visual processing [28]. In several studies it has been shown that expected stimuli lead to reduced neural response compared to the unexpected stimuli [4, 7, 16, 18, 19, 45], which is known as expectation suppression. Expec-tation suppression has been observed in several stages of information processing including the ventral visual stream: primary visual cortex [16, 19], LOC, fusiform gyrus, inferior parietal cortex, and posterior parahippocampal gyrus [45]. How-ever, the mechanisms underlying the effect of expectations have been a controver-sial issue. Specifically, expectation suppression has been linked to two opposing hypotheses in the literature, which are called dampening and sharpening of sen-sory representations. Using fMRI and multivariate pattern analysis (MVPA), some research found evidence for the sharpening of the population response for the expected stimulus feature in the primary visual cortex despite reduced BOLD response [19]. Some other research suggested that expectation suppression is ob-served throughout the ventral visual stream, and expectations lead to dampening of the representations in object-selective regions for the expected stimuli (but not in early sensory areas) [45]. Alternatively, it is also suggested that both damp-ening and sharpdamp-ening mechanisms may account for the findings in the literature because of the involvement of different subpopulations of neurons [55] during information processing [28].
Note that in the majority of studies investigating the effect of expectations, neural findings observed in expected and unexpected conditions were not com-pared with a baseline (neutral) condition. Therefore, the difference between the neural response observed in expected and unexpected conditions was interpreted in two ways: in some studies expectations are suggested to lead to decreased neu-ral responses, while in some other studies unexpected conditions were suggested to elicit higher neural responses. Since the neural responses to the expected and unexpected conditions are not compared with a baseline condition, it is hard to interpret whether expectations lead to reduced neural responses or unmet ex-pectations lead to higher neural responses (or both) [17, 28, 54]. Notably, when neural responses to expected and neutral conditions were compared in studies
that included the neutral condition, the finding that expectations lead to de-creases in neural responses was not consistently shown (see [54] for an extensive review). Therefore, more careful investigations are needed to understand the effect of expectations in visual processing.
In light of these empirical findings, several mechanistic cortical models have been proposed, which are generic models for brain function (e.g., [5, 55, 56]). The models are called predictive coding, predictive processing, or predictive computa-tion models in literature. Each model introduces its own structure and possible connections and has different theoretical constructs to unravel the flow of infor-mation processing between brain regions. For example, one of the well-known models, Predictive Coding Theory (PCT) [55], posits the brain as an active infer-ence machine that computes internal predictions that are formed based on prior information. The idea is that during information processing, these predictions are compared with the sensory input, and they are continuously updated to minimize the prediction error. A simple illustration of the predictive coding model can be seen in Figure 1.4. The predictions are considered to be generated by specific subpopulations of neurons called representation (or prediction) units which are hypothesized to exist at each level of the cortical hierarchy, and these predictions are conveyed from higher levels to the lower levels via backward connections. Also, prediction errors are computed by error units, which are hypothesized to exist at each layer of the cortical hierarchy, and they are conveyed from the lower levels to the higher levels via forward connections.
Apart from the PCT, more recently, another biologically plausible cortical model [5] has been introduced and proposed a more simplified structure for infor-mation processing in the brain. In this model, different subpopulations of neurons for prediction or error computation are not defined. Instead, in this model, it is posited that the information processing can be executed only through feedfor-ward and feedback connections. Specifically, in this model, the neural activity is considered to be determined by feedforward drive, feedback drive, and prior drive, and their contributions are governed by specific parameters of the model, which are suggested to correspond to the oscillatory activity and neuromodula-tors [5]. Despite differences in the structure of these models, both (and many)
Figure 1.4: A schematic illustration of the predictive coding model. R represents representation (prediction) units, and E represents error units. In the predictive coding framework it has been suggested that based on prior knowledge brain computes internal predictions about the upcoming sensory stimulus. These predictions are compared with the actual sensory stimulus at each level of the cortical hierarchy. When there is a mismatch between the internal predictions and the sensory stimulus, a prediction error is computed. The predictions are conveyed from higher levels to lower levels via backward connections, and the predictions errors are conveyed from lower levels to higher levels via forward connections. This process has been suggested to be executed by representation (prediction) units, and error units. Reprinted, with permission, from ref. [4]. See Appendix.
Primary Secondary Association
1
I
G
l
~
_
e
_
sp
l
J
~
l~
_
e
_
spl
I o I 0 ,., ,...
... ., ,,, ... (DR(2) - R Prior informationof the predictive processing models make a basic assumption that the brain uses prior knowledge to predict the current state of the world, and this process is ex-ecuted by a dynamic interaction of bottom-up sensory input and top-down prior knowledge and expectations.
Currently, we have considerable amount of empirical evidence that is consis-tent with the assumptions of the predictive processing models (see [57, 58], but also see [54]). Interpretation of empirical findings within the framework of these computational models is an important step to have a better understanding of the effects of expectation in visual processing. On the other hand, unlike rigorous efforts implemented in Bayesian models of behavior, the proposed mechanistic models have not usually been employed to test whether they can explain real data. Modeling on real human data would also allow us to examine whether the assumptions of the models comply with the empirical evidence in the literature. This would, in turn, help us to refine the models accordingly and develop new hypotheses to better understand the effect of expectations in visual processing.
1.4
Current Study
To advance our understanding of whether and how prior knowledge and expec-tations affect early sensory processing, this dissertation attempts to investigate the behavioral effects of prior knowledge and expectations on early visual process-ing and unravel the computational mechanisms that may underlie those effects. As stated earlier, despite the well-established effects of expectations on higher-order mechanisms, their effects on low-level sensory processing remain unclear. In this sense, Chapter 2 of this dissertation investigates the expectation’s effect on early visual processing at the perceptual threshold level. Next, in Chapters 3, 4, and 5, we take a multi-modeling approach to unravel possible computational mechanisms underlying the observed behavioral effects. Specifically, in Chapter 3, we model the behavioral data with a recursive Bayesian model and examine the generalization of these modeling findings in Chapter 4. In Chapter 5, we
implement a recurrent cortical model to discuss possible neural mechanisms un-derlying the behavioral effects. Overall, our findings in this dissertation provide an insight into how early sensory processes can be influenced by expectations. From a broader perspective, this dissertation attempts to link human behavior, a behavioral model, and a mechanistic cortical model to better understand the effect of prior knowledge and expectations on sensory processing.
Chapter 2
Behavioral Effects of Expectation
on Visual Perception
The studies and results presented in this chapter are based on a publication by B.M. Urgen and H. Boyaci, "Unmet expectations delay sensory processes", Vi-sion Research, 181, 1-9, 2021.
Also, the studies and results presented in this chapter are presented in a preprint by B.M. Urgen and H. Boyaci, "When expectations are not met: unraveling the computational mechanisms underlying the effect of expectation on perceptual thresholds", bioRxiv, 545244, 2019.
2.1
Introduction
The effects of prior knowledge and expectations on recognition and decision-making processes are well-established. Expectations have been consistently shown to bias and facilitate perceptual decisions [4, 7, 8, 19, 20, 21, 22, 23, 24, 25, 26, 28]. Specifically, expected stimulus (or in a cued-paradigm congruent stimulus) is de-tected faster and more accurately than the unexpected (incongruent ) one [25, 29].
However, it should be noted that majority of findings on this research are mostly obtained from perceptual decision studies. In these studies, researchers collected and analyzed reaction times of participants to investigate the expectation’s effect on perception. However, reaction time is not the only measure to examine the perceptual processes. In fact, it represents expectations’ effect on a combination of perceptual, cognitive and motor processes. Therefore, a more careful investiga-tion is needed to find out whether there is an effect of expectainvestiga-tion also on related low-level sensory processing. This would allow us to see whether expectations can bias even sensory processes or not.
For this aim, in this study we investigated the effect of expectations on visual perception at the threshold level using a 2-AFC task. Specifically we examined whether expectation has an effect on detecting the spatial location of a stimulus, which is also called individuation. We measured duration thresholds, which is the shortest presentation duration that the participants can successfully detect the location of the stimulus. This measure allowed us tap into sensory processes.
We also examined whether expectation’s validity can modulate perceptual thresholds. Majority of previous studies that examined the effect of expectation used a fixed validity for expectation (e.g. only 75%), and compared the observed findings for expected and unexpected conditions. This application did not allow us to see whether/how expectation’s validity modulates detection performance. More importantly, as the performances in the expected and unexpected condi-tions were not usually compared to a baseline condition (e.g. when there is no expectation), it is hard to differentiate whether the expected stimulus is detected faster or the unexpected is detected slower (compared to the baseline). For this aim, we systematically manipulated the expectation’s validity in different exper-imental conditions. In this sense, validity of expectation was 100%, 75%, 50% and neutral (no expectation) in separate experimental sessions. We included the 100%-validity condition as a control condition where expectations were always valid, and the neutral condition as a baseline condition where there was no ex-pectation. Thus, in our experiment there were congruent (expected), incongruent (unexpected) and neutral trials. We hypothesized that unexpected trials would show higher duration thresholds compared to expected trials, and this difference
might be modulated by the validity of expectation. In this respect, we conducted two experiments, and details of stimuli, experimental designs and procedures can be seen in the next sections.
2.2
Experiment 1
In Experiment 1 prior information was implicated in cues which were used to inform participants about which category of target stimuli will be presented. In other words, cues were indicators of upcoming target stimuli category. However, participants’ task was to report the spatial location of that target stimuli. There-fore, prior information that is embedded in cues were task-irrelevant to minimize the effect of top-down attentional mechanisms on our results as much as possible. We had two predictions in Experiment 1. Firstly, when cue validity is high (i.e. 75%), we expect to observe longer duration thresholds in the trials where the target category is not correctly predicted by the cue (incongruent trials) compared to the trials where the cue predicts the correct target category (congruent trials). Secondly, participants were expected to update their estimates of stimulus-cue associations for each experimental condition so that duration thresholds should not be different between congruent and incongruent trials when they are equally likely to occur (i.e. 50%)
2.2.1
Materials and methods
2.2.1.1 Participants
Eight naive participants (4 female; 24.5±2.33 years) participated in Experiment 1. All participants had normal or corrected to normal vision and they did not report a history of neurological disorder. Participants gave their informed consent prior to the experimental sessions. The experiment was approved by the Research Ethics Committee of Bilkent University. Note that we performed a G* power
analysis to estimate the sample size using the effect size of [25], and the estimated sample size was 4 (with 0.95 power, alpha = .05). Also note that similar number of participants are commonly used in studies that measure duration thresholds (e.g. [59, 60, 61, 62, 63, 64, 65]).
2.2.1.2 Stimuli
Stimuli consisted of ten face images (five female; age range was 19-69) taken from Face Database of the Park Aging Mind Laboratory [66] and ten house images from Scene Understanding Database from the Princeton Vision Group [67]. Pic-tures of cues (informative: face, house; uninformative (neutral): question mark) that were shown in the experiment were taken from The Noun Project’s website (www.thenounproject.com; Person designed by Alex Fuller, House designed by OCHA Visual Information Unit, Question mark designed by Vicons Design) and
were scaled to 3.5 x 3.5◦ visual angle. As mask, scrambled version of the face and
house images were generated. The images were divided into 49 cells by creating 7 x 7 grids for each. After that each cell was randomly assigned to different lo-cations. The stimuli including face images, house images, and mask images were
scaled to 10.5 x 10.5◦ visual angle, converted to grayscale, histogram-matched
(scaled to the mean luminance of all stimuli) by using SHINE Toolbox [68], and adjusted and matched to a very low contrast value (2%). Stimuli were shown on a CRT monitor (HP P1230, 22’, 1024 x 768 resolution), and the refresh rate was 120 Hz. Participants seated at 60 cm from the screen. Experiment was programmed in MATLAB 2016a using Psychtoolbox [69].
2.2.1.3 Experimental Design
Stimuli were presented on a gray background (RGB: 128, 128, 128). At the beginning of each trial a fixation dot and a cue were simultaneously shown at the center of the screen. Cues were presented for 2 seconds at the center of the screen and were either informative (face or house) or neutral (question mark) depending on the experimental condition (See each experimental condition for
details). Next, a target stimulus, which was an intact face or house image, and a scrambled version of the intact image were shown in left and right side of the
screen at 10◦ eccentricity. Presentation duration of the images were determined
by an adaptive staircase procedure. Therefore, the images stayed on the screen for different durations, which varied adaptively (See Procedure for details). Next, different scrambled versions of that target stimulus were shown as masks on the same locations for 64 ms. Then, an empty display with a gray background was shown and participants were asked to report their decisions. Participants’ task was to detect spatial location of the target image as soon as possible by pressing left or right arrow key of keyboard. Participants were asked to maintain their fixation on the fixation dot during the trial. Finally, a feedback message was
written on the screen, e.g. "correct" or "wrong" to the participants for 752
ms. Trials that include same category of the cue and image are called congruent (expected) trials. Trials that include different category of the cue and image are called incongruent (unexpected) trials. In each experimental condition, equal number of each cue (face and house) appeared in random order, and equal number of each target stimulus (face and house) was presented. Also note that the target stimulus was randomly assigned to one of the two locations (left or right) in each trial in each experimental condition. See Figure 2.1 for experimental design.
2.2.1.4 Procedure
Experiment 1 consisted of a training session and an experimental session which in-cludes four experimental conditions. In all sessions, adaptive staircase procedure with a two alternative forced-choice (2AFC) paradigm was applied to derive dura-tion thresholds for spatial locadura-tion detecdura-tion in congruent and incongruent trials. Presentation duration of the target image and scrambled version of it were varied adaptively from trial to trial. Each trial’s duration was determined by the accu-racy of the participants’ response in the previous trial. Specifically, each wrong answer or two consecutive correct answers resulted in a 8 ms (step size) increase or decrease of the following trial’s target presentation duration respectively. Mul-tiple pseudorandom 2-up 1-down staircases were interleaved in the experiment.
Each staircase was set to interleave at least once before any of the other staircases interleaves for the second time. At the beginning of each experimental condition, one staircase started from a relatively short duration (minimum 8 ms, varied for each participant, and the other staircase started from a long duration (varied for each participant). The reason of the variation in initial durations between partic-ipants was the individual differences between particpartic-ipants. There were 30 trials in each staircase in all experimental conditions, but number of staircases were varied for each experimental condition (See experimental conditions for details).
2.2.1.4.1 Training Session. Prior to the experimental session, each
partic-ipant completed a training session in order to stabilize their thresholds. Partic-ipants seated at 60 cm from the screen and their head were stabilized with a chin-rest. The training session consisted of at least 2 (up to 5) short experiments where the cue was always informative (face and house cue) and 100% valid in indicating the target stimulus category. Each experiment in the training session had 120 trials and there were equal number of face and house cue trials. Num-ber of experiments completed in the training session varied for each participant, and it is determined by whether the participant’s threshold stayed in the same interval (in terms of step size: 8 ms) for at least two sequential experiments.
2.2.1.4.2 Experimental Session. All participants completed four
experi-mental conditions in randomized order in separate sessions. Participants were informed about the probability of cue-validity prior to the experiments.
100%-validity condition. This experimental condition was included as a control condition. Cue (face or house) informed participants about the upcoming target stimulus category (either face or house image) with a 100% validity so that there was no violation of expectations. There were 120 trials in total including 60 trials where face image was presented following face-cue, and 60 trials where house image was presented following house-cue. There were four staircases in this condition.
75%-validity condition. In this experimental condition the cue was always informative (face and house cue) and 75% valid in indicating correct target stim-ulus category (face or house image) during the experiment. Equal number of face cue and house cue trials were presented. There were 16 staircases and 480 trials in total. There were 360 congruent trials where the target type was predicted by the cue, and 120 incongruent trials where the cue misled the participants about the upcoming target category in this condition.
50%-validity condition. In this experimental condition cue was always in-formative (face or house) and alerted participants about the upcoming target stimulus category (face or house image) with a 50% validity. Therefore, there were 240 trials in total including 120 congruent and 120 incongruent trials. Equal number of face-cue and house-cue trials were presented and number of staircases were eight.
Neutral condition. Similar to 100%-validity condition, this experimental condition was also included as a control condition. However, this condition was different from the other conditions in the way that there was no informative cue (face or house) that alerts participants about the upcoming target category. Rather, the cue was neutral, a question mark, during the experiment. Therefore, cue-based predictions regarding the category of the upcoming stimuli were not formed. Except the cue type, all experimental stimuli and design were the same with the other conditions. There were four staircases and 120 trials in total, and equal number of face and house images were presented.
2.2.1.5 Statistical Analysis
Duration thresholds (70.7% accuracy) were estimated for each trial type, includ-ing congruent, incongruent and neutral trials, for each condition usinclud-ing Palamedes toolbox [70] with Logistic function using Matlab 2016a. A 2 (congruency: con-gruent, incongruent) x 2 (validity: 75%, 50%) repeated measures analysis of variance (ANOVA) was conducted to examine the effect of expectation on dura-tion thresholds. Moreover, we conducted two-sample paired t-tests to investigate
Figure 2.1: Experimental design. Sample trial sequences. a. Congruent (expected) trial. b. Incongruent (unexpected) trial. c: Neutral trial. Except the neutral trials, an informative cue predicted the category of upcoming target image with a certain validity. The validity of the cue was 100%, 75%, and 50% in different experimental sessions. In the neutral trials the cue was a question mark and was not informative about the upcoming target image category. Task of the participants was to detect the spatial location of the target image. See text for more details.
any difference between thresholds of 100%-validity condition and thresholds of neutral (no-expectation), 75%-validity and 50%-validity conditions respectively.
2.2.2
Results
Figure 2.2 shows duration thresholds of participants for each trial type in each validity condition (see Appendix for psychometric function fits of each partici-pant). We performed 2 (congruency: congruent, incongruent) x 2 (validity: 75%, 50%) repeated measures ANOVA to examine the effect of expectation on duration thresholds. We found that the main effect of congruency is statistically significant
(F (1,7) = 11.956, p = 0.011, n2 = 0.104). However, there was no main effect of
validity or interaction (F (1,7) = 2.848, p = 0.135, n2 = 0.024; F (1,7) = 0.155, p
= 0.705, n2 = 0.001). Next, we examined whether there is any difference between
the thresholds of congruent and incongruent trials in each validity condition as the effect is present in nearly all participants at the individual level. We found that incongruent trials showed longer duration thresholds than the congruent trials in
a congruent
•
cue 2000 ms targetb
variable duration mask 64ms incongruent response correct! feedback 752 ms C neutral8
Figure 2.2: Results of Experiment 1. a. Duration thresholds of 100%-validity and neutral conditions. b. Duration thresholds of congruent and incongruent trials in 75%-validity condition. c. Duration thresholds of congruent and incon-gruent trials in 50%-validity condition.
75%-validity condition (t (7) = 3.079, p = 0.018, d = 1.089). However, there was no difference between congruent and incongruent trials in 50%-validity condition (t (7) = 2.266, p = 0.058, d = 0.801). Finally, we conducted two-sample paired t-tests between (1) 100%-validity and neutral conditions, and (2) congruent tri-als of 75%- and 100%-validity conditions, and (3) congruent tritri-als of 50%- and 100%-validity conditions. All tests showed that the thresholds of the conditions were not different from each other (t (7) = 0.676, p = 0.521, d = 0.239; t (7) = 0.457, p = 0.661, d = 0.162; t (7) = 1.404, p = 0.203, d = 0.496 respectively).
2.3
Experiment 2
All participants took part in Experiment 1 after they were gone under a training session. The training session was included in Experiment 1 in order to stabilize the thresholds of participants so that any effect of learning (between different experimental sessions) can be eliminated, and would not bias the results in differ-ent experimdiffer-ental conditions. However, it is also possible that the training itself affected the results as the validity of the expectation in the experiments were 100%. To eliminate any confounding effect of training on our behavioral find-ings, in Experiment 2 we conducted the same experiments on a separate group of participants who did not participate a training session.
80 1 ~ ~ -70 60 en .S 50 "'O :g 40 gi i: 30 1-20 10 100%-valldity Neutral Experimental condition 80 70 60 en .S 50 "'O :g 40 rn Cl> i: 30 I-20 10 * 80 r - - ,
~
70 60 en .S 50 "'O :g 40 rn Cl> i: 30 I-20 10Congruent Incongruent Congruent Incongruent 75%-validity condition 50%-validity condition