with polypropylene
Article in Journal of Engineering Research · June 2018CITATIONS 0 READS 727 2 authors: Serkan Tapkin
Antalya Bilim University
52 PUBLICATIONS 566 CITATIONS SEE PROFILE Mustafa Keskin Anadolu University 8 PUBLICATIONS 20 CITATIONS SEE PROFILE
All content following this page was uploaded by Serkan Tapkin on 03 March 2020.
Number of design gyrations for 100 mm compacted asphalt mixtures
modi-fied with polypropylene
Serkan Tapkın* and Mustafa Keskin**
*Professor, Antalya Bilim University, Department of Civil Engineering, Antalya, Turkey **Graduate Student, Anadolu University, Civil Engineering Department, Eskişehir, Turkey *Corresponding Author: [email protected]
ABSTRACT
There is no standard accepted by highway authorities on the compaction procedures of 100 mm diameter gyratory compactor specimens. In previous studies on gyratory compaction, the utilisation of either coring from 150 mm specimens or preparing taller specimens than the usual 63.5 mm long Marshall specimens has been undertaken. The utilisation of 150 mm mould sizes introduces an important amount of mechanical disturbance during the coring process of 100 mm diameter specimens out of them. The novelty of the present study is that a new standard for preparing gyratory compactor specimens with a diameter of 100 mm and length of approximately 63.5 mm by utilising polypropylene fibers of 3 mm multifilament for the modification has been proposed for the first time. To achieve optimal conditions, in addition to gyratory compaction, modified bitumen samples’ physical properties, especially rotational viscosities, were also investigated in a detailed manner. Physical and mechanical tests have been carried out using the specimens prepared by changing the main testing parameter of gyration number from 30 to 70. The design gyration number of 100 mm polypropylene fiber reinforced dense bituminous mixtures has been determined as 33 under medium traffic conditions.
Keywords: polypropylene fibers; gyratory compaction; 100 mm diameter specimens; rotational viscosity; design gyration number; medium traffic conditions.
INTRODUCTION
Polypropylene fiber (PPF) modification is a unique technique that has been intensively introduced in the literature in the last decade by various researchers (Lee et al., 2005; Ghaly, 2008; Zhou et al., 2008; Zhou et al., 2009; Al-Hadidy & Tan, 2009; Zhang et al., 2010a; Zhang et al., 2010b; Othman, 2010 & Abtahi et al., 2010). The definition of fiber-reinforced concrete is proposed by ACI 116R-00, as concrete, which contains randomly dispersed fibers (ACI Committee 116, 2000). However, the utilisation of multifilament type PPFs, which were and is actually being used in Portland cement concrete engineering applications for many years since PPFs improve the performance of Portland cement concrete for compression, flexure, and tension, are also used as a material reinforcing concrete, and are utilised for controlling cracks, which are not structural such as meshes, has emerged and Tapkın and his colleagues utilised various types with different lengths of multifilament fibers for the first time in asphalt concrete (Tapkın, 2008; Tapkın et al., 2009a; Tapkın et al., 2009b; Tapkın et al., 2010; Tapkın et al., 2011; Tapkın & Özcan, 2012). In the present study, the wet basis modification technique was used to modify the bituminous mixtures. From the standpoint of workability, 3 mm multifilament type (M-03) fibers were determined as the best modifiers and, based on static creep, mechanical testing of specimens using the Marshall compaction (MC) method and finally utilising stereo microscopes, with modification by M-03 type
PPFs, the optimal addition amount has been determined as 5.5‰ by aggregate weight (Tapkın & Özcan, 2012). With the proposed amount, PPFs completely melt in the sample of bitumen and the continuous phase for PP becomes bitumen (Tapkın et al., 2009a).
The corresponding author of the aforementioned studies has carried out them with MC technique, which is widely accepted by all of the research laboratories worldwide (Tapkın et al., 2011). However, it has to be noticed that MC is not simulating the actual compaction practices on site as close as gyratory compaction does. In particular, in the last three decades, the utilisation of gyratory compactors (GCs) in the research laboratories gained increasing popularity. The study by Roberts et al. gives an important and complete review with regard to the utilisation of GCs in design of bituminous mixtures (Roberts et al., 2002).
There are many studies on GC practices (Khan et al., 1998; Wang et al., 2000; Parker et al., 2000; Buchanan & Brown, 2001; Asi, 2007; Watson et al., 2008). These publications deal mainly with GC practices but a reader has to be aware of the fact that the MC, which has 100 mm of specimen diameter and 63.5 mm of specimen height and produced by various blows of the compaction hammer, also is playing a primary role in the foundation of gyratory compaction technique.
In the aforementioned gyratory compaction studies, the utilisation of either coring from 150 mm specimens or preparing taller specimens than the usual 63.5 mm long Marshall specimens has been investigated. The novelty of the present study is that a new standard for preparing GC specimens with a diameter of 100 mm and length of approximately 63.5 mm by utilising PPFs of 3 mm multifilament for the modification has been carried out for the first time. To achieve optimal conditions, in addition to gyratory compaction, modified bitumen samples’ physical properties, especially rotational viscosities, were also investigated in a detailed manner.
There are two primary objectives of the present study. Firstly, it was aimed at proposing a correspondence between the previous studies of the corresponding author, which were carried out by utilising MC (Tapkın et al., 2011; Tapkın & Özcan, 2012). The pursuit of the physical and mechanical similarities between the Marshall and GC specimens plays a vital role. Secondly, the analysis of properties of 150 mm specimens fabricated by utilising GCs constitutes nearly all of the literature about the subject matter. There is only one special study dealing with GC specimens of 100 mm diameter till date (Jackson & Czor, 2003). 100 mm specimens were used in place of 150 mm specimens by the Tennessee Department of Transportation for quality control and for verifying the test results. This recommendation, according to the outcomes of the scientists, is valid for specimens that have an aggregate size of 2.54 cm maximum or less, which is also considerably reasonable and fits to the current standards in Turkey (General Directorate of Highways, 2006). The possible advantages gained by the utilisation of the moulds with a diameter of 100 mm in order to prepare specimens prepared via GC can be stated as follows:
i) Size of the sample is decreased by 400%; thus, preparation time, space for storage, and moving the materials are abridged considerably.
ii) Laboratory testing in a conventional manner with specimens of 100 mm has become possible. iii) Maximum aggregate size of 2.54 cm or smaller makes up the bulk of the mix designs for
surface layer in Tennessee and countries including Turkey. As a consequence, 150 mm moulds are frequently not complying with AASHTO and ASTM requirements.
The introduction part is a review of the published literature on PPF modification and Superpave gyratory compaction practices. Moreover, the outlet of the proposed study by using gyratory compaction in preparing especially asphalt specimen diameters of 100 mm and length of 63.5 mm has been investigated in the laboratory environment. Next, the experimental program for the preparation of PPF reinforced bitumen samples by analysing the standard physical testing parameters such as penetration, ductility, softening point, specific gravity, flash and fire points, and most importantly rotational viscosity (RV) analyses at higher temperatures and modification levels than the standard ones presented. Then, the optimal modification amount of 5.5‰ PPF modified GC specimens of 100 mm by aggregate weight is further analysed by changing the main testing parameter of gyration number from 30 to 70 by 5 increment is described. Finally, the mechanisms leading to the determination of the design gyration number for optimal PPF reinforced dense bituminous mixtures as 33 have been explored in a detailed manner. This has been conducted for traffic conditions of medium, aggregate sources of specific type and similar bitumen, similar gradation of aggregate, similar proportioning of mix, and similar conditions of laboratory and technique of modification.
EXPERIMENTAL STUDIES
Physical properties of standard aggregate and bituminous binder
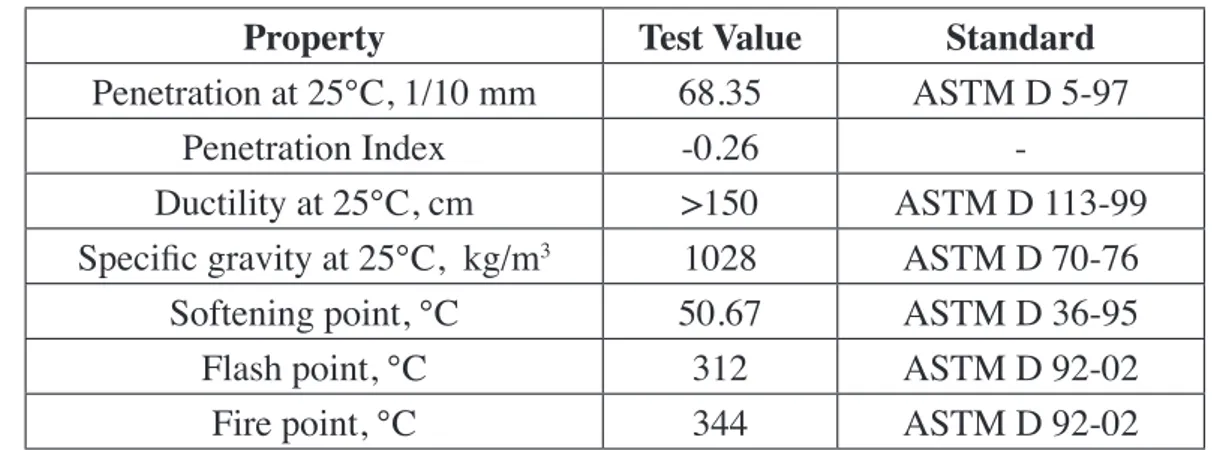
Bitumen, which has a penetration value of 50/ 70 from a resident refinery, was used for the fabrication of GC specimens. Table 1 presents the reference bitumen’s physical properties. The determination of the RV values will be analysed separately.
Table 1. Physical properties of the reference bitumen (Tapkın & Keskin, 2013).
Property
Test Value
Standard
Penetration at 25°C, 1/10 mm
68.35
ASTM D 5-97
Penetration Index
-0.26
-Ductility at 25°C, cm
>150
ASTM D 113-99
Specific gravity at 25°C, kg/m
31028
ASTM D 70-76
Softening point, °C
50.67
ASTM D 36-95
Flash point, °C
312
ASTM D 92-02
Fire point, °C
344
ASTM D 92-02
M-03 type PPFs were utilised in order to alter standard 50/ 70 penetration bitumen on a wet basis to prepare GC specimens. A low shear mixer at 500 rpm was used to premix the fibers with bitumen for 2 hours. 500 rpm is one of the greatest benefits of PPF modification. When compared to other polymer modifiers, 500 rpm of shear rate shows the main advantage of PPF modification to reach the required degree of compatibleness. For other polymer modifiers, higher rates of shear mixing are needed. Around 165 -170°C mixing temperature was utilised (as viscosity values are higher, this can be expected and this temperature is increased when more PP is added) (Chen & Lin, 2005). For testing, reference bitumen was also exposed to the 165 -170°C to match the effects of ageing that is determined for the modification of PPFs. M-03 type fibers were used to make comparison with the lead author’s earlier studies (Tapkın et al., 2009a; Tapkın et al., 2011; Tapkın & Özcan, 2012). Optimal addition amount of 5.5‰ fiber content by aggregate weight was
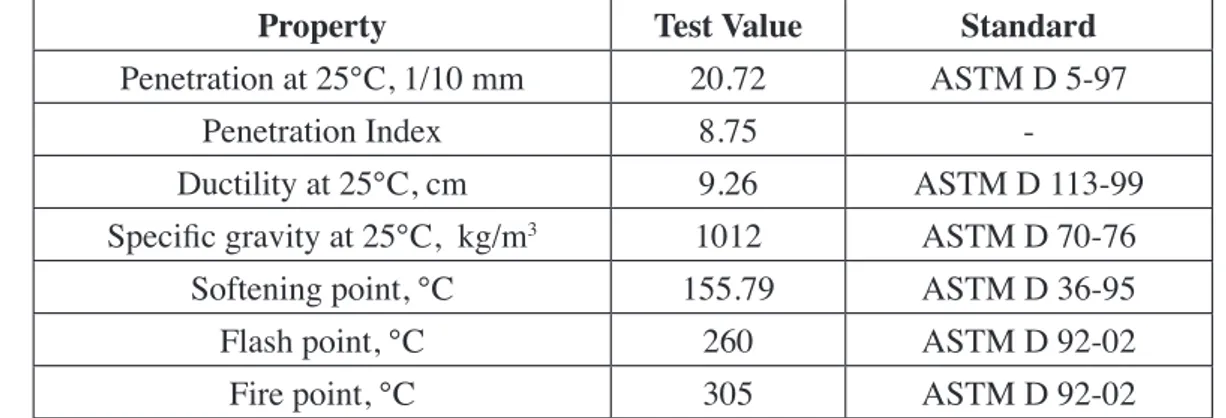
used. PPFs completely melt in bitumen for 5.5‰ fiber content by aggregate weight. In this way, continuous phase of bitumen for PP particles does arise. Marshall design was utilised in the design process. Mixtures’ bitumen contents, which correspond to maximum unit weight and stability, 4% of air voids (Va) and 70% of voids filled with asphalt (Vf), were determined and averaged due to the requirements of the current standards (General Directorate of Highways, 2006). To validate the results, two Marshall designs were done. 5% of optimum bitumen content was found in the first design. The result of the second one was 4.96%. Due to the proximity of these results, optimum bitumen content has been utilised as 5.0%. The corresponding author’s previous studies have been used in order to have check (Tapkın et al., 2009a; Tapkın et al., 2009b; Tapkın et al., 2010; Tapkın et al., 2011; Tapkın & Özcan, 2012). For the PP modified specimens with fiber amount of 5.5‰ by aggregate weight, optimum bitumen content of 5% has been utilised. In Table 2, for the PP modified samples, physical properties can be found.
Table 2. Physical properties of the polypropylene modified bitumen samples (5.5 ‰ by weight of aggregate)
Property Test Value Standard
Penetration at 25°C, 1/10 mm 20.72 ASTM D 5-97
Penetration Index 8.75
-Ductility at 25°C, cm 9.26 ASTM D 113-99
Specific gravity at 25°C, kg/m3 1012 ASTM D 70-76
Softening point, °C 155.79 ASTM D 36-95
Flash point, °C 260 ASTM D 92-02
Fire point, °C 305 ASTM D 92-02
Penetration was dropped from 68.35 to 20.72 dmm. Temperature susceptibility has decreased considerably by the increase in penetration index. Specific gravity values have decreased from 1028 to 1012 kg/m3 with PP modification. Ductility values have been reported as 9.26 cm. The softening points have increased by 105.12°C (glycerine was the medium of the test). The presented values indicate the effect of PP modification acting in a significantly positive manner to the physical and chemical properties of reference bitumen (Tapkın & Özcan, 2012).
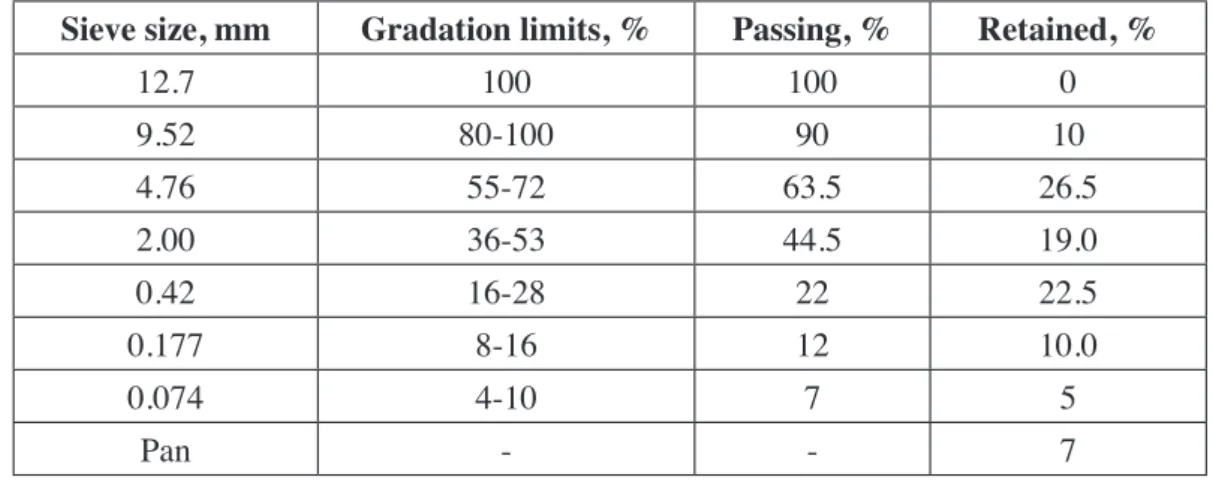
Wearing course type 2 gradation limit was used, which follows the current Turkish standards (General Directorate of Highways, 2006). Calcareous aggregate was utilised. Filler was also obtained from this calcareous material. Technical data about aggregates are presented in Tables 3
and 4. 2739 kg/m3 is the apparent specific gravity of the filler. In addition, information on gradation
is listed in Table 5.
Table 3. Physical properties of coarse aggregates (Tapkın & Keskin, 2013)
Property Test Value Standard
Bulk specific gravity, kg/m3 2698 ASTM C 127-04
S.S.D. specific gravity, kg/m3 2703 ASTM C 127-04
Apparent specific gravity, kg/m3 2712 ASTM C 127-04
Table 4. Physical properties of fine aggregates (Tapkın & Keskin, 2013)
Property Test Value Standard
Bulk specific gravity, kg/m3 2684 ASTM C 128-04
S.S.D. specific gravity, kg/m3 2710 ASTM C 128-04
Apparent specific gravity, kg/m3 2756 ASTM C 128-04
% ,Water absorption 0.962 ASTM C 128-04
Table 5. Type 2 wearing course gradation according to General Directorate of Highways, 2006.
Sieve size, mm Gradation limits, % Passing, % Retained, %
12.7 100 100 0 9.52 80-100 90 10 4.76 55-72 63.5 26.5 2.00 36-53 44.5 19.0 0.42 16-28 22 22.5 0.177 8-16 12 10.0 0.074 4-10 7 5 Pan - - 7
RV studies carried out under varying ambient temperatures
According to ASTM D4402- 06, some bituminous binders might show non-Newtonian behaviour by the testing conditions of this method (which are either 135°C or 165°C accepted worldwide). It is clear that viscosity values, which are non-Newtonian, do not have absolute values. Furthermore, under the conditions of use, the field performance of the measurements cannot be predicted, but the measurements carried out by this test method also might not mimic the behaviour of the fluid within the specific measurement system (ASTM D4402- 06, 2006). Based on this rationale and the experiences of the corresponding author through years, the testing temperature was increased to 185°C in the temperature-controlled thermal chamber of the rotational viscometer. By utilising the above mentioned software, the user can change the rotational speed either manually or by programming the viscometer in order to visualise the effects of the speed change on the viscosity values at a specified temperature.
The tests have been carried out at 135°C, 165°C, and 185°C as well as at bitumen modification levels of 3‰ and 5‰ of M-03 type PPFs. In all of the tests, the rotational viscometer was used in such a manner that, in addition to the standard procedure that is stated in ASTM D4402 -06, Rheocalc software was used in the following manner:
a) the test was started with a rotational speed of 20 rpm for one minute;
b) the test results were recorded, and one minute of rest period was allowed to pass;
c) then the rotational speed was changed to 30 rpm, and the above two steps were repeated until the rotational speed reached 200 rpm.
The above procedure is substantially effective in the sense that the 5.5‰ PP modified specimens are experiencing problems in the determination of Brookfield viscosity values by the routine procedures
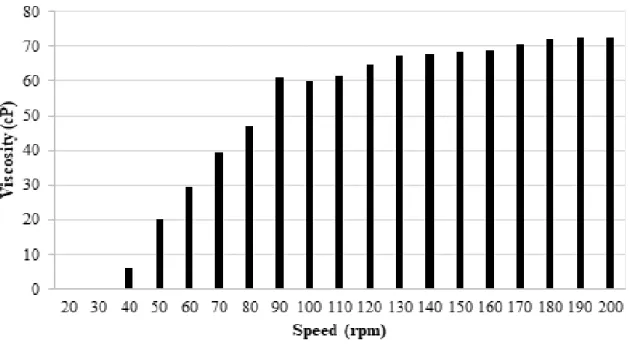
at especially lower testing temperatures such as 135°C and 165°C. At these temperatures, the modified bitumen samples are so viscous that there is also a chance of causing harm to the spindles (Keskin, 2011). In Figures 1, 2, and 3, a reader may find the test results for reference, 3‰ and 5.5‰ PP modified specimens, respectively, at 135°C according to the above procedure.
Figure 1. Rotational viscometer test results obtained via Rheocalc software at 135°C for reference
bitumen samples. (Quadratic curve fit, R2 = 0.909, Viscosity = 2.247*Speed – 0.07*Speed2 + 181.351)
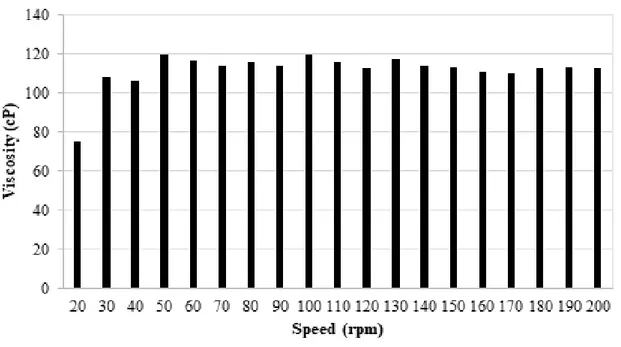
Figure 2. Rotational viscometer test results obtained via Rheocalc software at 135°C for M-03 type polypropylene modified bitumen samples with an addition amount of 3‰ by weight. (Quadratic
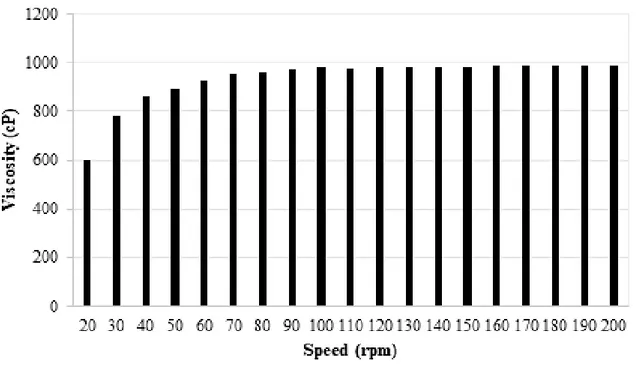
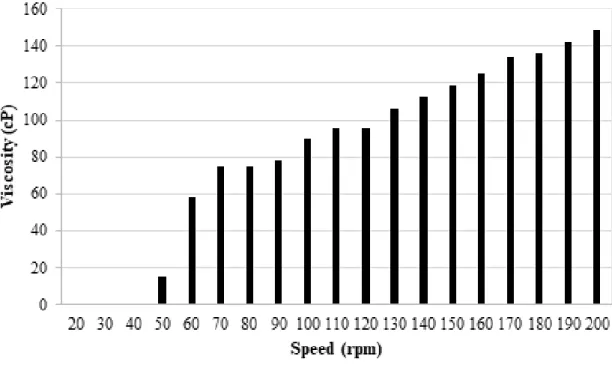
Figure 3. Rotational viscometer test results obtained via Rheocalc software at 135°C for M-03 type polypropylene modified bitumen samples with an addition amount of 5.5‰ by weight. (Quadratic
curve fit, R2 = 0.825, Viscosity = 5.604*Speed – 0.020*Speed2 + 618.446).
When Figure 1 is examined, it can be visualised that, for 20 rpm rotation speed, the Brookfield viscosity can be obtained from the software as 187.50 cP. However, one has to be aware of the fact that the torque value obtained by the same software should be at least equal or greater than 10%. According to ASTM D4402- 06, measurements will be more accurate at higher torque readings (ASTM D4402 -06, 2006). Therefore, if the data is analysed once more, it can be seen that, between 100 and 200 rpm rotation speeds, the viscosity values show a little change and thus the RV value can be accepted as 343.75 cP, which is valid for SC4 -27 spindle (ASTM D4402 -06,2006; Keskin, 2011) (arithmetic average of the two values corresponding to 100 and 200 rpm as there is a plateau between these two values).
Due to the storage stability problems of the PP modified specimens, the testing has immediately started when the modified bitumen is placed into thermal chamber of the rotational viscometer. For 20 rpm rotation speed, the Brookfield viscosity has been read from the software as 400.0 cP as shown in Figure 2. But this value is valid for a torque value of 3.20%. According to the above discussion, this value is well below 10%. Hence, if the data is analysed once more, it can be seen that, between 100 and 200 rpm rotation speeds, the viscosity values show a little change and therefore this value can be accepted as 743.75 cP.
In Figure 3, for 20 rpm rotation speed, the Brookfield viscosity has been read from the software as 600.0 cP. But this value is valid for a torque value of 4.80%. According to the above discussion, this value is well below 10%. Therefore, if the data is analysed once more, it can be seen that, between 100 and 200 rpm rotation speeds, the viscosity values show a little change and the torque values are well above 10% and thus this value can be accepted as 983.75 cP.
Figure 4. Rotational viscometer test results obtained via Rheocalc software at 165°C for reference bitumen samples. (Quadratic curve fit, R2 = 0.976, Viscosity = 1.231*Speed – 0.004*Speed2 – 29.792)
Similar arguments to the above discussion are valid for 3‰ PP modified bitumen samples at 165°C testing temperature. The acceptable torque level is attained between 120 and 200 rpm rotation speeds of the spindle, and therefore the viscosity value can be accepted as 209.59 cP as shown in Figure 5.
Figure 5. Rotational viscometer test results obtained via Rheocalc software at 165°C for M-03 type polypropylene modified bitumen samples with an additional amount of 3‰ by weight.
Figure 6. Rotational viscometer test results obtained via Rheocalc software at 165°C for M-03 type polypropylene modified bitumen samples with an addition amount of 5.5‰ by weight.
Similar arguments are valid for 5.5‰ PP modified bitumen samples at 165°C testing temperature. The acceptable torque level is again attained between 100 and 200 rpm rotation speeds of the spindle and therefore the RV value can be accepted as 381.88 cP as can be seen in Figure 6.
For 185°C testing temperature and 3‰ PP modified bitumen samples, the viscosity value can be well accepted as 112.50 cP as the torque value is very near to 10% (please refer to Figure 7).
Figure 7. Rotational viscometer test results obtained via Rheocalc software at 185°C for M-03 type polypropylene modified bitumen samples with an addition amount of 3‰ by weight.
Finally, for 185°C testing temperature and 5.5‰ PP modified bitumen samples, the viscosity value can be well accepted as 142.11 cP as the torque value is just above the acting limit of 10% (please refer to Figure 8).
Figure 8. Rotational viscometer test results obtained via Rheocalc software at 185°C for M-03 type polypropylene modified bitumen samples with an addition amount of 5.5‰ by weight.
(Quadratic curve fit, R2 = 0.964, Viscosity = 1.606*Speed – 0.003*Speed2 – 40.051.)
DETERMINATION OF THE DESIGN GYRATION NUMBER OF PP MODIFIED
DENSE BITUMINOUS MIXTURES
IPC Servopac GC was used to fabricate asphalt specimens (IPC, 2009). This was a research type GC and therefore it was possible to change the ram pressure and the gyration angle through the studies. However, in this study, only gyration number criterion was further investigated to obtain the design gyration number. More than 300 specimens have been fabricated and tested. Test results were validated with one of the previous studies of the corresponding author in which MC was used (Tapkın & Özcan, 2012). The mechanisms behind the compaction scheme of GCs are not the same as Marshall procedure but for the aggregate sources of specific type and similar bitumen, similar gradation of aggregate, similar proportioning of mix, similar conditions of laboratory and technique of modification, previously obtained data is offering a considerably reliable basis for the determination of design gyration number for PP modified GC specimens. This arises from the fact that the physical properties show an important amount of similarity between these two compaction techniques as these two sets of data have been obtained from the same bitumen source, from the same aggregate source, and in the same laboratory conditions (Tapkın & Özcan, 2012; Özcan, 2008). To find the anticipated design gyration number, detailed tests have been carried out. The followed procedure during the testing phase of these studies can be stated as follows:
a) For GC specimens which are 100 mm and modified with PPFs, the air void values should lie between 3.0% and 5%. It needs to be noticed that again, the target Va concept that is valid for surface courses has been utilised. This value might seem as if it is a bit higher than the standards but due to the nature of the PPF modification, which is introducing more Va to the system and according to the acting standards; this is quite acceptable (Tapkın et al., 2011; Tapkın & Özcan, 2012; General Directorate of Highways, 2006).
b) The air void values obtained via MC were tried to be simulated by the utilisation of the IPC Servopac GC’s embedded software and some more detailed analyses carried out on unit weight measurement logs (Keskin, 2011; IPC, 2009). By the aid of this software, Va (which was the main parameter explored in detail), gyration angle, unit weight, specimen height, ram pressure and shear stress can be examined online.
c) Some other analyses were also undertaken. Gyration numbers were changed, and the air void values were observed. In addition, the ram pressure and gyration angle values were further changed in order to reach more solid conclusions. However, in this study, having experience from the studies that have been carried out by using reference specimens, only the pursuit of design gyration number via changing the gyration numbers has been presented. All of the physical and mechanical values have been checked with the properties of Marshall specimens previously prepared (Özcan, 2008).
Standard analyses with variations of gyration
number between 30 and 70 by 5 increments
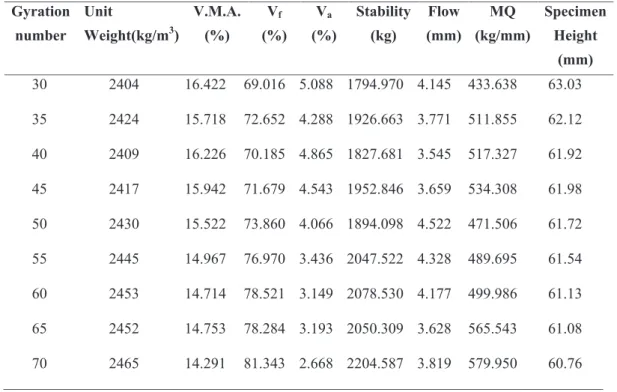
In previous studies, 600 kPa ram pressure,1.25° gyration angle, gyration speed of 30 rpm and at least 185°C of compaction temperature have been utilised with varying gyration numbers between 30 and 70 with 5 increments for the fabrication of 100 mm PP modified GC specimens. Also the gyration numbers have been increased up to values greater than 70s reaching sometimes 120s, but these gyration numbers, as can be clearly expected, have ended up with substantially low air void values, and therefore they are not presented in this study. In Table 6, a reader may find the average test results that have been obtained, namely, for 30 gyration (6 specimens), 35 gyration (7 specimens), 40 gyration (3 specimens), 45 gyration (3 specimens), 50 gyration (3 specimens), 55 gyration (3 specimens), 60 gyration (3 specimens), 65 gyration (2 specimens), and 70 gyration (24 specimens).
The criteria for surface courses are listed in Table 7 (General Directorate of Highways, 2006). A reader should be aware of the fact that, like many of the other agencies worldwide, with a few exceptions, these values are valid for Marshall specimens.
Table 6. The average physical and mechanical test values of M-03 type PPF modified GC specimens prepared by standard analyses with varying gyration number.
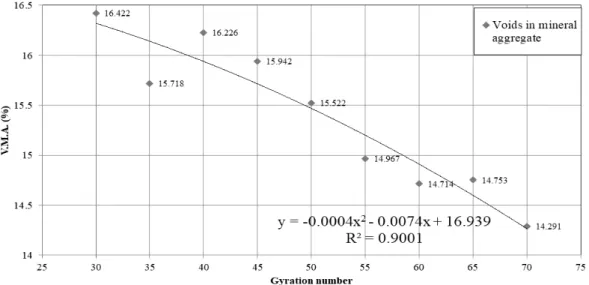
Figure 10. V.M.A. versus gyration number graph analyses.
Figure 11. Vf versus gyration number graph analyses.
Figure 13. Stability versus gyration number graph analyses.
Figure 14. Flow versus gyration number graph analyses.
Figure 16. Specimen height versus gyration number graph analyses.
Table 7. Criteria for surface courses that have been stated in
When Figures 1 to 8 are analysed, the following conclusions can be drawn:
a) Apart from the fact that flow values are introducing a big amount of variability to the test results and, therefore, also affect the Marshall quotient values, the coefficient of determination for all of the parameters analysed is well above 0.89, except the stability value (which is 0.84). The reason for the minor decrease in the coefficient of determination in stability values is due to the nature of PPF modification which is introducing a small amount of variability in the test results (it should be noted that 0.84 is itself showing a good correlation amount between stability and gyration numbers). It is clear that 100 mm PPF modified specimens were prepared in a dependable manner providing a very sound basis for future analyses.
b) The stability values are well above 900 kg (please refer to Figure 13). In fact, the stability values obtained for 100 mm PP modified ones are approximately 45% greater than the reference specimens on an average basis (Keskin, 2011). Moreover, these values show the effect of PPF modified asphalt. Thus, there is no problem for the maximum amount of load the specimen will carry before failure.
c) Between the gyration numbers of 35 and 65, all of the air void values are acceptable from the standpoint of pavement engineering (please refer to Figure 12). Va might lie from 3% to 5% for an acceptable surface course mix (General Directorate of Highways, 2006). The obtained air void values meet the requirements of the current standards well for nearly all of the gyration number levels as can be expected from the fact that PPF modification introduces more Va to the asphalt mixtures.
d) The Vf values should be between 65 and 75% according to the current standards. In Figure 11, for 30 to 52 gyration number, the Vf values fall into the limits of the standard quite perfectly. The above Vf values in Figure 11 can be easily explained by the further amount of compaction energy required to compact the fiber modified specimens.
e) The voids in mineral aggregate (V.M.A.) values are well above 14% for all of the gyration numbers, and thus there is no problem from the current standards point of view (please refer to Figure 10).
f) In order to be able to draw more solid conclusions, due to the nature of gyratory compaction, some more specimens with 62.6 mm specimen height were prepared and tested mechanically. It has to be mentioned that these specimen heights were both logged from the GC software and once more measured with vernier to be 100% sure about the acuity of the readings. When a reader refers to Figure 16, he/she can easily notice that 62.6 mm corresponds to a gyration number of 33, which is designating to the design gyration number from the above discussions. However, in order to study this in a more complete manner, another series of specimens having 62.6 mm specimen height was prepared and mechanically tested to ensure the design gyration number. Therefore, in Table 8, the reader can see the test results of 24 more GC specimens of 100 mm, 12 Marshall specimens’ average test results, and their comparisons in percentage.
Table 8. Average physical and mechanical properties of the M-03 type polypropylene fiber modified specimens prepared with two different compaction techniques (gyratory compactor
specimens were prepared by utilising 62.6 mm as the specimen height)
When Table 8 is analysed, it can be found that 33 gyration number can be accepted with no doubt as the design gyration number for 100 mm PP modified GC specimens for the aggregate sources of specific type and similar bitumen, similar gradation of aggregate, similar proportioning of mix, and similar conditions of laboratory and technique of modification. The noticeable difference in the flow and, therefore, the MQ values is self-explanatory as gyratory compaction is a completely different and much better way of simulating the actual compaction processes on site. Hence, it can be concluded that the flow values, by their selves, do not give an actual and 100% correct determination of the deformation amount of the asphalt specimen before failure occurs. The rest of the specimen properties have fairly acceptable differences from the standpoint of pavement engineering.
CONCLUSIONS AND FURTHER RECOMMENDATIONS
A new standard for a design gyration number of 33 for 100 mm M-03 type PPF specimens has been herein proposed for the first time for the aggregate sources of specific type and similar bitumen, similar gradation of aggregate, similar proportioning of mix, and similar conditions of laboratory and technique of modification. The testing parameters for this design gyration number are 600 kPa ram pressure, 1.25° gyration angle, gyration speed of 30 rpm, and at least 185°C of compaction temperature, which is showing the expectable increase for the polymer modified bitumen asphalt samples. In order to show this high temperature effect, various rotational viscometer tests were carried out at temperatures 135°C, 165°C, and 185°C. From all of these experiments, it has been clearly concluded that it was possible to prepare 100 mm PPF modified GC specimens in the laboratory environment, which meets the requirements by the current standards and tackles the problem a further step, showing superior mechanical properties to the Marshall specimens. These GC specimens can be modified with various other polymer modifiers or various other gradation and asphalt types in order to visualise the effect of modification and new designed gyration numbers can be obtained. Moreover, the rutting susceptibility of these mixtures can be studied with universal testing systems for both reference and polymer modified 100 mm GC specimens. Furthermore, all of these vast amounts of data can be handled with various soft computing techniques in order to offer closed form solutions for the usage of other study groups to validate their findings without performing extra laboratory testing. By this manner, other research groups can easily change the
polypropylene content, bitumen content, or other testing parameters and can readily obtain very good estimates of design gyration number by utilising soft computing techniques for any mix.
ACKNOWLEDGMENTS
This study was supported by Anadolu University Research Fund with Grant no: 08.02.38. The authors would also like to thank Prof. Dr. Ayşen Dener Akkaya for her help in the statistical analysis part of the study.
REFERENCES
Abtahi, S.M., Sheikhzadeh, M. & Hejazi, S.M. 2010. Fiber-reinforced asphalt-concrete - A review.
Construction and Building Materials. 24(6): 871- 877.
ACI Committee 116. Cement and Concrete Terminology (ACI 116 R-00).2010. American Concrete Institute, Farmington Hills, Michigan.
Al-Hadidy, A.I. & Tan Y. 2009. Mechanistic approach for polypropylene-modified flexible pavements.
Materials and Design. 30(4): 1133–1140.
Asi, I.M. 2007. Performance evaluation of SUPERPAVE and Marshall asphalt mix designs to suite Jordan
climatic and traffic conditions. Construction and Building Materials. 21(8): 1732 -1740.
ASTM D4402- 06. 2006. Standard Test Method for Viscosity Determination of Asphalt at Elevated Temperatures
Using a Rotational Viscometer. American Society for Testing and Materials, West Conshohocken, Pa.
Buchanan, M.S. & Brown, E.R. 2001. Effect of superpave gyratory compactor type on compacted hot-mix
asphalt density. Transportation Research Record. 1761: 50- 60.
Chen, J. & Lin, K. 2005. Mechanism and behavior of bitumen strength reinforcement using fibers. Journal
of Materials Science. 40(1): 87 -95.
General Directorate of Highways. 2006. Highway technical specifications. Item No. 1702/. Ankara, Turkey. Ghaly, N.F. 2008. Combined Effect of Polypropylene And Styrene-butadiene Styrene on Asphalt, and Asphalt
Mixture Performance. Journal of Applied Sciences Research, 4(11): 1297- 1304.
IPC. 2009. IPC Servopac Gyratory Compactor. IPC Global. Boronia, Australia.
Jackson, N.M., & Czor, L.J. 2003. 100-mm-diameter mold used with superpave gyratory compactor. Journal
of Materials in Civil Engineering. 15(1): 60 -66.
Keskin, M. 2011. Determining physical and mechanical differences of asphalt specimens using Superpave
and Marshall design methods. MS thesis. Anadolu University, Eskişehir, Turkey (in Turkish).
Khan, Z.A., Wahab, H.I.A., Asi, I. & Ramadhan, R. 1998. Comparative study of asphalt concrete laboratory
compaction methods to simulate field compaction. Construction and Building Materials. 12 (6 -7): 373 -384.
Lee, S.J., Rust, J.P., Hamouda, H., Kim,Y.R. & Borden, R.H. 2005. Fatigue Cracking Resistance of
Fiber-Reinforced Asphalt Concrete. Textile Research Journal, 75(2): 123- 128.
Othman, A.M. 2010. Impact of Polypropylene Application Method on Long Term Ageing of Polypropylene
Modified HMA. Journal of Materials in Civil Engineering, ASCE. 22(10): 1012 -1018.
Özcan, Ş. 2008. The Investigation of the Effect of Polypropylene Fiber Addition to the Static Creep Behavior
of Bituminous Mixtures, MS. Thesis. Anadolu University. Civil Engineering Department, Eskişehir, Turkey (in Turkish).
Parker, F., Hossain, M.S. & Song, J.S. 2000. Analysis of quality control and quality assurance data for
Superpave mixes. Transportation Research Record. 1712: 25 -34.
Roberts, F.L., Mohammad, L.N. & Wang, L.B. 2002. History of hot mix asphalt mixture design in the
United States. Journal of Materials in Civil Engineering, 14(4): 279- 293.
Tapkın, S. & Özcan, Ş. 2012. Determination of the Optimal Polypropylene Fiber Addition to the Dense
Bituminous Mixtures by the Aid of Mechanical and Optical Means. The Baltic Journal of Road and Bridge Engineering, 7(1): 22- 29.
Tapkın, S. 2008. The effect of polypropylene fibers on asphalt performance. Building and Environment, 43
(6): 1065- 71.
Tapkın, S., Çevik, A. & Uşar, Ü. 2009b. Accumulated Strain Prediction of Polypropylene Modified Marshall
Specimens in Repeated Creep Test Using Artificial Neural Networks. Expert Systems with Applications.
36(8): 11186–11197.
Tapkın, S., Çevik, A. & Uşar, Ü. 2010. Prediction of Marshall test results for polypropylene modified dense
bituminous mixtures using neural networks. Expert Systems with Applications. 37(6): 4660 -4670.
Tapkın, S., Uşar, Ü., Özcan, Ş. & Çevik, A. 2011. Polypropylene fiber-reinforced bitumen, Book chapter in
Polymer modified bitumen: Properties and characterisation. Editor Tony McNally. (ISBN: 0857090488). Pp. 136- 194. Woodhead Publishing.
Tapkın, S., Uşar, Ü., Tuncan, A. & Tuncan, M. 2009a. Repeated Creep Behavior of Polypropylene
Fiber-Reinforced Bituminous Mixtures. Journal of Transportation Engineering, ASCE. 135(4): 240 -249.
Tapkın, S. & Keskin M. 2013. Rutting Analysis of 100 mm Diameter Polypropylene Modified Asphalt
Specimens Using Gyratory and Marshall Compactors. Materials Research, 16(2): 546 -564
Wang, J.N., Kennedy, T.W. & McGennis, R.B. 2000. Volumetric and mechanical performance properties of
superpave mixtures. Journal of Materials in Civil Engineering. 12(3): 238 -244.
Watson, D.E., Moore, J., Heartsill, J., Jared, D. & Wu, P. 2008. Verification of Superpave Number of
Design Gyration Compaction Levels for Georgia. Transportation Research Record. 2057: 75- 82.
Zhang, S.L., Zhang, Z.X., Pal, K., Xin, Z.X., Suh, J. & Kim, J.K. 2010b. Prediction of mechanical
properties of waste polypropylene/waste ground rubber tire powder blends using artificial neural networks. Materials and Design, 31(8): 3624- 3629.
Zhang, S.L., Zhang, Z.X., Xin, Z.X., Pal, K. & Kim, J.K. 2010a. Prediction of mechanical properties of
polypropylene/waste ground rubber tire powder treated by bitumen composites via uniform design and artificial neural networks. Materials and Design. 31(4): 1900–1905.
Zhou, L., Li, P. & Zhang, Z. 2009. Investigation of High Temperature Properties of Asphalt Mixture
Containing Fibers. Material Design, Construction, Maintenance, and Testing of Pavements: Selected Papers From the 2009 GeoHunan International Conference (Geotechnical Special Publication 193), ASCE: 139 -144
Zhou, L., Li, P., Zhang, Z. & Chen, H. 2008. Analysis of Effect of Fiber on High Temperature Performance
of Asphalt Mixture. Journal of Wuhan University of Technology, 30(11): 58–61. Submitted: 13/09/2017
Revised : 01/11/2017 Accepted : 14/11/2017
تلفس�ألاا طيللخ يميمس�تلا تارودلا ددع
ينلبورب ليوبلاب لدعم مم
100
س�اقم طوغس�لما
**
ينكس�يك ىفطس�م و
*
ينكبات ناكيرس�
ايكرت ،ايلاطنأا ،ةيندلما ةس�دنهلا مس�ق ،ميلب ايلاطنأا ةعماج ،ذاتس�أا *
ايكرت ،يرهس� يكس�إا ،ةيندلما ةس�دنهلا مس�ق ،ولودانأا ةعماج ،ايلع تاس�ارد ةبلاط **
ةـص�لاـلخا
.مم
100
رطقب راودلا كدلا زاهج مادختس�اب كمدلا تايلمع في ةعيشر�لا قرطلا تاطلس� لبق نم لوبقم رايعم دجوي ل
لاس�رام تانيع نم لوطأا تانيع دادعإا وأا ملم
150
رطقب تانيع رفح امإا لوانت تم ،يرئادلا كمدلا نع ةقباس�لا تاس�اردلا يفف
للاخ يكيناكيلما بارطس�لا نم يرطخ رادقم ببس�ي مم
150
تاس�اقبم بلاوقلا مادختس�اف .ملم
63.5
لوط تاذ ةداتعلما
دادعإل ديدج رايعم يمدقت ةرم لوأل تم هنأا وه ةيلالحا ةس�اردلا في ديدلجاو .اهنم اهجارختس�او مم
100
اهرطق تانيع رفح ةيلمع
تايرعس�ب ينلبورب ليوبلا فايلأا مادختس�اب ملم
63.5
لياوح لوطبو مم
100
رطقب راودلا كمدلا زاهج مادختس�اب تانيع
تانيعل ةيئايزيفلا س�ئاس�لخا ةس�ارد ليس�فتلاب تم ،يرئادلا كمدلا لىإا ةفاس�إلابو ،ىلثلما فورظلا قيقحتلو .ملم
3
ةددعتم
قيرط نع ةدعُلما تانيعلا مادختس�اب ةيكيناكيلماو ةيئايزيفلا تارابتخلا تيرجأا دقو .ةينارودلا ةجوزللا ةس�اخو ةلدعُم ينموتيب
ةينيموتيبلا تاطلخلل يميمس�تلا تارودلا ددع ديدتح تم دقو .
70
لىإا
30
نم تارودلا ددع رابتخل ةيس�يئرلا تاملعلما يريغت
.ةطس�وتم ةكرح فورظ لظ في
33
اهنأا ىلع ةفاثكلا ةززعم مم
100
ينليبورب ليوبلا فايلأا نم ةعونس�لما
View publication stats View publication stats