DOI: 10.21449/ijate.444073 Published at http://www.ijate.net http://dergipark.gov.tr/ijate Research Article
Modeling Course Achievements of Elementary Education Teacher
Candidates with Artificial Neural Networks
Ergün Akgün 1,*, Metin Demir2
1 The Department of Elementary Education, Usak University, Usak, Turkey
2 The Department of Elementary Education, Dumlupınar University, Kütahya, Turkey
Abstract: In this study, it was aimed to predict elementary education teacher candidates’ achievements in “Science and Technology Education I and II” courses by using artificial neural networks. It was also aimed to show the independent variables importance in the prediction. In the data set used in this study, variables of gender, type of education, field of study in high school and transcript information of 14 courses including end-of-term letter grades were collected. The fact that the artificial neural network performance in this study was R=0.84 for the Science and Technology Education I course, and R=0.84 for the Science and Technology Education II course shows that the network performance overlaps with the findings obtained from the related studies.
ARTICLE HISTORY Received: 16 April 2018 Revised: 20 May 2018 Accepted: 03 July 2018 KEYWORDS Elementary Education, Science and Technology Teaching, Data Mining, Artificial Neural Networks
1. INTRODUCTION
Although the key study on artificial neural networks (ANN) was based on the models of McCulloch and Pitts (1943), which they called “A logical calculus of the ideas” it is possible to say that the use of artificial neural networks constructed by means of computers dates back to the 1950s (Heaton, 2008). Historically, basic network architectures were first announced by Frank Rosenblatt as “The Perceptron.” Then, chronologically, the progress has been as follows (Graupe, 2007):
“The Artron” by R. Lee in 1950,
“The Adaline” by B. Widrow in 1960, and “The Madaline” by, again, B. Widrow in 1988.
The ANN models developed in the subsequent years are based on the working principles of these four models in general. The use of this method of analysis that can be regarded as new is rapidly increasing with many artificial neural network architectures being developed. Today, it is possible to find use of artificial neural networks in many different fields including brain and cognition (Gupta, Molfese, & Tammana, 1995), scientific and technical information (Polanco, Francois, & Keim, 1998), environmental planning, design and architecture (Raju,
CONTACT: Ergün Akgün [email protected] Usak University Education Faculty 1 Eylul Campus 64100 Usak, Turkey
Sikdar, & Dhingra, 1996; Wyatt, 1996), geographic information systems (Foody, 1995), grammer (Vokey & Higham, 2004), business and economics (Selim, 2009; Suzuki, 2001; Tang, 2009), industrial engineering (Azadeh, Saberi, & Anvari, 2011), energy (Geem, 2010), ergonomics (Nussbaum & Chaffin, 1996), ethology (Snyder, 1998), weather forecast (Ghiassi, Saidane, & Zimbra, 2005), air pollution (Cai, Yin, & Xie, 2009), human behavior and computer (Stevens, Ikeda, Casillas, Palacio-Cayetano, & Clyman, 1999), job security (de Haen, 2009), paleontology (Anemone, Emerson, & Conroy, 2011), psychiatry (Cohen, 1994), psychology (Verhagen & Scott, 2004), psycho-sociological (Dowman & Ben-Avraham, 2008), health (Alam & Briggs, 2011), telematics and informatics (Sim, Tan, Wong, Ooi, & Hew, 2014), prevent and analyze traffic accidents (Wei & Lee, 2007), tourism management (Palmer, Montano, & Sese, 2006), expert systems (Ahn, Cho, & Kim, 2000) and education and training (Demir, 2015).
When the successful applications in these fields are examined, it can be said that artificial neural networks are used especially when there are non-linear, multidimensional, incomplete, imperfect and error-prone data, and where there is no mathematical model for solving a problem (Çırak & Çokluk, 2013). In order to better understand this method, which is trying to imitate the functioning of the human brain, its structure and its basic components need to be examined.
The structure of this method is based on the functions of the human brain. The cells in the brain provide humans with the ability to use and practice their thinking, reasoning, and experience (González & DesJardins, 2002). Artificial neural networks aim to make use of these abilities of the human brain to automatically generate new information through the features of learning, discovery and construction without any help (Çırak, 2012; Yavuz & Deveci, 2012). It is important to know how a neural network works biologically to be able to better understand the working principle of artificial neural networks and the elements of a network.
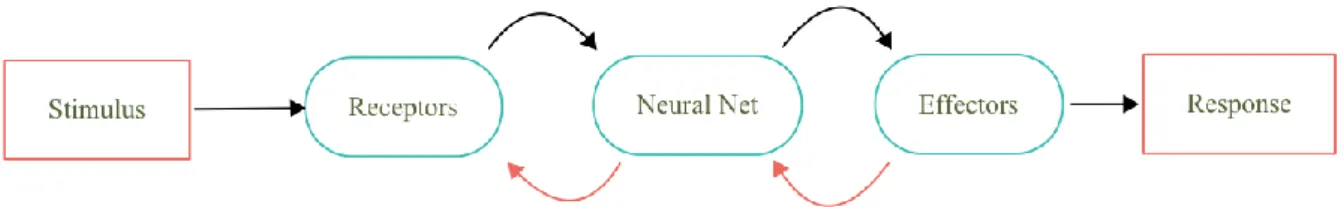
The biological nervous system in the human body consists of a three-layered structure that includes receiving data, interpreting them, and making decisions (Kuyucu, 2012). The brain is in the center of this system shown as the “Nervous System Block Diagram” in Figure 1. The brain receives information, makes sense of it and makes a proper decision. Arrows from left to right convey the information-bearing signals into the system through feedforward, and the arrows from right to left through feedback (Haykin, 2009). Receptors transmit stimuli from the human body and environment to the neural network by turning them into electrical impulses; the effectors turn these impulses into understandable reactions as an output of the system (Haykin, 2009).
Figure 1. Nervous system block diagram (Haykin, 2009).
The basis of the biological neural networks is the nerve cells. The number of nerve cells in the cortex of the human brain is estimated to be about 10 billion (Cuhadar, 2006). A nerve cell is composed of a cell body, a dendrite and an axon. At the macro level, in nerve cells, which work in a way similar to the working principle of the nervous system, incoming stimuli are transmitted to the cell body via dendrites. Outputs generated after operations in the cell body are transmitted to other nerve cells via axons.
The similarity of the working principle of the artificial neural networks and the elements of the network with the biological neural cells is shown in Figure 2. The connections between the cells correspond to axons and dendrites. The weight factors (Wk) correspond to synapses. In an artificial nerve cell, stimuli coming to the cell (X1, X2, ... Xm) based on the effect of the weight factor (Wk1, Wk2, ... Wkm) are converted into stimuli as outputs in response to a nonlinear activation function by taking into account the state or grade of intracellular synaptic weights (Koç, Balas, & Arslan, 2004).
Figure 2. Similarity between biological and artificial neural networks (Arbib, 2003a; Haykin, 2009b).
The basic components of an artificial neural network consist of six different components: input layer, weights, hidden layer, summing function, activation function and output layer. Biologically, a neuron corresponds to a processor element in artificial neural networks. Dendrites are used as inputs, and the cell body is used as a substitute for transfer functions used in the network architecture. Weights used in artificial neural networks fulfill the function of synapses, while the axons represent the neuronal output of the artificial neural network. The basic components of the artificial neural network can be explained as follows.
Input Layer: Input signals (X1, X2, ... Xm) sent to the input layer are transmitted to the next
layer without any statistical processing. The only function of this layer is to transmit the data to the next layer (Yurdakul, 2014). In addition, the input signals on this layer can be more than one. The input signal sent to the input layer may be any of the texture, mathematical value, audio signal, or image processing elements according to the type of the network.
Synaptic Weights: Synaptic weights (Wk1, Wk2, ... Wkm) are the statistical coefficients
indicating the importance of the input data to the hidden layer and its effect on the learning of the network. A positive or negative weight is generated for each input signal (Kuyucu, 2012). All links that provide the relationship between input signals and other layers have different weight values. This variant assignment of values ensures that synaptic weights are effective on all processing elements (Yurdakul, 2014). In artificial neural networks, the display of information is provided by these weights. Therefore, synaptic weights are an important variable affecting the design and performance of a network (Emir, 2013). In the determination of this variable, it is assumed that the input signals have some statistical distributions.
Hidden Layer: Intermediate layers providing information exchange between the input and
output layers are called hidden layers (Şengür & Tekin, 2013). More than one hidden layer can be found in an artificial neural network. However, depending on the problem situation, if there are not enough hidden layers, the network fails to learn. If there is more hidden layer than necessary, it will cause the network to memorize the current situation and make the learning situation impossible (Yurdakul, 2014).
Summing Junction: This junction, also called merging, calculates the net input to the cell
(Adıyaman, 2007; Yavuz & Deveci, 2012). It makes this calculation by using the linear combination of the weights of the respective input values for each input value (Emir, 2013). The addition functions can change in different models depending on the structure of the network architecture. In some models, input values are important, while, in some other models, the number of inputs may be an important variable. Taking this difference into account, the most appropriate addition function is determined by trial and error (Çuhadar, 2006; Kuyucu, 2012).
Activation Function: The activation function, also called the transfer function, determines
the output that the cell produces in response to the input by processing the net input obtained from the addition function (Gülçe, 2010; Kayıkçı, 2014). Separate activation functions are applied to all of the nerve cells in the network, and the output value can be calculated by means of the statistical value obtained after the function (Çırak, 2012). As with the addition function, one can benefit from different functions in the use of this function.
Output Layer: In this layer, the information to which an appropriate activation function
is applied is processed to produce the output required for the input data given in the first stage to the network. The output layer consists of a single layer, where the generated data are transmitted to the outside world.
Although the components forming an artificial neural network are mainly composed of these components, artificial neural networks vary in many different classifications according to their intended use. In this study, it was aimed to predict elementary education teacher candidates’ achievements in “Science and Technology Education I and II” courses by using artificial neural networks. It was also aimed to show the importance levels of the independent variables in the prediction. The features and the construction of the network architecture created in this framework are explained in the Method section.
2. METHOD 2.1. Sample
The data in this study were obtained from the transcripts of elementary education teacher candidates graduating from four different state universities and the demographic information without personal information found in student information systems. Graduates who have not graduated withinfour years were not accepted into the sample. Moreover, the data of students who attended and left the current programs with a lateral or vertical transfer via some programs implemented by the Council of Higher Education of Turkey (such as Mevlana or Erasmus Student Mobility) were removed and not included in the study. After these procedures, the data of a total of 865 graduates were analyzed within the scope of the study.
2.2. Data Analysis
The data in this study were obtained from the transcripts of elementary education teacher candidates graduating from four different state universities and the demographic information without personal information found in student information systems.
In the data set used in this study, variables of gender, type of education, field of study in high school and transcript information of 14 courses including end-of-term letter grades were collected and coded as categorical data. In the data analysis stage, these data were converted
into numerical data using the methods described below. Categorical variables such as gender (male, female), type of education (daytime education, evening education) and field of study in high school (Turkish, Mathematics, Science, other) were converted into numerical data with 1-of-N encoding method such as 'male' = [1 0] and 'female' = [0 1]. In addition, the placement score given by the Assessment Selection and Placement Center of Turkey (ASPC), which is another variable, was also included in the data set the same way as it was used by the ASPC during placement.
When the end-of-term letter grades containing the transcript information of the 14 courses that constitute the second part of the data set were examined, it was seen that these letter grades represented numerically different grade ranges among the universities. For this reason, it was found which score ranges the letter grades represented at each university by checking the regulations for education and examinations valid for years in which each sample graduated. Then, each university was separately transformed into the same standards at intervals given in the table of grades of the Higher Education Council, by using the Higher Education Council Grade Transformation Table.
Once the data were converted, the dataset was divided into two parts to construct the network and test the problem situations that constituted the purpose of the study. The main purpose of this separation was to (1) determine the best network performance and then to (2) evaluate the performance of the prediction data that the constructed artificial neural network would generate in the presence of the new data set that it would encounter for the first time. In other words, this separation would allow the comparison of two things: (1) the output data that the artificial neural network would produce when it takes the independent variables as input data, assuming that the artificial neural network has learned the relationship between dependent and independent variables, and (2) the actual data of the dependent variable in the data set of the study.
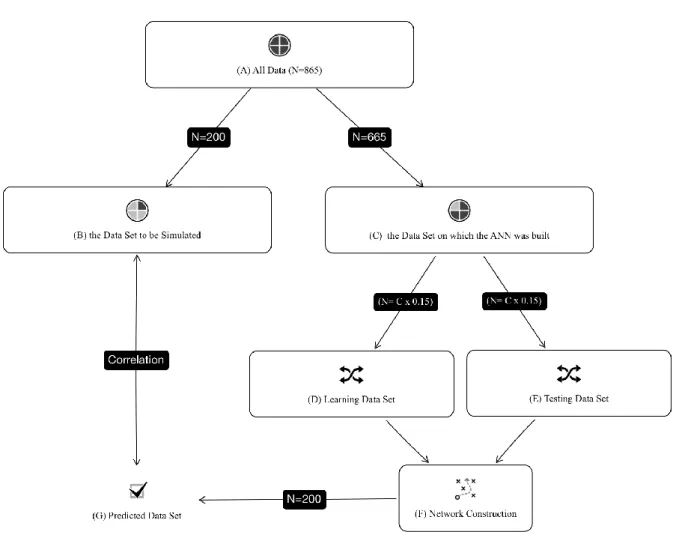
In this context, the graphical representation of all operations on the dataset is presented below and each step is explained in detail (Fig 3).
Figure 3. Data set operations for network construction.
Within the scope of this study, (A) all data of N=865 people who constituted the sample were randomly divided into two parts as (B) “the Data Set to be Predicted” and (C) “the Data Set on which the ANN was built” to construct a network using the Matlab Neural Network Toolbox.
(B) “The Data Set to be Simulated” consisted of 200 individuals randomly selected from the 865 individuals constituting the sample. In general, at least 15% of all datasets are used as simulation data in studies (e.g., Bahadır 2013; Başman 2014; Demir 2015), although there is no method or standard for determining this number in the literature. In the context of this study, 23% (N=200) of the entire data set was reserved for comparing the simulation data with the actual data after constructing network. The data set was not seen by the system during the time the network learned the relation between its dependent and independent variables. In other words, the constructed artificial neural network was formed by the data of the remaining 665 people.
(C) “The Data Set on which the ANN was built” consisted of 665 people, except for the data of 200 people that were excluded to be simulated later on. This data set included the following data, which were thought to be predictive of the achievement in the Science and Technology Education course: 665 participants’ gender, field of study in high school, ASPC placement score, and year of graduation as well as quantified data of the letter grades of General Biology, Introduction to Educational Science, General Chemistry, Educational Psychology, General Physics, Science and Technology Laboratory Applications I, Instructional Principles and Methods, Science and Technology Laboratory Applications II, and Environmental Education courses. When the network learns within this data set, it tries to learn the relationships between dependent and independent variables by using the learning functions
determined by the researcher, by determining random selections from the data in itself. It, then, produces simulation data by testing the performance of the network it has constructed. The learning and testing stages are described in detail below.
(D) In the “Learning Data Set”, the system tests the user-specified learning functions during the network learning by using 15% of the participants with random selections from the data set given to it. This 15% rate can be increased or decreased by the researcher. Within the scope of this study, 15% was used as the default setting for network learning. At this stage, the network tries to discover the dependent and independent variable relations in the dataset with the determined 15% parts to construct the expected output values.
(E) A “Testing Data Set” is constructed to test the relations systematic— established in the network learning stage, which is the preceding stage — in sets of 15% of data. As in the learning data set, the network does this randomly in order to test the performance of the network.
(F) In the “Network Construction” stage, the network — having learned and tested the relationships between dependent and independent variables — predicts the possible outputs of the data to be inputted by the user. Here, the input data of 200 people reserved in the first stage (B) were fed to the network and the outputs were predicted by the network.
(G) A statistically significant difference was sought by comparing the output data generated in the previous stage to the actual data reserved in stage B.
To summarize all these steps, the entire dataset was divided into two parts: the network construction and the comparison of the actual data to the data to be simulated by the constructed network. In this separation process, the data set to be predicted was not included in the network in order to prevent the network from memorizing the outputs. The data set on which the network was constructed was randomly separated by the system to test the network learning and the conditions it has learned, and a network architecture was constructed. It was ensured that the constructed network architecture predicted the outputs by loading only the input data of the dataset reserved in the first stage. Finally, the data that were modeled and predicted by the network were compared with their actual values.
All of these operations in the dataset were done to create the best network architecture. However, the most important thing to know here is that there is more than one network architecture in artificial neural networks. Within the scope of this study, the procedures for creating the best network architecture considering the properties of the problem state and variables is explained in detail in the next section.
2.3. Construction of the Network Architecture
There are hundreds of options for creating network architectures used in modeling and predictioning with artificial neural networks. This feature, which provides the researcher with flexibility in selecting the components to be used in network construction (such as network type, learning algorithm, and transfer function), sometimes causes the researcher to make too many attempts at finding the best combination of components for a proper network selection. In these attempts, the goal is to establish a network structure that learns the desired output values when it encounters a new data set, or in other words, learns relationships between the dependent and independent variables of the research problem in the best way possible. A network architecture that solves the research problem in the best way possible can be described as the architecture that best learns the relationship between existing inputs and outputs. In order to construct the most suitable network architecture, it is necessary — during the selection of components stage — to consider many variables such as the hardware characteristics of the computer in which the network is tried, the type of variables used, and the characteristics of the
desired output data. Given this diversity, many network architectures should be tried to do any modeling, and the architecture that gives the best result should be preferred.
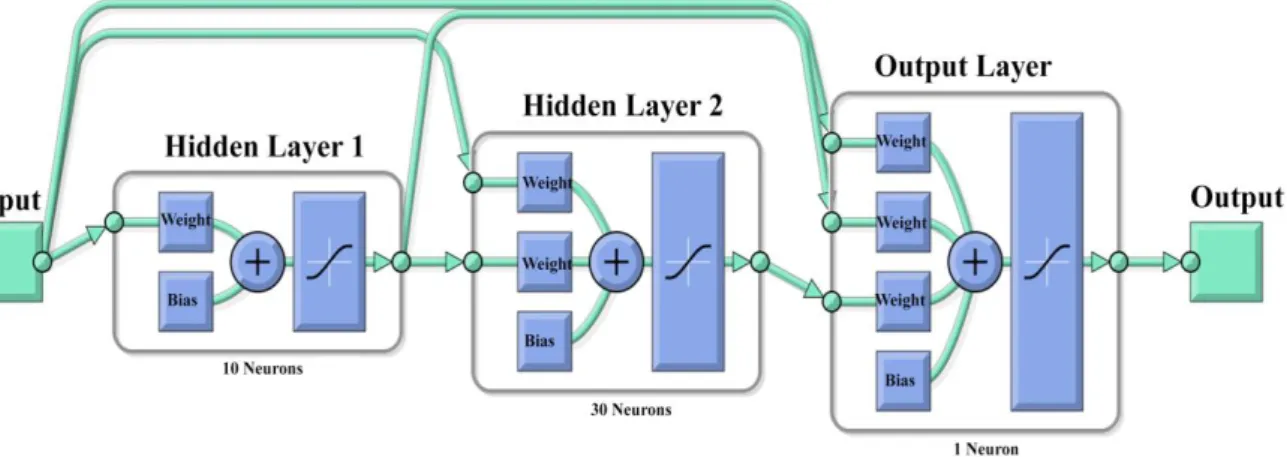
Figure 4. Constructed Network Architecture
Within the scope of this study, 146 different network architectures were constructed to obtain the most suitable network architecture. Each constructed architecture was tested 10 times. Among these 10 trials, the highest performance verification value was recorded together with the R values of the trial, verification and test processes that were created during the network learning stage. Therefore, within the scope of this study, when selecting the most suitable network architecture for the problem situation, 1460 different network architectures were investigated. The network architecture with the lowest Mean-Square Error (MSE) value was taken as the criterion for the most suitable network selection.
The table below shows the characteristics of the network with the best performance value after the trials (Table 1).
Table 1. Characteristics of the Network Architecture (see Fig 4).
Network Type Adaptation Learning Function Performance Function Transfer Function Number of Hidden Layers Learning Function Number of Neurons Hidden Layer 1 Hidden Layer 2 Cascade-forward Backpropagation Momentum Weights Gradient Descent Mean-Square Error Hyperbolic Tangent Sigmoid 2 Levenberg-Marquardt 10 30
After setting the network type, the stage for the determination of the learning function began. At this stage, Levenberg-Marquardt (TRAINLM), the gradient descent (TRAINGD), and the Powell-Beale restart conjugate gradient descent learning algorithm (TRAINCGB), which yield fast results for nonlinear problems, were tested separately in the architectures. 3. FINDINGS
3.1. Modeling and Estimation of Achievement in Science and Technology Education I and II Courses using Artificial Neural Networks
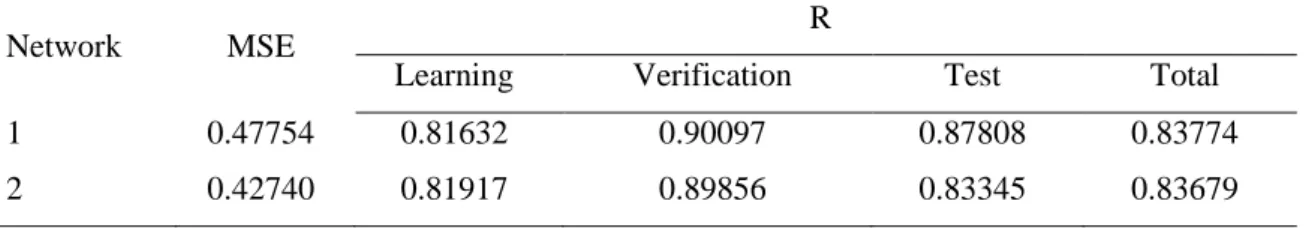
When the network performances of the architectures — prepared to predict achievements in the Science and Technology Education I (Network 1) and II (Network 2) courses and to ensure learning of the network — were examined, it was seen that the
mean-square error values were MSENetwork 1=0.478 and MSENetwork 2=0.427. The table showing the regression coefficients for learning, validation and testing of the artificial neural network is given below (Table 2).
Table 2. Network Performance and Regression Values
Network MSE R
Learning Verification Test Total
1 0.47754 0.81632 0.90097 0.87808 0.83774
2 0.42740 0.81917 0.89856 0.83345 0.83679
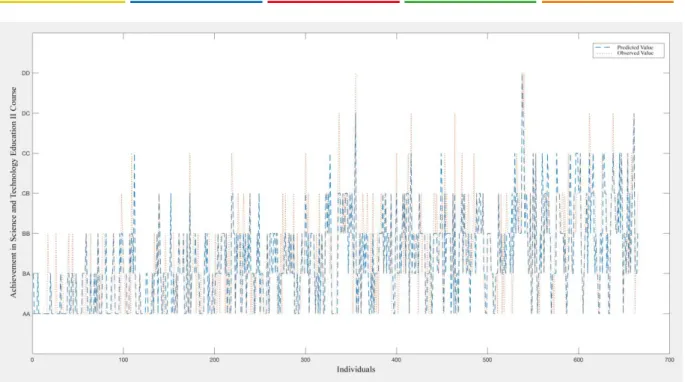
When the above table is examined, it can be seen that the network regression values were R=0.82 for the learning stage, R=0.90 for the verification stage and R=0.88 for the test stage in Network 1; and R=0.82 for the learning stage, R=0.90 for the verification stage and R=0.83 for the test stage in Network 2. The total R value, which is the other regression coefficient given above, was obtained by introducing the input values of 665 people to the network after the network learning stage, estimating the output values and comparing these values with the actual values in a correlation. Therefore, it is seen that there was a statistical correlation between the Science and Technology Education I course grades produced by the network and the actual grades (R=0.84), and between the Science and Technology Education II course grades produced by the network and the actual grades (R=0.84). These values can be interpreted as a high correlation between the data produced by the network and the actual data. Based on this, it can be said that the network accomplished a successful modeling. A graphical comparison of the actual grades of the people with the grades predicted by the network is given below (Fig 5 &
Fig 6).
Observed Value: Blue Dots, Predicted Value: Red Dots.
Observed Value: Red Dots, Predicted Value: Blue Dots.
Figure 6. Science and Technology Education II Course Observed and Predicted Values
After the establishment of the network architecture, the achievement grades in the Science and Technology Education I and II courses were estimated by using the input values of the 200 people, which were reserved at the beginning of the study and were not seen by the network before, as well as the existing network structure and connections. These grades that were predicted were compared with the actual data set, and correlations for Network 1 (r=.68,
p<0.001) and for Network 2 (r=.69, p<0.001) were obtained. As it is known, there is no general
rule about the evaluation of the correlation coefficient, but it is possible to describe the relationship between .68 and 1 as a high or strong relation according to Taylor (1990). This finding is an indication that the constructed artificial neural network learned the achievement grades in the Science and Technology Education I and II courses, which were the output values, using the input values of the people, at a good level.
3.2. Independent Variables Importance Used to Estimate the Achievement in the Science and Technology Education I and II Courses
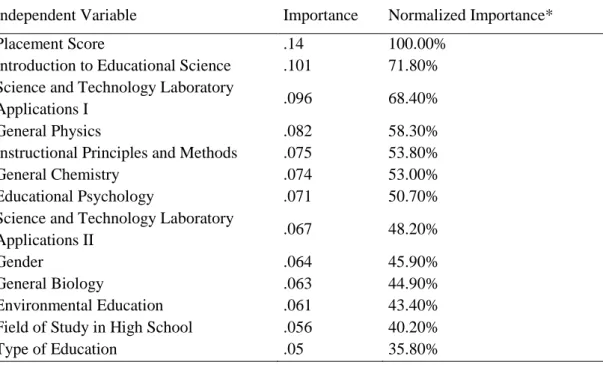
The final finding obtained within the scope of this study was to determine the independent variables importance used to predict the dependent variables. In this context, the independent variables importance for the Science and Technology Education I course are given in Table 3. When Table 3 is examined, it is seen that the placement score (100%) was the most important variable affecting the dependent variable. The variables with a normalized importance level greater than 50% were Introduction to Educational Science (71.80%), Science and Technology Laboratory Applications I (68.40%), General Physics (58.30%), Instructional Principles and Methods (53.80%), General Chemistry (53.00%) and Educational Psychology (50.70%). However, variables with a importance level below 50% were Science and Technology Laboratory Applications II (48.20%), Gender (45.90%), General Biology (44.90%), Environmental Education (43.40%), Field of Study in High School (40.20%) and Type of Education (35.80%). A bar graph showing the normalized independent variables importance are given below.
Table 3. Normalized Independent Variables Importance for Science and Technology Education I Course Independent Variable Importance Normalized Importance*
Placement Score .14 100.00%
Introduction to Educational Science .101 71.80% Science and Technology Laboratory
Applications I .096 68.40%
General Physics .082 58.30%
Instructional Principles and Methods .075 53.80%
General Chemistry .074 53.00%
Educational Psychology .071 50.70%
Science and Technology Laboratory
Applications II .067 48.20%
Gender .064 45.90%
General Biology .063 44.90%
Environmental Education .061 43.40%
Field of Study in High School .056 40.20%
Type of Education .05 35.80%
*Importance values divided by the largest importance values and expressed as percentages.
As can be seen above, 13 variables, which were defined as the independent variables for the Science and Technology Education I course, were ranked in descending order according to their normalized importance levels.
The independent variables importance for the Science and Technology Education II course are given in Table 4.
Table 4. Normalized Independent Variables Importance for Science and Technology Education II
Course
Independent Variable Importance Normalized
Importance*
Placement Score .108 100.00%
Instructional Principles and Methods .1 92.2%
General Biology .071 65.8%
General Physics .071 65.8%
Classroom Management .07 64.2%
Science and Technology Laboratory Applications I .066 61.00%
Introduction to Educational Science .061 56.1%
Measurement and Assessment .056 51.9%
General Chemistry .055 51.00%
Educational Psychology .052 48.2%
Science and Technology Education I .051 47.3%
Instructional Technologies and Material Design .051 47.00% Science and Technology Laboratory Applications II .044 40.2%
Environmental Education .041 37.6%
Type of Education .037 34.5%
Field of Study in High School .035 32.7%
Gender .03 27.6%
*Importance values divided by the largest importance values and expressed as percentages.
When Table 4 is examined, it is seen that the most important variable affecting the Science and Technology Education II course was the Placement Score (100%), which was also
variables with a normalized importance level greater than 50% were the achievement grades of the Instructional Principles and Methods (92.2%), General Biology (65.8%), General Physics (65.8%), Classroom Management (64.2%), Science and Technology Laboratory Applications I (61.00%), Introduction to Educational Science (56.1%), Measurement and Assessment (51.9%) and General Chemistry (51.00%) courses. They were followed by Educational Psychology (48.2%), Science and Technology Education I (47.3%), Instructional Technologies and Material Design (47.00%), Science and Technology Laboratory Applications II (40.2%), Environmental Education (37.6%), Type of Education (34.5%), Field of Study in High School (32.7%) and Gender (27.6%).
4. DISCUSSION AND CONCLUSION
When the literature on the use of artificial neural networks in the field of education and training is examined, it is found that even though there are several studies conducted in the international literature (Ibrahim & Rusli, 2007; Karamouzis & Vrettos, 2008; Oladokun, Adebanjo, & Charles-Owaba, 2008), far less attention has been paid on the prediction and classification of student achievement in Turkey. However, it is possible to come across frequent use of regression analysis types (Açıl, 2010; Bahar, 2011; Baştürk, 2008; Doğan & Şahin, 2009; Kablan, 2010; Kösterelioğlu, Kösterelioğlu, & Kilmen, 2008) in prediction studies related to education and training in our country.
Some of the artificial neural network studies conducted in Turkey have been directed towards the prediction of standard tests such as TEOG (Şen, Uçar, & Delen, 2012), KPSS (Demir, 2015), and PISA (Tepehan, 2011) as well as students’ course scores (Turhan, Kurt, & Engin, 2013) and general academic scores (Şengür, & Tekin, 2013). In general, two types of benchmarking studies on artificial neural networks are widely available on the basis of education and training. The first of these is the type of studies by Ayık, Özdemir and Yavuz (2007), Ibrahim and Rusli (2007), Şengür (2013), Şengür and Tekin (2013), Tosun (2007), and Vandamme, Meskens and Superby (2007), which are based on a comparison of prediction performances of decision trees and artificial neural networks, including classification analyzes from data mining models. The second is the type of studies by Bahadır (2013), Çırak (2012), Guo (2010), Tepehan (2011), and Turhan, Kurt and Engin (2013), which include the comparison of prediction performances of regression models with those of artificial neural networks. Other than these, there are also studies on the prediction and classification of student achievement using artificial neural networks without performance comparisons (Demir, 2015; Karamouzis & Vrettos, 2008; Kardan, Sadeghi, Ghidary and Sani, 2013; Naser, Zaqout, Ghosh, Atallah, & Alajrami, 2015; Oancea, Dragoescu, & Ciucu, 2013; Oladokun, Adebanjo, & Charles-Owaba, 2008).
However, it is seen that research mainly focuses on studies to compare the performances of artificial neural networks, decision trees and regression models. It can be argued that this is due to the fact that researchers have been engaged in such studies mainly to measure and demonstrate the effectiveness of the statistical methodology. In this study, the main purpose was the prediction of Science and Technology Education course achievements of elementary education teacher candidates. As a result of the study, it is seen that the most important variable in the prediction of Science and Technology Education I and II courses was the university placement scores of the candidates. In a study conducted by Sitturug (1997), it is seen that scientific process skills are the most effective variable in predicting the science achievement of teacher candidates. The main reason for the differences in these two studies is due to the difference in the type and number of independent variables employed in the prediction of science achievement. In addition, the fact that the number of people in the sample of Sitturug’s (1997) study was 80 and that the statistical analysis was carried out through regression analysis can be shown as another factor causing this difference between the two studies. Similarly, in a
study conducted by Anıl (2009) in parallel with the main purpose of this current study, the most important variable in predicting students’ science achievement in the PISA test was the father’s educational status. Moreover, Ceylan and Berberoğlu (2007) concluded that the most important variable in explaining the science achievement of the students participating in the TIMSS test was the students’ perceptions of failure. In this study conducted by Ceylan and Berberoğlu (2007), parental education level was not included as an independent variable. In addition, the reasons for the above-mentioned studies to differ from the findings of the current study include the facts that those studies were carried out on students under the age of 15, they employed regression analyses and structural equation modeling, and they were carried out to predict standard test scores such as PISA and TIMSS.
Numerous studies exist in predicting science achievement of teacher candidates as well as students, showing that variables such as attitudes towards science and technology, parental education level, socio-economic level, and scientific process skills are related to science achievement and that they have an important effect in predicting the science achievement of students (Berberoğlu, Çelebi, Özdemir, Uysal, & Yayan, 2003; Fleming & Malone, 1983; Germann, 1994; Schibeci & Riley, 1986)..
Likewise, in studies where artificial neural networks are used to predict academic achievement, variables that are expected to influence the success of the course or general academic achievement have been incorporated into models by researchers as independent variables by creating different network architectures. This also leads to differentiation of research results. The biggest cause of these differences is the fact that different types of input variables are chosen by researchers as mentioned above. In addition, the number of layers, number of neurons and learning function are increased when creating the best model with artificial neural networks. These increase the number of combinations of trials. This excess number of combinations allows researchers to create a large number of network architectures in their studies. This leads to different analyses and different outcomes in similar studies, as it is the case in the prediction of academic achievement. However, it is seen that the lowest classification prediction and the highest network performance vary between 51.88% and 91.77%, respectively, in the findings of studies (such as linear regression, logistic regression and decision tree) on the comparison of the predictions and the statistical methods with respect to artificial neural networks related to education and training (Bahadır, 2013; Çırak, 2012; Gülçin, Çırak, & Çokluk, 2013; Demir, 2015; Guo, 2010; Ibrahim & Rusli, 2007; Karamouzis & Vrettos, 2008; Kardan, Sadeghi, Ghidary, & Sani, 2013; Moridis & Economides, 2009; Naser, Zaqout, Ghosh, Atallah, & Alajrami, 2015; Oancea, Dragoescu, & Ciucu, 2013; Oladokun, Adebanjo, & Charles-Owaba, 2008; Paliwal & Kumar, 2009; Romero, Ventura, & García, 2008; Rusli, Ibrahim, & Janor, 2008; Şen, Uçar, & Delen, 2012; Şengür, 2013; Şengür & Tekin, 2013; Tepehan, 2011; Tosun, 2007; Turhan, Kurt, & Engin, 2013; Vandamme, Meskens, & Superby, 2007).
The fact that the artificial neural network performance in this study was R=0.84 for the Science and Technology Education I course, and R=0.84 for the Science and Technology Education II course shows that the network performance overlaps with the findings obtained from the above studies. In the prediction of academic achievement, both in the context of this study and in the studies mentioned above, the results obtained using artificial neural networks show that the prediction results can be considered quite good specifically for social sciences. Acknowledgements
This research was produced from doctoral thesis titled “Modeling of Science and Technology Teaching Course Achievements of Elementary Teacher Candidates with Artificial Neural Networks” by Ergün Akgün in supervising of Metin Demir.
ORCID
Ergün Akgün https://orcid.org/0000-0002-7271-6900
5. REFERENCES
Açıl, Ü. (2010). Öğretmen adaylarının akademik başarıları ile KPSS puanları arasındaki
ilişkinin çeşitli değişkenler açısından incelenmesi [Examination of the relationship between academic success of teacher candidates and civil servant selection examination (KPSS) scores, in terms of different variables (Master’s Thesis)]. Mustafa Kemal
Üniversitesi Sosyal Bilimler Enstitüsü, Hatay.
Adıyaman, F. (2007). Talep tahmininde yapay sinir ağlarının kullanılması [Sales forecasting
using artifical neural networks (Master’s Thesis)]. İstanbul Teknik Üniversitesi Fen
Bilimleri Enstitüsü, İstanbul.
Ahn, B. S., Cho, S. S., & Kim, C. Y. (2000). The integrated methodology of rough set theory and artificial neural network for business failure prediction. Expert Systems with
Applications, 18(2), 65-74. doi:10.1016/s0957-4174(99)00053-6
Alam, M., & Briggs, A. (2011). Artificial neural network meta-models in cost-effectiveness analysis of intensive blood-glucose control: A case study applied to the UK prospective diabetes study (Ukpds) individual patient outcome simulation model. Value in Health,
14(7), 234-235.
Anemone, R., Emerson, C., & Conroy, G. (2011). Finding fossils in new ways: An artificial neural network approach to predicting the location of productive fossil localities. Evol
Anthropol, 20(5), 169-180. doi:10.1002/evan.20324
Anıl, D. (2009). Uluslararası öğrenci başarılarını değerlendirme programı (PISA)’nda Türkiye’deki öğrencilerin fen bilimleri başarılarını etkileyen faktörler [Factors effecting science achievement of science students in programme for international students’ achievement (PISA) in Turkey]. Eğitim ve Bilim, 34(152), 87-100.
Arbib, M. A. (1987). Brains, machines, and mathematics. New York: Springer-Verlag.
Arbib, M. A. (2003). The handbook of brain theory and neural networks. Cambridge, Massachusetts, London, England: MIT press.
Ayık, Y. Z., Özdemir, A. ve Yavuz, U. (2007). Lise türü ve lise mezuniyet başarısının kazanılan fakülte ile ilişkisinin veri madenciliği tekniği ile analizi [An analysis of the correlation between the type of high school and high school graduation score and university placement examination using data mining technique.]. Atatürk Üniversitesi Sosyal
Bilimler Enstitüsü Dergisi, 10(2), 441-454.
Azadeh, A., Saberi, M., & Anvari, M. (2011). An integrated artificial neural network fuzzy C-means-normalization algorithm for performance assessment of decision-making units: The cases of auto industry and power plant. Computers & Industrial Engineering, 60(2), 328-340. doi:10.1016/j.cie.2010.11.016
Bahadır, E. (2013). Yapay sinir ağları ve lojistik regresyon analizi yaklaşımları ile öğretmen
adaylarının akademik başarılarının tahmini [Prediction of student teachers' academic success with logistic regression analysis and artificial neural networks methods (Doctoral Thesis)]. Marmara Üniversitesi Eğitim Bilimleri Enstitüsü, İstanbul.
Bahar, H. H. (2011). ÖSS puanı ve lisans mezuniyet notunun KPSS 10 puanını yordama gücü [KPSS 10 score prediction power of bachelor graduation mark and OSS Score].
Baştürk, R. (2008). Fen ve teknoloji alanı öğretmen adaylarının kamu personeli seçme sınavı başarılarının yordanması [Predictive validity of the science and technology pre-service teachers’ civil servant selection examination]. İlköğretim Online, 7, 323-332.
Berberoğlu, G., Çelebi, Ö., Özdemir, E., Uysal, E. ve Yayan, B. (2003). Üçüncü uluslararası matematik ve fen çalışmasında Türk öğrencilerinin başarı düzeylerini etkileyen etmenler [Factors effecting achievement level of Turkish students in the third international mathematics and science study (TIMSS)]. Eğitim Bilimleri ve Uygulama, 2(3), 3-14. Cai, M., Yin, Y. F., & Xie, M. (2009). Prediction of hourly air pollutant concentrations near
urban arterials using artificial neural network approach. Transportation Research Part
D-Transport and Environment, 14(1), 32-41.
Ceylan, E. ve Berberoğlu, G. (2007). Öğrencilerin fen başarısını açıklayan etmenler: Bir modelleme çalışması [Factors related with students’ science achievement: A modeling study]. Eğitim ve Bilim, 32(144), 36-48.
Cohen, I. L. (1994). An artificial neural network analogue of learning in autism. Biological
Psychiatry, 36(1), 5-20. doi:10.1016/0006-3223(94)90057-4
Çırak, G. (2012). Yükseköğretimde öğrenci başarılarının sınıflandırılmasında yapay sinir
ağları ve lojistik regresyon yöntemlerinin kullanılması [The usage of artifical neural network and logistic regression methods in the classification of student achievement at higher education (Master’s Thesis)]. Ankara Üniversitesi Eğitim Bilimleri Enstitüsü,
Ankara.
Çırak, G. ve Çokluk, Ö. (2013). Yükseköğretimde öğrenci başarılarının sınıflandırılmasında yapay sinir ağları ve lojistik regresyon yöntemlerinin kullanılması [The usage of artifical neural network and logistic regresssion methods in the classification of student achievement in higher education]. Mediterranean Journal of Humanities, 3(2), 71-79.
doi:10.13114/mjh/201322471
Çuhadar, M. (2006). Turizm sektöründe talep tahmini için yapay sinir ağları kullanımı ve diğer
yöntemlerle karşılaştırmalı analizi (Antalya İli’nin dış turizm talebinde uygulama) [Forecasting tourism demand by artificial neural networks and time series methods (A comparative analysis in inbound tourism demand to Antalya) (Doctoral Thesis)]
Süleymen Demirel Üniversitesi Sosyal Bilimler Enstitüsü, Isparta.
de Haen, C. (2009). Knowledge culture conditioned bounded rationality and human artificial neural network processes (HANNP decision theory): How risks of accidents and environmental impact of a new chemical production process and plant site have entered decisions. Safety Science, 47(6), 843-852.
Demir, M. (2015). Predicting pre-service classroom teachers’ civil servant recruitment examination’s educational sciences test scores using artificial neural networks.
Educational Sciences: Theory & Practice, 5, 1169-1177.
Doğan, N., & Şahin, A. E. (2009). The variables predicting the appointment of candidate teachers to primary schools. Inonu University Journal of the Faculty of Education, 10, 183-199.
Dowman, R., & Ben-Avraham, D. (2008). An artificial neural network model of orienting attention toward threatening somatosensory stimuli. Psychophysiology, 45(2), 229-239.
doi:10.1111/j.1469-8986.2007.00614.x
Emir, Ş. (2013). Yapay sinir ağları ve destek vektör makineleri yöntemlerinin sınıflandırma
performanslarının karşılaştırılması: Borsa endeks yönünün tahmini üzerine bir uygulama [Classification performance comparison of artificial neural networks andsupport vector machines methods: An empirical study on predicting stockmarket index movement
Fleming, M. L., & Malone, M. R. (1983). The relationship of student characteristics and student performance in science as viewed by meta-analysis research. Journal of Research in
Science Teaching, 20, 481-495.
Foody, G. M. (1995). Land cover classification by an artificial neural network with ancillary information. International Journal of Geographical Information Systems, 9(5), 527-542.
doi:10.1080/02693799508902054
Geem, Z. W. (2010). Response to “Comments on ‘Energy demand estimation of South Korea using artificial neural network’ by Zong Woo Geem and William E. Roper” by Serhat Kucukali. Energy Policy, 38(10), 6381-6382. doi:10.1016/j.enpol.2009.08.062
Germann, P. J. (1994). Testing a model of science process skills acquisition: An interaction with parents’ education, preferred language, gender, science attitude, cognitive development, academic ability, and biology knowledge. Journal of Research in Science
Teaching, 31(7), 749-783.
Ghiassi, M., Saidane, H., & Zimbra, D. K. (2005). A dynamic artificial neural network model for forecasting time series events. International Journal of Forecasting, 21(2), 341-362.
doi:10.1016/j.ijforecast.2004.10.008
Gonzalez, J. M. B., & DesJardins, S. L. (2002). Artificial neural networks: A new approach to predicting application behavior. Research in Higher Education, 43(2), 235-258. doi:Doi 10.1023/A:1014423925000
Graupe, D. (2007). Principles of artificial neural networks. Advenced Series on Circuits and
Systems, 6.
Guo, W. W. (2010). Incorporating statistical and neural network approaches for student course satisfaction analysis and prediction. Expert Systems with Applications, 37(4), 3358-3365.
doi:10.1016/j.eswa.2009.10.014
Gupta, L., Molfese, D. L., & Tammana, R. (1995). An artificial neural network approach to ERP classification. Brain Cogn, 27(3), 311-330. doi:10.1006/brcg.1995.1025
Gülçe, G. (2010). Veri ambarı ve veri madenciliği teknikleri kullanılarak öğrenci karar destek
sistemi oluşturma [Developing decision support system for student information system by using data warehouse and data mining technics (Master’s Thesis)]. Pamukkale
Üniversitesi Fen Bilimleri Enstitüsü, Denizli.
Haykin, S. (2009). Neural networks and learning machines. Prentice Hall. New Jersey Heaton, J. (2008). Introduction to neural networks for C #. Heaton Research, Inc.
Ibrahim, Z., & Rusli, D. (2007). Predicting students’ academic performance: comparing
artificial neural network, decision tree and linear regression. Paper presented at the 21st
Annual SAS Malaysia Forum, 5th September.
Kablan, Z. (2010). Akademik mezuniyet ortalama puanı ile KPSS başarı puanı arasındaki ilişki [Relationship between undergraduate grade point average and student performance on civil cervant selection exam (KPSS)]. Uludağ Eğitim Fakültesi Dergisi, 23, 451-470. Karamouzis, S. T., & Vrettos, A. (2008). An artificial neural network for predicting student
graduation outcomes. Paper presented at the Proceedings of the World Congress on
Engineering and Computer Science.
Kardan, A. A., Sadeghi, H., Ghidary, S. S., & Sani, M. R. F. (2013). Prediction of student course selection in online higher education institutes using neural network. Computers &
Education, 65, 1-11. doi:10.1016/j.compedu.2013.01.015
Kayıkçı, Ş. (2014). Web sayfalarının yapay sinir ağları ile sınıflandırılması [Classification of
web pages using neural networks (Doctoral Thesis)]. Marmara Üniversitesi Sosyal
Koç, M. L., Balas, C. E. ve Arslan, A. (2004). Taş dolgu dalgakıranların yapay sinir ağları ile ön tasarımı [Preliminary design of ruble mound breakwaters by using artificial neural networks]. İMO Teknik Dergi, 15(4), 3351-3375.
Kösterelioğlu, İ., Kösterelioğlu, M. ve Kilmen, S. (2008). Kamu personeli seçme sınavı (KPSS) puanları ile lisans diploma notu arasındaki ilişkilerin çeşitli değişkenlere göre incelenmesi [A study of the relationship between the civil servant selection examination and undergraduate cumulative general point averages according to a number of variables].
Abant İzzet Baysal Üniversitesi Eğitim Fakültesi Dergisi, 8, 151-160.
Kuyucu, Y. E. (2012). Lojistik regresyon analizi (LRA), yapay sinir ağları (YSA) ve
sınıflandırma ve regresyon ağaçları (C&RT) yöntemlerinin karşılaştırılması ve tıp alanında bir uygulama [Comparison of logistic regression analysis (LRA), artificial neural networks (ANN) and classfication and regression trees (C&RT) methods and an aplication in medicine (Master’s Thesis)]. Gaziosmanpaşa Üniversitesi Sağlık Bilimleri
Enstitüsü, Tokat.
MATLAB and Neural Network Toolbox Release 2017b, The MathWorks, Inc., Natick, Massachusetts, United States.
McCulloch, W. S., & Pitts, W. (1943). A logical calculus of the ideas immanent in nervous activity. The Bulletin of Mathematical Biophysics, 5(4), 115-133.
Moridis, C. N., & Economides, A. A. (2009). Prediction of student’s mood during an online test using formula-based and neural network-based method. Computers & Education,
53(3), 644-652. doi:10.1016/j.compedu.2009.04.002
Naser, S. A., Zaqout, I., Ghosh, M. A., Atallah, R., & Alajrami, E. (2015). Predicting student performance using artificial neural network: In the faculty of engineering and information technology. International Journal of Hybrid Information Technology, 8(2), 221-228. Nussbaum, M. A., & Chaffin, N. B. (1996). Evaluation of artificial neural network modelling
to predict torso muscle activity. Ergonomics, 39(12), 1430-1444.
doi:10.1080/00140139608964562
Oancea, B., Dragoescu, R., & Ciucu, S. (2013). Predicting students’ results in higher education
using neural networks. Paper presented at the The 6-th Conference Applied Information
and Communication Technology, Faculty of Information Technology, Latvia University of Agriculture, Jelgava, Latvia.
Oladokun, V., Adebanjo, A., & Charles-Owaba, O. (2008). Predicting students’ academic performance using artificial neural network: A case study of an engineering course. The
Pacific Journal of Science and Technology, 9(1), 72-79.
Paliwal, M., & Kumar, U. A. (2009). A study of academic performance of business school graduates using neural network and statistical techniques. Expert Systems with
Applications, 36(4), 7865-7872. doi:10.1016/j.eswa.2008.11.003
Palmer, A., José Montaño, J., & Sesé, A. (2006). Designing an artificial neural network for forecasting tourism time series. Tourism Management, 27(5), 781-790.
doi:10.1016/j.tourman.2005.05.006
Polanco, X., Francois, C., & Keim, J. P. (1998). Artificial neural network technology for the classification and cartography of scientific and technical information. Scientometrics,
41(1-2), 69-82.
Raju, K. A., Sikdar, P. K., & Dhingra, S. L. (1996). Modelling mode choice by means of an artificial neural network. Environment and Planning B-Planning & Design, 23(6), 677-683.
Romero, C., Ventura, S., & García, E. (2008). Data mining in course management systems: Moodle case study and tutorial. Computers & Education, 51(1), 368-384.
doi:10.1016/j.compedu.2007.05.016
Rusli, N. M., Ibrahim, Z., & Janor, R. M. (2008, 26-28 Aug. 2008). Predicting students'
academic achievement: Comparison between logistic regression, artificial neural network, and Neuro-fuzzy. Paper presented at the Information Technology, 2008. ITSim
2008. International Symposium on.
Schibeci, R., & Riley, J. (1986). Influence of students’ background and perceptions on science attitudes and achievement. Journal of Research in Science Teaching, 23, 177-187. Selim, H. (2009). Determinants of house prices in Turkey: Hedonic regression versus artificial
neural network. Expert Systems with Applications, 36(2), 2843-2852.
Sim, J. J., Tan, G. W. H., Wong, J. C. J., Ooi, K. B., & Hew, T. S. (2014). Understanding and predicting the motivators of mobile music acceptance - A multi-stage MRA-artificial neural network approach. Telematics and Informatics, 31(4), 569-584.
Sittirug, H. (1997). The predictive value of science process skills, attitude toward science, and
cognitive development on achievement in a Thai teacher institution. Unpublished PhD
thesis, University of Missouri, Columbia.
Snyder, M. R. (1998). A functionally equivalent artificial neural network model of the prey orientation behavior of waterstriders (Gerridae). Ethology, 104(4), 285-297.
Stevens, R., Ikeda, J., Casillas, A., Palacio-Cayetano, J., & Clyman, S. (1999). Artificial neural network-based performance assessments. Computers in Human Behavior, 15(3-4), 295-313.
Suzuki, Y. (2001). An artificial neural network test for structural change with unspecified parametric form. Japanese Economic Review, 52(3), 339-365.
Şen, B., Uçar, E., & Delen, D. (2012). Predicting and analyzing secondary education placement-test scores: A data mining approach. Expert Systems with Applications, 39(10), 9468-9476. doi:10.1016/j.eswa.2012.02.112
Şengür, D. (2013). Öğrencilerin akademik başarılarının veri madenciliği metotları ile tahmini
[Prediction of student's academic achievements by using the data mining methods (Master’s Thesis)]. Fırat Üniversitesi Eğitim Bilimleri Enstitüsü, Elazığ.
Şengür, D. ve Tekin, A. (2013). Öğrencilerin mezuniyet notlarının veri madenciliği metotları ile tahmini [Prediction of student’s grade point average by using the data mining methods]. Bilişim Teknolojileri Dergisi, 6(3), 7-16.
Tang, Y. C. (2009). An approach to budget allocation for an aerospace company-Fuzzy analytic hierarchy process and artificial neural network. Neurocomputing, 72(16-18), 3477-3489. Taylor, R. (1990). Interpretation of the correlation coefficient: A basic review. Journal of
Diagnostic Medical Sonography, 6(1), 35-39.
Tepehan, T. (2011). Türk öğrencilerinin PISA başarılarının yordanmasında yapay sinir ağı ve
lojistik regresyon modeli performanslarının karşılaştırılması [Performance comparison of artificial neural network and logistic regression model in predicting Turkish students’ PISA success (Doctoral Thesis)]. Hacettepe Üniversitesi Sosyal Bilimler Enstitüsü,
Ankara.
Tosun, S. (2007). Sınıflandırmada yapay sinir ağları ve karar ağaçları karşılaştırması:
Öğrenci başarıları üzerine bir uygulama [Artificial neural networks-decision tree comparison in classification analysis: An application on students’ success (Master’s Thesis)]. İstanbul Teknik Üniversitesi Fen Bilimleri Enstitüsü, İstanbul.
Turhan, K., Kurt, B., & Engin, Y. Z. (2013). Estimation of student success with artificial neural networks. Education and Science, 38(170), 112-120.
Vandamme, J. P., Meskens, N., & Superby, J. F. (2007). Predicting academic performance by data mining methods. Education Economics, 15(4), 405-419.
doi:10.1080/09645290701409939
Verhagen, J. V., & Scott, T. R. (2004). Artificial neural network analysis of gustatory responses in the thalamic taste relay of the rat. Physiology & Behavior, 80(4), 499-513.
Vokey, J. R., & Higham, P. A. (2004). Opposition logic and neural network models in artificial grammar learning. Consciousness and Cognition, 13(3), 565-578.
doi:10.1016/j.concog.2004.05.008
Wei, C. H., & Lee, Y. (2007). Sequential forecast of incident duration using artificial neural network models. Accident Analysis and Prevention, 39(5), 944-954.
Wyatt, R. (1996). Evaluating strategies by means of an artificial neural network. Environment
and Planning B-Planning & Design, 23(6), 685-695.
Yavuz, S., & Deveci, M. (2012). İstatistiksel normalizasyon tekniklerinin yapay sinir ağın performansına etkisi [The effect of statistical normalization techniques on the performance of artificial neural network]. Erciyes Üniversitesi İktisadi ve İdari Bilimler
Fakültesi Dergisi, 40, 167-187.
Yurdakul, E. M. (2014). Türkiye'de ithalatın gelişimi ve ithalatın yapay sinir ağları yöntemi ile
tahmin edilebilirliğine yönelik bir analiz [The evolution of import in Turkey and an analysis abaut predictability of import by artificial neural network method (Doctoral Thesis)]. Adnan Menderes Üniversitesi Sosyal Bilimler Enstitüsü, Aydın.