* Corresponding author. Tel.: +90-222-239-3750 ; Fax: +90-222-229-0535 ; E-mail address: [email protected] (H. S. Şengel) ISSN: 2149-8024 / DOI: https://doi.org/10.20528/cjsmec.2019.02.003
Research Article
Structural analysis of reinforced concrete mansard roof structures
according to different structural plans
H. Selim Şengel
a,*
, İsmail Kanber
b, Serdar Çarbaş
c a Department of Civil Engineering, Eskişehir Osmangazi University, 26480 Eskişehir, Turkeyb Graduate School of Natural and Applied Sciences, Eskişehir Osmangazi University, 26480 Eskişehir, Turkey c Department of Civil Engineering, Karamanoğlu Mehmetbey University, 70100 Karaman, Turkey
ABSTRACT
In this study, analysis and evaluations were carried in order to determine the optimum condi-tions of reinforced concrete mansard roof applicacondi-tions. In total 96 mansard and 24 non mansard structure analysis were performed. The constructed models are symmetrical from all directions and it is modeled under the minimum conditions allowed by the regulation. As the column span, the distance between the columns was determined as 4 meters. The span conditions were de-termined as 3 spans, 4 spans, 5 spans and 6 spans by evaluating the parcel sizes and zoning conditions. Thus, a total of 120 calculation models were created. The base shear force, column moments and the maximum top displacement values were discussed in concordance with these calculations. As a result of the analysis, the graphical values of the mansard buildings were ex-amined along with the non mansard buildings from the 3rd floor to the 8th floor, according to the zoning plan. In this study, graphs of parcels, span values and the number of storeys were drawn by keeping the values constant, and evaluations were made on the same graphs with and non mansard. In addition, by looking at the movements of the graphs obtained from this study on the same series, equations were adapted to the graphs and the series created with these equations were expanded and stochastic parabolic cones were formed at the shear force for 10 storeys, in the column moments. The mean values for the top displacement chart were taken and when the 20-storey displacement value was placed on this curve, it was determined that it appeared at a point very close to the estimating equation curve. Based on the analysis results, it is understood that it is possible to create a set of estimations for different number of storeys and plans. ARTICLE INFO Article history: Received 27 March 2019 Revised 16 May 2019 Accepted 22 May 2019 Keywords: Mansard roof Reinforced concrete Span Estimate Displacement 1. Introduction
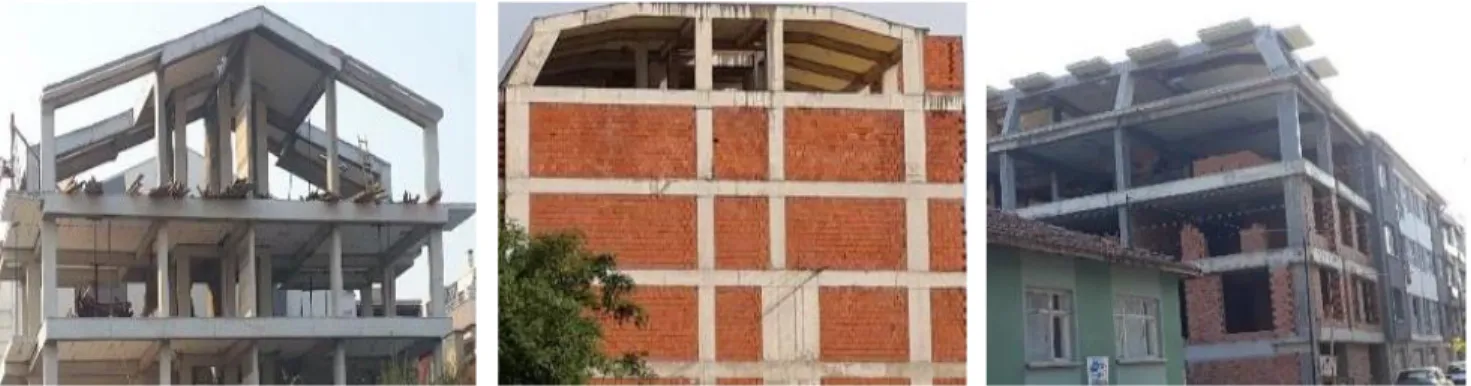
Mansard roof is often applied to facilitate the use of the inter-roof without increasing the number of storeys. Roofs in Turkey generally are discarded, unused spaces. Mansard roof, however, provides an aesthetic form for these idle areas and creates areas of use (Üstün and Kolsal, 2016). Mansard roofs are constructed using wood and steel all around the world, however since 2014, an intensive reinforced concrete mansard roof ap-plication has been carried out in Eskişehir.
In this study, mansard roof reinforced concrete build-ings located inside the provincial border of Eskişehir were examined in accordance with the license information and it was determined that mansards in the region were mostly 3 storeys, 4 storeys, 5 storeys, 6 storeys, 7 storeys,
8 storeys, buildings. When the Urban Development Plan of Eskişehir province was examined, it was determined that there were 3 different parcel types in use. These are adjacent parcels, corner parcels and discrete parcels.
According to the license data in Eskişehir province, 77% of the buildings in 2017 were manufactured as re-inforced concrete. The applications of Mansard roofs in Eskişehir are 95% reinforced concrete and 5% of them are constructed as steel. In this study, the most appropri-ate solutions for mansard roof are investigappropri-ated and the data obtained from mansard roof solution results are aimed to create prediction model graphs. While creating these models, storey change and mold plans were cre-ated. 4 meters between the axes were preferred in order to produce suitable spaces from the specified pattern plans. The pattern plans are composed of 3, 4, 5 and 6
spans, respectively. In this study, the entire mansard roof and structural material were preferred as rein-forced concrete material. The variables determined in the model are the type of parcels, the number of storeys, the number of spans in the mold plan, and in this way, a total of 96 mansard and 24 non mansard model analysis were created.
In this study, the mansard roof application infor-mation in Eskişehir was investigated and the types and models of the structures to be analyzed were deter-mined. Then, for these analysis models, the license de-tails of the existing projects have been taken into consid-eration. While determining the sections and dimensions in the plans, TS-500 (2000), TS-498 (1997) and DBYBHY (2007) controls were made by using IdeCAD (2014), and analyses of the selected sections of mold patterns were made in SAP2000 (2016). From here, the base shear forces, shear values and moment values formed under the mansard layer were obtained. The graphs of these values were drawn and the interpretation of the graphs were used to investigate the behavior of the mansard roof plans at different parcels types, different spans and storey heights, along with appropriate value conditions. These results were evaluated together with the previous analysis results and estimation curves and graphs were created.
These curves and graphs were evaluated together and real solutions and forecasting graphs were overlapped. Thus, light was shed on the future with the prediction values of different storey and span solutions.
2. Materials and Models
According to the information obtained from DBYBHY (2007), Eskişehir province is a province located geo-graphically in the Central Anatolia region and in the Por-suk Basin. Eskişehir due to its location in PorPor-suk basin, generally has a clayey and silty soil. In general, structur-ing is concentrated in areas where Z2 and Z3 ground group are located. Eskişehir is classified as a second-de-gree earthquake region.
Eskişehir's Central Districts are Tepebaşı and Odun-pazarı districts. In line with the information received from the provincial municipalities, the number of sto-reys in the analysis models has been determined as 3, 4,
5, 6, 7 and 8. In addition, analysis models for estimation charts were also drawn for 10 storeys and 20 storeys.
2.1. Schematic representation of Mansard roof structures to be examined in accordance with the parcels in Eskişehir
When the building regulations of the buildings in Eskişehir and the parcels in Eskişehir were examined, it was observed that the parcels of the mansard buildings were mostly disjoint parcels, adjacent parcels and corner parcels (Fig. 1).
2.2. Coding of building models to be analyzed and mold plans
The coding of the structural models for 120 analysis in the study was preferred for the convenience of naming graphics drawings, charts and processes. While coding, each account model was given names and it was aimed to archive the accounts while trying to make it easier to read and record the data (Kanber, 2018).
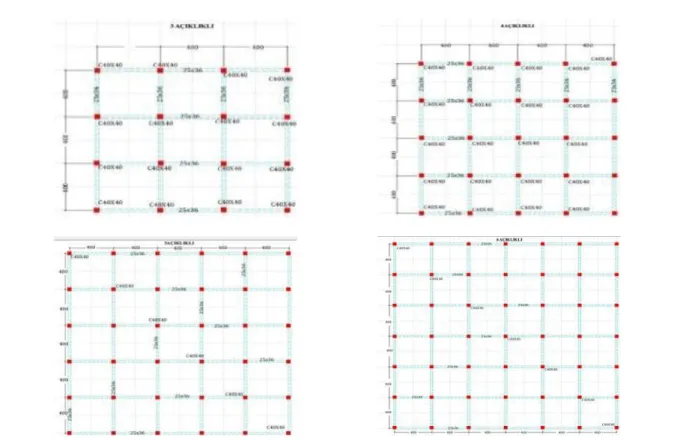
In coding, the first digit is arranged to indicate the number of storeys, the next digit is span, and the last digit is Parcel. 3-span models have 3 X-direction spans and 3 Y-direction spans. The distance between each span is 4 meters. Pattern plans are symmetrical in X and Y terms, thus preventing torsion irregularities. The mini-mum sections were determined using IdeCAD (2014) prior to entering data into SAP2000 software. The col-umns are 40x40 cm, the beams are 25x36 cm and the slabs are 12 cm. In Fig. 2, mold plans are given for 3 spans, 4 spans, 5 spans and 6 spans.
The soil class was determined as Z3 since it is a com-mon ground class in Eskişehir, and it was taken as Ta=0,15 s, Tb=0,6 s. Z3 elastic acceleration spectrum of
the local soil class used in the analysis, special design ac-celeration spectrum according to DBYBHY (2007) was used. Characteristic compressive strength of concrete was assumed as 25MPa, Modulus of elasticity is 30000 MPa. The coefficient of thermal expansion is 0.00001, Poisson's ratio is 0.2. S420 grade reinforcement is se-lected as longitudinal and winding reinforcement. The characteristic strength of the equipment was taken as 420 MPa. Elasticity module has been taken as 200000 MPa and tensile strength as 500 MPa.
Fig. 2. Schematic representation of the pattern plan for 3 spans , 4 spans, 5 spans and 6 spans. 3. Analysis Results
3.1. The results of the analysis obtained when the parcel is constant, the number of storeys and the openings are variable, and it's evaluation
The change between the values was observed by keeping the parcel option fixed. Thus, the effects of the parcel condition on a reinforced concrete structure were investigated. 12 analysis were performed for each 3, 4, 5, 6, 7 and 8-storey models. In this way, model analysis group with mansard accounts to 72 units. As a result of the analysis; 3 span corner parcel moments are more than 66% adjacent and more than disjoint parcels. 4 span corner parcel moments are more than 53% adja-cent and more than disjoint parcels. 5 span corner parcel moments are more than 53% adjacent and more than disjoint parcels. 3 span corner parcel moments are more than 36% adjacent and more than disjoint parcels.
3.1.1. Vertical forces graph created by keeping the parcel option constant
Graphic movements have been examined as the verti-cal force graphs were evaluated and the parcel status re-mained constant. The effect of the openness on the ver-tical force was studied by evaluating the verver-tical forces together with the series.
When the Fig. 3 is examined, the vertical forces of the base shear force the 6 span are increased for the disjoint parcels. The graphics for the mansard and the non struc-ture are provided together.
It was observed that the proportional increases in Fig. 3 were also very close to the adjacent and disjoint parcels.
3.1.2. Base shear force graph created by holding the parcel option fixed
In this section, the base shear forces are graphically drawn and evaluated. When drawing graphs, series were created, these series were created for 3 span, 4 span, 5 span and 6 span.
The change in shear force in Fig. 4 was obtained by fixing the parcel type in the corner parcel. The base shear forces of the corner Parcel are very close to the adjacent and disjoint parcel.
3.1.3. Moment graph created by keeping the parcel option fixed
In this section, parcel option is fixed and series are created, graphics are defined. While creating these se-ries, groups for 3 span, 4 span, 5 span and 6 spans were formed and these groups were discussed in the same graphs.
In Fig. 5, column moments are given together with the change of aperture on the corner parcel. This change in-creases with the increase in openness and the increase in the number of storeys.
Considering the column moment of Mansard and non mansard structures; With a mansard roof struc-ture, the moments of a 3-storey and 3-span structure are close together, with the increase in the number of spans and storey, and the difference between the col-umn moments of Mansard and non mansard structures increases. It is observed that the main factor in this dif-ference is not increase in the storeys but increase in the openness.
Fig. 3. Vertical forces of columns for the corner parcel when the parcel option is fixed.
Fig. 4. Base shear forces of F columns for the corner parcel when the parcel option is fixed.
Fig. 5. Graph of column moments for corner parcel when parcel option is held constant. 3.2. Analysis results and evaluations when the
numbers of storeys, fixed parcels and openness are variable
When the number of parcels and the number of spans (3, 4, 5, 6, 7 and 8 storeys) of the building with mansard roof are variable, the values obtained as the result of the analysis are obtained as base shear forces, column mo-ments and top displacement.
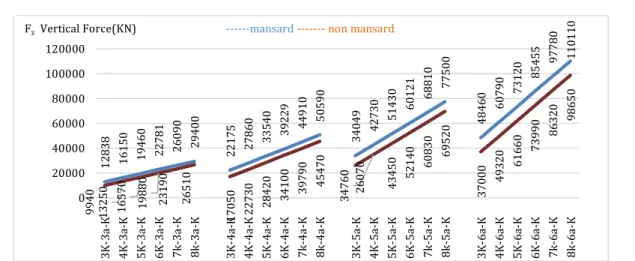
3.2.1. Vertical forces formed by keeping the number of storeys constant
Vertical force graphs are listed below when the storey quantity is kept constant. For the vertical forces, the forces of the mansard and non mansard structures are given together. Force differences between mansard and non mansard structures are increasing with increasing openness. 12838 16150 19460 22781 26090 29400 22175 27860 33540 39229 44910 50590 34049 42730 51430 60121 68810 77500 48460 60790 73120 85455 97780 110110 9940 13250 16570 19880 23190 26510 17050 22730 28420 34100 39790 45470 26070 34760 43450 52140 60830 69520 37000 49320 61660 73990 86320 98650 0 20000 40000 60000 80000 100000 120000 3K -3 a-K 4K -3 a-K 5K -3 a-K 6K -3 a-K 7k -3 a-K 8k -3 a-K 3K -4 a-K 4K -4 a-K 5K -4 a-K 6K -4 a-K 7k -4 a-K 8k -4 a-K 3K -5 a-K 4K -5 a-K 5K -5 a-K 6K -5 a-K 7k -5 a-K 8k -5 a-K 3K -6 a-K 4K -6 a-K 5K -6 a-K 6K -6 a-K 7k -6 a-K 8k -6 a-K
FzVertical Force(KN) ---mansard --- non mansard
194 240 290 345 390 440 333 410 490 589 660 750 508 620 750 898 1010 1140 720 880 1070 1272 1430 1620 150 200 240 290 340 390 250 330 420 500 590 670 370 510 640 760 890 1020 530 720 900 1080 1270 1450 0 200 400 600 800 1000 1200 1400 1600 1800 3K -3 a-K 4K -3 a-K 5K -3 a-K 6K -3 a-K 7k -3 a-K 8k -3 a-K 3K -4 a-K 4K -4 a-K 5K -4 a-K 6K -4 a-K 7k -4 a-K 8k -4 a-K 3K -5 a-K 4K -5 a-K 5K -5 a-K 6K -5 a-K 7k -5 a-K 8k -5 a-K 3K -6 a-K 4K -6 a-K 5K -6 a-K 6K -6 a-K 7k -6 a-K 8k -6 a-K
Base Shear Force F (KN) ---mansard --- non mansard
2589 3490 4210 7950 9273 10601 2723 6020 7250 10672 12453 14231 4320 9230 11110 14363 16756 19150 5663 13140 15800 19348 22572 25796 2140 2860 3580 6570 7664 8761 2250 4910 6140 8820 10292 11761 3570 7500 9380 11870 13848 15827 4680 10650 13320 15990 18655 21319 0 5000 10000 15000 20000 25000 30000 3 K-3 a-K 4 K-3 a-K 5 K-3 a-K 6 K-3 a-K 7 k-3 a-K 8 k-3 a-K 3 K-4 a-K 4 K-4 a-K 5 K-4 a-K 6 K-4 a-K 7 k-4 a-K 8 k-4 a-K 3 K-5 a-K 4 K-5 a-K 5 K-5 a-K 6 K-5 a-K 7 k-5 a-K 8 k-5 a-K 3 K-6 a-K 4 K-6 a-K 5 K-6 a-K 6 K-6 a-K 7 k-6 a-K 8 k-6 a-K
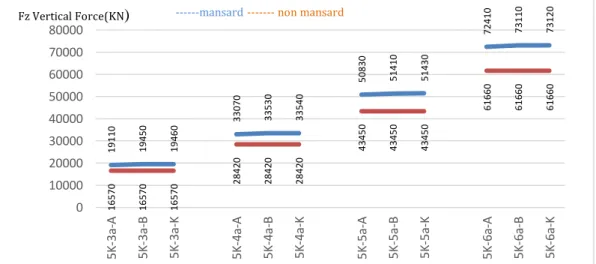
When keeping the storey quantity constant for 5 sto-reys, the graphs were drawn so that the values of the ad-jacent and corner parcel were examined.
As shown in Fig. 6, in a 5-storey structure, the number of storeys and the fixed opening value were determined as variables in the same graph. Looking at these varia-bles, 3 span, 4 span, 5 span and 6 spans appear together.
The proportional increases observed in Fig. 6 were also found for 3 storeys, 4 storeys, 5 storeys, 7 storeys and 8 storeys.
These graphs which are formed by keeping the storey quantity constant shows us that the effect of parcel type change on vertical forces is low. In addition, it is under-stood that the situation does not change with the increase in the number of storeys and although the number of sto-reys changes, this increase is similar to each storey.
3.2.2. Shear force graph created by keeping the number of storeys constant
In Fig. 7, the shear force is not affected by the change in the parcels, although the shear force increases with the increase in the openness.
In Fig. 7, the shear force of mansard and non mansard structures are parallel to the horizontal axis and this shows that the shear force is not affected by the parcel condition. The difference in shear force between mansard
and non mansard buildings is also increasing in case of increase in openness for 6 storeys. The same propor-tional increases were found for 3 storeys, 4 storeys, 6 storeys, 7 storeys and 8 storeys.
3.2.3. Graph of moment forces generated by keeping the number of storeys constant
In this section, the storey number is fixed and the se-ries is formed for 3 span, 4 span, 5 span and 6 spans on the chart. These series are evaluated together. Thus, the effect of the parcel type on the structure is intended for evaluation.
In Fig. 8, the number of storeys for 5 storeys was fixed and the graphics of the structures with and without Man-sard were drawn together. Although the structure with mansard and the structure without Mansard increase in openness, the change of the parcel did not affect the mo-ment values.
When we look at the moment graphs created by keep-ing the storey quantity constant, it is determined that the moment values for the same storey are independent of the parcel condition. When the moment values are eval-uated together for mansard and non mansard structures, the difference in the two structure values is increasing in the column moments formed at the base with the in-crease in the openness in these graphs.
Fig. 6. Vertical force graph created by keeping the storey quantity constant for 5 storeys.
Fig. 7. Base shear force graph created by keeping the storey quantity fixed for 5 storeys. 19110 19450 19460 33070 33530 33540 50830 51410 51430 72410 73110 73120 16570 16570 16570 28420 28420 28420 43450 43450 43450 61660 61660 61660 0 10000 20000 30000 40000 50000 60000 70000 80000 5K -3 a-A 5K -3 a-B 5K -3 a-K 5K -4 a-A 5K -4 a-B 5K -4 a-K 5K -5 a-A 5K -5 a-B 5K -5 a-K 5K -6 a-A 5K -6 a-B 5K -6 a-K
Fz Vertical Force(KN) ---mansard --- non mansard
290 290 290 505 490 490 750 750 750 1070 1070 1070 240 240 240 420 420 420 640 640 640 900 900 900 0 200 400 600 800 1000 1200 5K -3 a-A 5K -3 a-B 5K -3 a-K 5K -4 a-A 5K -4 a-B 5K -4 a-K 5K -5 a-A 5K -5 a-B 5K -5 a-K 5K -6 a-A 5K -6 a-B 5K -6 a-K
Fig. 8. Moment graph created by keeping the storey quantity constant for 5 storeys. 3.3. Analysis results and evaluation when the
openness is constant, the number of storeys and the parcel option is variable
It is aimed to see effect values by keeping openness constant. The parcel option and the number of layers were variable when the spans was kept constant. When the number of spans with mansard roof is fixed, parcel and storey quantity is variable, the values of the base shear forces, column moments and top displacement ob-tained as a result of analysis are examined. Graphs are drawn for base shear force, column moments and top displacement values.
3.3.1. Vertical forces graph when the aperture is held constant
The effect of vertical forces was observed by keeping the aperture constant. The increase in the number of sto-reys increases the vertical forces. The parcel variable does not affect the vertical forces very much when look-ing at the adjacent parcel and the corner parcel from the disjoint parcel.
In Fig. 9, the vertical forces given for 5 openings show a linear increase. The increment slopes of the disjoint parcel, adjacent parcel and corner parcels are the same. The same proportional results were found in 3 spans, 4 spans and 6 spans. When the angle is fixed, it is observed that the motion of the shear force is linear from 3rd to
8th storey. While the shear force increases linearly from 3rd storey to 6th storey, the curvature angle of this linear graph is very little affected by the change in the parcel change.
3.3.2. Graph of shear forces when the span is held constant
Fig. 10 shows a linear increase of the base shear forces given for 5 spans. The increment slopes of the disjoint parcel, adjacent parcel and corner parcels are the same. Mansard and non mansard buildings are provided to-gether. The slope in the shear graph of Mansard and non mansard is the same. The same proportional results were found in 3 spans, 4 spans and 6 spans.
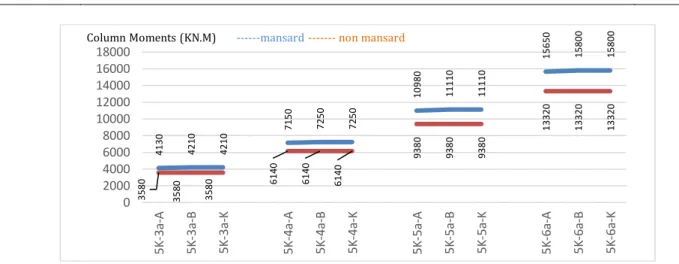
3.3.3. Moment graph when opening is fixed
In Fig. 11, moment values were taken by keeping the openness constant, and it was observed that the parcel variable was not affected when evaluating the 5 open-ness in different parcels. The same proportional results were found for 3 spans, 4 spans and 6 spans.
When the span is held constant moment graph shows increase from the 3rd storey to the 8th storey. When looked at the parcel change, disjoint, adjacent and corner parcels show a very close moment change ratio. The dif-ference between the moment values of mansard and non mansard structures are increasing as we move from 3 spans to 6 spans.
Fig. 9. Vertical force graph created by keeping the openness constant for 5 spans. 4130 4210 4210 7150 7250 7250 10980 11110 11110 15650 15800 15800 3580 3580 3580 6140 6140 6140 9380 9380 9380 13320 13320 13320 0 2000 4000 6000 8000 10000 12000 14000 16000 18000 5K -3 a-A 5K -3 a-B 5K -3 a-K 5K -4 a-A 5K -4 a-B 5K -4 a-K 5K -5 a-A 5K -5 a-B 5K -5 a-K 5K -6 a-A 5K -6 a-B 5K -6 a-K
Column Moments (KN.M) ---mansard --- non mansard
33456 42140 50830 59528 68210 76900 34038 42720 51410 60109 68790 77490 34049 42730 51430 60121 68810 77500 26070 34760 43450 52140 60830 69520 26070 34760 43450 52140 60830 69520 26070 34760 43450 52140 60830 69520 0 10000 20000 30000 40000 50000 60000 70000 80000 90000 3 K-5 a-A 4 K-5 a-A 5K -5 a-A 6 K-5 a-A 7k -5 a-A 8k -5 a-A 3K -5 a-B 4K -5 a-B 5K -5 a-B 6K -5 a-B 7 k-5a -B 8 k-5a -B 3 K-5a -K 4 K-5a -K 5 K-5a -K 6 K-5a -K 7 k-5 a-K 8 k-5 a-K
Fig. 10. The base shear force graph created by keeping the span constant for 5 spans.
Fig. 11. Moment graph generated by keeping the span constant for 5 spans. 3.4. Creating forecasting functions
Based on the results obtained from these analyses, graphs were drawn for each set of results, and most ap-propriate mathematical functions were obtained from these graphs. How close these functions are to reality is also verified by comparing the solutions of intermediate values (such as storey counts. etc.). Thus, a forecast pro-jection of the base cut and moment values has been cre-ated depending on the openings and parcel variables from 3rd storey to 10th storey.
Firstly, the parcel variable is fixed and the graphics are defined. Parabolic graphs are placed on the graphs formed according to these definitions. The reason for the formation of parabolic charts and the formation of graphs is the form of increasing graphics curves.
A new graphic definition has been created by combining the solution series and is tried to understand the relation between this graphic definition and the solution series.
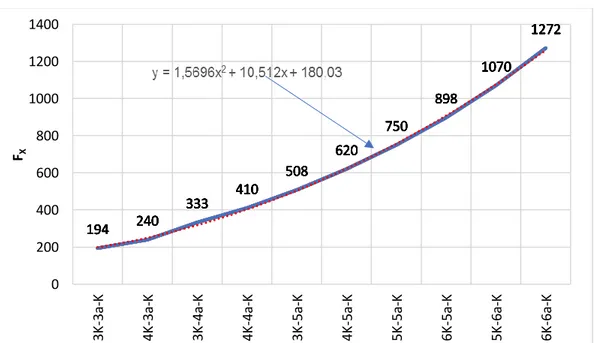
In Fig. 12, a parabolic chart was used for trying to cap-ture the motion of the variables in the following units, and these values were moved on the X axis within them.
These values are shifted in line with the X axis, giving a parabolic graph and shown in Fig. 13. In Fig. 12, parabolic
graph of reinforced concrete mansard roof and non man-sard roof is given, and in Fig. 13, the graph of manman-sard roofed structure group is given. In Fig. 12, parabolic graph inside the F force is examined for the non mansard reinforced concrete structure. Figs. 12 and 13 show a parabolic graph and it is understood that equations can be obtained from these graphs.
As shown in Fig. 14, the given values are defined as parabolic equation by matching with some values in the series. The values in this graph are determined by the ac-tual results obtained from the analysis. Fig. 13 shows us that these graphs can be connected to specific formulas in the series formation. It is understood that new graphs can give prediction values for new series.
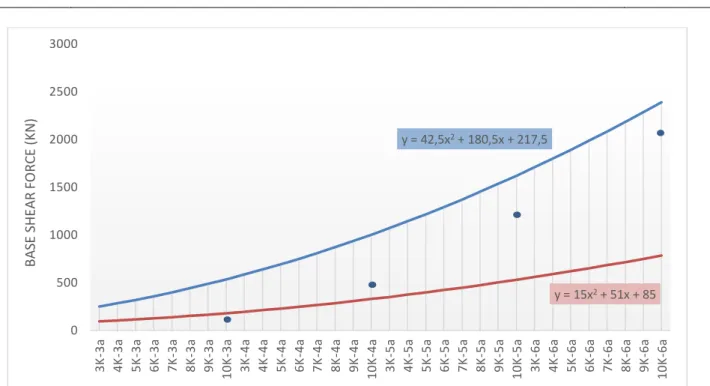
In Fig. 15, the data obtained by using the analysis pro-gram of the 10-storey building was found to be in the mobile wave area.
If this series is expanded and replicated by this qual-ity, it will multiply in the same quality as the parabolic cone. Due to this proliferation, it will be expected that the values in different storey and span structures will re-main between these ranges. When the integral of these functions is taken, value interval estimation can be made within the new series that will be formed.
500 620 750 890 1010 1140 508 620 750 898 1010 1140 508 620 750 898 1010 1140 370 510 640 760 890 1020 370 510 640 760 890 1020 370 510 640 760 890 1020 0 200 400 600 800 1000 1200 3K -5 a-A 4K -5 a-A 5K -5 a-A 6K -5 a-A 7k -5 a-A 8k -5 a-A 3K -5 a-B 4K -5 a-B 5K -5 a-B 6K -5 a-B 7k -5 a-B 8k -5 a-B 3K -5 a-K 4K -5 a-K 5K -5 a-K 6K -5 a-K 7k -5 a-K 8k -5 a-K
Base Shear Force(KN) ---mansard --- non mansard
4320 9110 10980 14363 16756 19150 4320 9230 11110 14363 16756 19150 4320 9230 11110 14363 16756 19150 3570 7500 9380 11870 13848 15827 3570 7500 9380 11870 13848 15827 3570 7500 9380 11870 13848 15827 0 5000 10000 15000 20000 25000 3K -5 a-A 4K -5 a-A 5K -5 a-A 6K -5 a-A 7k -5 a-A 8k -5 a-A 3K -5 a-B 4K -5 a-B 5K -5 a-B 6K -5 a-B 7k -5 a-B 8k -5 a-B 3K -5 a-K 4K -5 a-K 5K -5 a-K 6K -5 a-K 7k -5 a-K 8k -5 a-K Column Moments(KN.M)
Fig. 12. Parabola placement on drawn graphics.
Fig. 13. Analysis of base shear force graph as series.
Fig. 14. Defining a parabolic rectifier for force F.
y = 1,5311x2 + 12,212x + 249,51 MANSARD y = 1,5834x2 + 4,8806x + 220,3 NON MANSARD 0 200 400 600 800 1000 1200 1400 1600 1800 3K -3 a-A 4K -3 a-A 5K -3 a-A 6K -3 a-A 7k -3 a-A 8k -3 a-A 3K -4 a-A 4K -4 a-A 5K -4 a-A 6K -4 a-A 7k -4 a-A 8k -4 a-A 3K -5 a-A 4K -5 a-A 5K -5 a-A 6K -5 a-A 7k -5 a-A 8k -5 a-A 3K -6 a-A 4K -6 a-A 5K -6 a-A 6K -6 a-A 7k -6 a-A 8k -6 a-A B as e Sh ea r Fo rc e (KN ) 190 240 290 341 390 440 194 240 290 345 390 440 194 240 290 345 390 440 150 200 240 290 340 390 150 200 240 290 340 390 150 200 240 290 340 390 0 50 100 150 200 250 300 350 400 450 500 3K -3 a-A 4K -3 a-A 5K -3 a-A 6K -3 a-A 7k -3 a-A 8k -3 a-A 3K -3 a-B 4K -3 a-B 5K -3 a-B 6K -3 a-B 7k -3 a-B 8k -3 a-B 3K -3 a-K 4K -3 a-K 5K -3 a-K 6K -3 a-K 7k -3 a-K 8k -3 a-K
Base Shear Force (KN)
194 240 333 410 508 620 750 898 1070 1272 194 240 333 410 508 620 750 898 1070 1272 194 240 333 410 508 620 750 898 1070 1272 194 240 333 410 508 620 750 898 1070 1272 194 240 333 410 508 620 750 898 1070 1272 194 240 333 410 508 620 750 898 1070 1272 194 240 333 410 508 620 750 898 1070 1272 194 240 333 410 508 620 750 898 1070 1272 0 200 400 600 800 1000 1200 1400 3 K -3 a-K 4 K -3 a-K 3K-4a -K 4 K -4 a-K 3 K -5 a-K 4 K -5 a-K 5 K -5 a-K 6K-5a -K 5 K -6 a-K 6 K -6 a-K FX
Fig. 15. 32 Piece 3rd to 10th storey estimated series graphical drawing.
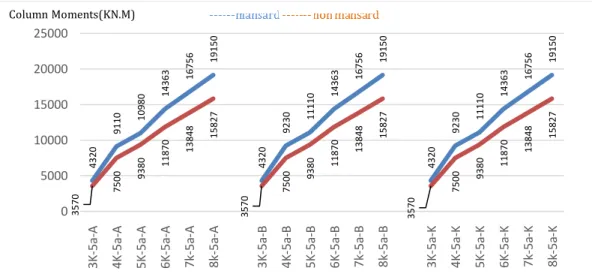
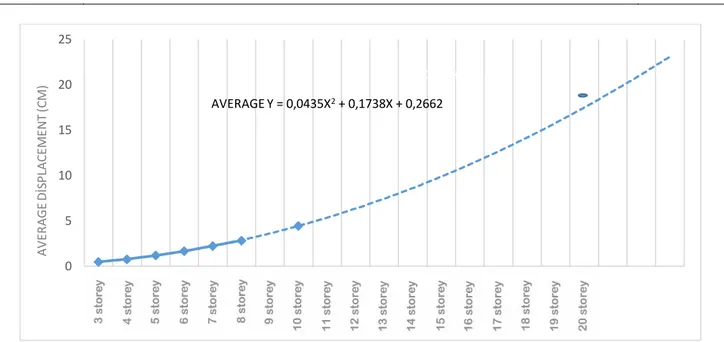
The determination of these prediction functions for the shear force is also done for the moments and the val-ues of the analysis are processed in the series on the chart. The moment values of the 10-storey reinforced concrete structure remain within this graph range as shown in Fig. 16. Therefore, in this series consisting of 3 storeys to 10 storeys, 3 spans to 6 spans and the parcel can be estimated value range depending on the situation. A curve was drawn to the average displacement val-ues and the displacement valval-ues of the 20-storey struc-ture were added on this curve. In this way, it is seen how close the real values of the 20-story structure are to the
prediction curve. The equation graph was drawn in line with the results obtained from the average displacement values and a 20-storey structure of series was added to the sub-axis on this equation. Thus, a prediction curve has been formed for the displacement values of the struc-tures up to 20 storeys. It was observed that this value was very close when structural analysis for 20 storey build-ings was added to the prediction curve. The graphs cre-ated together with the set of values from here shed light on the prediction of new values. Thus, it has been re-vealed that the other displacement values remaining within the range can be estimated using Fig. 17 chart.
Fig. 16. 32 Piece graphical drawing from 3rd storey to 10th storey. y = 42,5x2+ 180,5x + 217,5 y = 15x2+ 51x + 85 0 500 1000 1500 2000 2500 3000 3K -3a 4K -3a 5K -3a 6K -3a 7K -3a 8K -3a 9K -3a 10K -3a 3K -4a 4K -4a 5K -4a 6K -4a 7K -4a 8K -4a 9K -4a 10K -4a 3K -5a 4K -5a 5K -5a 6K -5a 7K -5a 8K -5a 9K -5a 10K -5a 3K -6a 4K -6a 5K -6a 6K -6a 7K -6a 8K -6a 9K -6a 10K -6a B A SE S H EA R F O R C E (K N ) y = 20.944x2+ 213.5x + 8587 y = 6.3194x2+ 5.6833x + 1957.5 0 5000 10000 15000 20000 25000 30000 35000 40000 3K -3a 4K -3a 5K -3a 6K -3a 7K -3a 8K -3a 9K -3a 10K -3a 3K -4a 4K -4a 5K -4a 6K -4a 7K -4a 8K -4a 9K -4a 10K -4a 3K -5a 4K -5a 5K -5a 6K -5a 7K -5a 8K -5a 9K -5a 10K -5a 3K -6a 4K -6a 5K -6a 6K -6a 7K -6a 8K -6a 9K -6a 10K -6a C O LU M N M O M EN TS (K N .M )
Fig. 17. Average displacement graph. 4. Conclusions
In this study, 96 mansard and 24 non mansard model analyzes were performed for the reinforced concrete structure. Values from these structures up to 3 to 8 sto-reys and from 3 openings to 6 openings were defined and analyzed in the light of Eskişehir license information and their results were evaluated. As a result of these eval-uations, the increase in storey and openness increases the increase in parabolic base shear and column moment in-creases on the structure. As a result of the investigations, it was observed that the displacement values were very close to each other when the effects of displacement val-ues on the same storey buildings were examined. This shows that the value of displacement is too small to be taken into account. In this study, it is understood that displacement values are independent of openness.
As a result of the analyses obtained from models with different spans and storeys, base shear force, column moments and top displacement values were evaluated in charts and graphs. It is estimated that the function we obtain depends on the set of values of these series can be obtained by the user, depending on the prediction pro-jection, without making any analyses based on the differ-ent number of layers. Functions have been created and equations have been written in defined series. These functions are created for base shear force, column mo-ments and top displacement values. New series are de-fined and graphs are drawn in accordance with these new series. 10-story and 20-story buildings, 3 spans to 6 spans were analyzed and the new series were added as a point value to the graphs of the defined series. Based on the results of the analysis, it was determined that the function graphs created for estimation remained within the range. The graphics and the functions that will be ob-tained from the range that is defined as series are able to create a prediction interval about the base shear force, colon moments and peak displacement values of the models that will sustain the mentioned series, which have different openness' and storey counts.
Analysis results can be defined by graphs and func-tions with the minimum and maximum values of the base shear forces and moments listed by series. Thus, the es-timation range for different storeys and openings was defined and the estimation projection was determined by the expansion of the series in the solutions of the de-fined equations.
Equations are formed by the results obtained from the average displacement values. Since displacement is not affected by openness, an estimate of the values to be formed on different storeys was carried out with a single prediction equation.
In this study, symmetric models are used, it is recom-mended to analyze non-symmetric systems in future studies and so an approach for all symmetric and non-symmetric systems can be developed. In addition, this study can be done by increasing the number of solutions and analyzes in the set of values and increasing the sen-sitivity for estimation graphs.
REFERENCES
DBYBHY (2007). Regulation on Buildings to be held in Earthquake Ar-eas. General Directorate of Disaster Affairs, Earthquake Research Department, Istanbul, Turkey.
IdeCAD (2014). Concrete Analysis Program. Version ideCAD 7,022, 6500HL-3109 Static.
Kanber İ (2018). Analysis of Reinforced Concrete Mansards Roof Struc-tures Dependent on Different Plan Types. M.Sc. thesis, Eskişehir Os-mangazi University, Eskişehir, Turkey.
SAP2000 (2016). Finite Element Analysis Program. Version SAP2000 v 17.2.0.
TS–498 (1997). Calculation of Loads to be taken for Sizing of Building Elements Values. Turkish Standards Institute, Ankara, Turkey. TS–500 (2000). Design and Construction Rules of Reinforced Concrete
Structures. Turkish Standards Institute, Ankara, Turkey.
Üstün B, Kolsal F (2016). Mansard roof in Eskisehir urban architecture effects. 8. National Roofing & Facade Symposium. Mimar Sinan Fine Arts University, Istanbul, Turkey, 1-7.
y = 0.0435x2+ 0.1738x + 0.2662 0 5 10 15 20 25 3 K A T L I 4 K A T L I 5 K A T L I 6 K A T L I 7 K A T L I 8 K A T L I 9 K A T L I 1 0 K A T L I 1 1 K A T L I 1 2 K A T L I 1 3 K A T L I 1 4 K A T L I 1 5 K A T L I 1 6 K A T L I 1 7 K A T L I 1 8 K A T L I 1 9 K A T L I 2 0 K A T L I AV ER AGE D İS P LAC EM EN T (C M ) AVERAGE Y = 0,0435X2+ 0,1738X + 0,2662