International Journal of
INTELLIGENT SYSTEMS AND APPLICATIONS IN
ENGINEERING
ISSN:2147-67992147-6799 www.ijisae.org Original Research Paper
Wheat Flour Milling Yield Estimation Based on Wheat Kernel Physical
Properties Using Artificial Neural Networks
Kadir Sabanci
1, Nevzat Aydin
2, Abdulvahit Sayaslan
3, Mesut E. Sonmez
4, M. Fatih Aslan
5*, Lutfu Demir
6,
Cemal Sermet
7,
Submitted: 31/12/2019 Accepted: 27/03/2020
Abstract: Wheat is a basic food raw material for the majority of people around the world as wheat-based products provide an important
part of the daily energy intake in many countries. Wheat is generally milled into flour prior to use in the bakery industry. Flour yield is one of the major quality criteria in wheat milling. Flour yield determination requires large amounts of samples, costly machines, grinding applications that require a long working time and a considerable amount of workload. In this study, Artificial Neural Network (ANN) approach has been employed to predict flour milling yield. The ANN was designed in the Matlab using such wheat physical properties as hectoliter weight, thousand-kernel weight, kernel size distribution, and grain hardness. Flour yields and four different kernel physical features (hectoliter weight, thousand-kernel weight, kernel size distribution, and grain hardness) were first collected from 2400 wheat samples through the conventional methods. The ANN was trained using 85% of 2400 yield data and tested with the remaining 15% data. In the training of the ANN, various models have been investigated to find the best ANN structure. Additionally, two datasets with and without grain hardness have been employed to determine the effect of grain hardness on the prediction performance of the ANN model. It was found that grain hardness which reduced the MAE values from 2.3333 to 2.2611 and RMSE values from 3.0775 to 2.9146 gave better result. The results proved that the developed ANN model can be used to estimate flour yield using wheat physical properties.
Keywords: Artificial neural networks, Flour yield, Matlab GUI, Physical properties, Wheat
1. Introduction
Nutritional demands of people have been increasing all around the world. Wheat is a crucial cereal to resolve this requirement as it is an important source of carbohydrates, supplying about 35% of daily energy need of people, especially in the developing countries [1]. Wheat also contains substantial percentage of proteins, certain minerals (Zn, Cu, Fe, Mg, Se, B) and vitamin E. Wheat flour is a raw material for many foods such as breads, pasta, cakes, biscuits etc. Another reason for the preference of wheat is its appropriate price, which is lower than many other such foods as meats and vegetables. Hence, about 45% of the
nutrients are derived from cereals and 40% from wheat-based foods[2]. Wheat ranks in the first place among the cultivated cereals in the world, and its annual consumption has worldwide reached approximately 765 million tons [3].
There are numerous quality criteria for wheat, which are measured by physical, chemical and rheological approaches [3-5]. The physical criteria are mostly based on the morphological properties of wheat kernel. Physical quality features include grain color, thousand-kernel weight, hectoliter weight, grain size distribution and kernel hardness. These physical quality characteristics of wheat provide some information on flour yield, which is a preeminent milling quality criterion. It is generally accepted that genotypes with larger kernels have higher flour yields [6-8]. It is also known that round spherical kernels have higher flour yields than thin and long kernels [9]. Moreover, compared to soft-grain wheat, flour yields of hard-grain wheats are lower [1].
Traditionally, flour yield is calculated based on cleaned and tempered wheat. Determination of flour yield by conventional methods requires laboratory-scale flour mills, which are costly, laborious and thus time consuming. In this study, flour yield of wheat was estimated using Artificial Neural Networks (ANN) in a computerized environment in order to save time and workload. In the biological sciences, ANN technique has become popular because of its predictive accuracy and simplicity [10, 11]. Classification and calibration with ANN have many advantages over the conventional methods so that huge numbers of prediction and classification problems can be solved easily and accurately. ANN approach has been successfully applied in the food industry, such as in cereal grain classification and quality prediction using
_______________________________________________________________________________________________________________________________________________________________________________________________________________________________________________________________________________________________________________________________ 1 Department of Electrical-Electronic Engineering, Karamanoğlu
Mehmetbey University, Karaman – 70100, Turkey ORCID ID : 0000-0003-0238-9606
2 Department of Bioengineering, Karamanoğlu Mehmetbey University,
Karaman – 70100, Turkey ORCID ID : 0000-0003-3251-6880
3 Department of Food Engineering, Karamanoğlu Mehmetbey University,
Karaman – 70100, Turkey ORCID ID : 0000-0001-7161-1552
4 Department of Bioengineering, Karamanoğlu Mehmetbey University,
Karaman – 70100, Turkey ORCID ID : 0000-0002-0966-9216
5 Department of Electrical-Electronic Engineering, Karamanoğlu
Mehmetbey University, Karaman – 70100, Turkey ORCID ID : 0000-0001-7549-0137
6 Maize Research Institute – Sakarya - 54060, Turkey
ORCID ID : 0000-0002-5853-0923
7Black Sea Agricultural Research Institute - Samsun – 55300, Turkey
ORCID ID : 0000-0002-3428-6022
physical or morphological features. In the study of Abdullah and Quteishat [12], classification of three different wheat kernels was carried out using wheat minor-axis length, major-axis length, equivalent diameter, and environment and entropy properties. Through the proposed classification system, wheat seeds were classified with an accuracy of about 95%. In another study [13], Kama, Rosa, and Canadian types of wheat varieties were classified by use of ANN. Area, environment, grain length, asymmetry coefficient, and compactness were used as input features in the study. Based on the regression process of 210 data, 99.99% of the training result and 99.78% of the test result were accurately estimated. There is also a study that wheat yield was estimated through ANN [14]. In that study conducted between 1997 and 2007, such weather conditions as sun, frost, rain, and temperature were the input data, whereas wheat yield was the output data. It was concluded that wheat yield can be estimated with an accuracy of about 98%. Çakır, et al. [15] estimated wheat yield in Şanlıurfa region of Turkey using ANN. For the yield estimation, 15 different parameters were used, such as yearly maximum, average and minimum temperature, total rainfall, growing day degree (GDD and GDD2), temperature difference parameter (TD1 and TD2), and photo thermal unit (PTU). The network was trained through the data obtained from 2011 and 2012 harvest years, then the performance of the network was tested using the data of 2013 harvest year. Performances were observed for different numbers of hidden neuron numbers using single hidden-layer and multi-layer network types. It was determined that RMSE value was 90.6112% for five hidden neurons.
Different from the above-mentioned studies, the purpose of this study was to develop an ANN model to accurately predict flour milling yields of wheats using their physical properties as thousand-kernel weight, hectoliter weight, grain hardness, and size features. The advantages of this study over the conventional method are that does not require cost, time loss and workload. Conventional methods requires laboratory-scale flour mills, which are costly, laborious and thus time consuming [16].
2. Materials and Methods
2.1. Plant material
Five control wheat cultivars (Tosunbey, Tahirova2000, Adana99, Nevzatbey, and Altay2000) and 145 recombinant inbred lines (RILs) were used in the study. The RILs were developed by crossing Tosunbey and Tahirova2000 cultivars, and all wheats were grown in eight different environments to give a grand total of 2400 wheat samples. All wheats were of white kernel color.
2.2. Hectoliter weight
Hectoliter weight is usually expressed as kilograms per hectoliter [17].The hectoliter weights of genotypes were determined using a hectoliter/humidity tester (Dickey-John-GAC Plus) and expressed as kg/hl (AACC Method 55-10).
2.3. Thousand-kernel weight
One hundred seeds per genotype were counted for all genotypes by using an automated seed counter (Chopin – Numigral-l), and their weights were determined via analytical balance (SHIMADZU-AUW220D, Japan). This procedure was done twice for each genotype and recorded as the average of the results. The values were corrected to 14% moisture basis. 10.
2.4. Kernel size distribution
A certain amount (100 g) of wheat was sieved for 1 min on a
shaking-sieve system (Pfeuffer - Sortimat) equipped with 2.8 mm, 2.5 mm and 2.2 mm sieves. Materials collected on each sieve were weighed. The combination of materials on two consecutive sieves (2.8 mm + 2.5 mm and 2.5 mm + 2.2 mm) and subsieve materials (<2.2 mm) were used in the study [18].
2.5. Grain Hardness
Wheat grain hardness was determined through the Stenvert time-to-grind test using a hammer mill fitted with a 2.0 mm sieve (Polymix - PX MFC 90D). For this purpose, 20 g of wheat samples were milled at 2000 rpm to collect 17 mL of product in a standard container. The time (sec) required for this process was taken as the hardness value of the wheat [19, 20].
2.6. Flour Yield
Wheat samples were milled in a standard laboratory mill (Brabender Quadrumat Jr. type, 3 passages with 4 rolls) (AACC Methods 26-50). Prior to milling, wheat samples were tempered at 15% moisture content for 24 hours. The flour yield is expressed as a percentage of the flour obtained from wheat[21]. The yield was corrected to 14% moisture basis.
2.7. Artificial Neural Networks (ANN)
Artificial neural networks are information processing systems that can generalize and solve complex problems by simulating the working structure of the human brain. Artificial neural networks have three layers: the input layer, the hidden layer, and the output layer. The neurons in each layer are connected to each other by synaptic connections. The synaptic connections occur in humans as a result of life and experience [22].
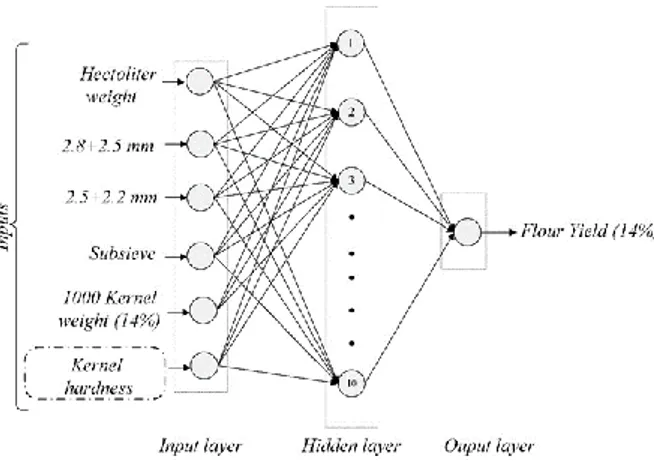
In this study, flour yield was calculated with ANN estimation. Six features were used as input for ANN to train the network. Fig. 1 shows the designed ANN model. During training, weight values are trying to get the best values according to the result value [23]. In this application, the best network architecture was found and the network tested. Then test set with no output results is given to the network and yield estimates are obtained. As a result, conventionally collected and ANN-estimated flour yields of wheat were compared.
Fig. 1. Designed ANN structure
3. Result and Discussion
In this study, flour yield was predicted with ANN. Input and output data of 2400 wheats were first determined by the conventional methods. Then, the artificial neural network was trained with 85% of these data and remaining data was used to test the ANN. Input data were hectoliter weight, percentage of 2.8 mm + 2.5 mm sieve,
percentage of 2.5 mm + 2.2 mm, subsieve of 2.2 mm, thousand-kernel weight and grain hardness. Output data was flour yield. For the first try, the neural network was trained and tested without grain hardness data (NN1). For the second try, kernel hardness data were included in the training of the neural network (NN2). Estimation results of both NN showed that the grain hardness affects flour yield as evidenced by the fact that estimation error values of NN2 were lower than NN1.
The parameters in ANN have a significant effect on the performance of the network accuracy. In this study, the weights of parameters were calculated by trial and error to approach the actual values. Mean absolute error (MAE) and root mean squared error (RMSE) methods were used to determine the performance of parameters. Mathematical expressions of these statistical methods are shown below;
𝑀𝐴𝐸 =1 𝑛∑|𝑌𝑖− 𝑍𝑖| 𝑛 𝑖=1 (1) 𝑅𝑀𝑆𝐸 = √1 𝑛∑(𝑌𝑖− 𝑍𝑖) 2 𝑛 𝑖=1 (2)
There is more than one parameter as number of hidden layer neurons, learning techniques, activation function, learning rate, momentum coefficient, etc., that affects the accuracy of the result in ANN. In this study, the best model was searched by continuously changing the number of hidden layer neurons, activation function and training algorithms to achieve the best performance in the test phase. The number of hidden layer neurons
has been changed step by step from 1 to 20, and various training algorithms (trainbfg, trainlm, traingdx, etc.) have been sequentially tried. The MAE and RMSE values were calculated for each step. Logarithmic sigmoid function (logsig) and tangential hyperbolic
sigmoid function (tansig) were used as the activation function to ensure the best performance. Thus, the best network model was attempted to attain by changing the number of hidden layer neurons, training algorithms and activation functions. The MAE and RMSE values of the test results obtained in response to the change of these parameters are visualized with tables and graphs. An interface was designed by using Matlab GUI to make the work easier for the user who demand the yield of flour without using conventional methods. With the designed interface, the user can create a network model with different combinations by changing the learning method, number of hidden layer neuron and activation functions.
In the study, each network model was reconstructed according to these combinations and the parameter values which giving the best estimate value were recorded. Each model that including error values were recorded to Excel files according to their success in the network. The interface which is shown Fig. 2 was created in the Matlab GUI environment. The output of each network model was compared and analyzed after the outputs were saved in the Excel environment in Fig. 2. The lowest error values by different network architectures are shown in Table 1. These values are ranked according to MAE error values.
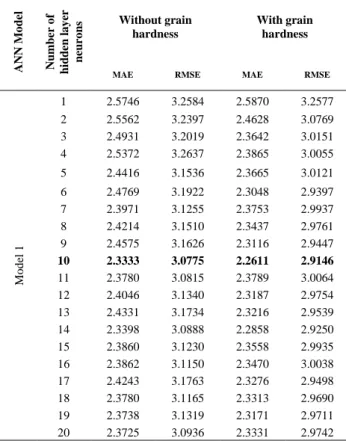
Each row in Table 1 belongs to the line with the lowest error value selected from 20 rows. Because, when the number of hidden layer neurons is increased step by step from 1 to 20, the error values change. This situation is shown in Table 2. Therefore, the lowest faulty network architectures based on the number of hidden layer neurons in each model are added to Table 1. This can be understood from the fact that the number of hidden layer neurons in Table 1 varies irregularly. In Table 2, ‘without grain hardness’
column shows 20 test data results, varying depending on the number of hidden layer neurons, with the ‘Model 1’, which is the most successful network architecture based on hectoliter weight, 2.8 mm + 2.5 mm, 2.5 mm + 2.2 mm, subsieve, thousand kernel
weights. As can be seen from Table 2, the lowest error values were obtained when the number of hidden layer neurons was 10.
Table 1. The best output values for each network model
ANN Model Learning Method Hidden Layer Activation Function Number of hidden layer neurons MAE RMSE
Model 1 trainscg logsig 10 2.3333 3.0775 Model 2 traincgb logsig 17 2.3426 3.0721 Model 3 trainbr logsig 13 2.3493 3.1024 Model 4 traincgp logsig 13 2.3519 3.0735 Model 5 trainscg tansig 17 2.3562 3.0500 Model 6 trainbr tansig 20 2.3620 3.1139 Model 7 traincgf logsig 19 2.3636 3.0693 Model 8 traincgf tansig 18 2.3641 3.1052 Model 9 trainbfg tansig 15 2.3644 3.0791 Model 10 trainbfg logsig 17 2.3920 3.1149 Model 11 traincgp tansig 19 2.3997 3.1211 Model 12 traincgb tansig 16 2.4081 3.1527 Model 13 trainlm logsig 17 2.4119 3.1079 Model 14 trainrp logsig 16 2.4286 3.1377 Model 15 trainlm tansig 14 2.4371 3.1526 Model 16 trainrp tansig 11 2.4675 3.1879 Model 17 traingdx logsig 17 2.4690 3.1761 Model 18 traingdx tansig 16 2.4695 3.1674 Model 19 traingda logsig 20 2.5443 3.2401 Model 20 traingd tansig 15 2.5584 3.2402 Model 21 traingda tansig 15 2.5781 3.2702 Model 22 traingd logsig 17 2.5886 3.2661 Model 23 traingdm tansig 3 2.6022 3.2846 Model 24 traingdm logsig 11 2.6285 3.3071 Table 2. Change of the error values of best model according to the number of hidden layer neurons
A N N M o d el N u mber o f h id d en l a y er n eu ro n s Without grain hardness With grain hardness
MAE RMSE MAE RMSE
M o d el 1 1 2.5746 3.2584 2.5870 3.2577 2 2.5562 3.2397 2.4628 3.0769 3 2.4931 3.2019 2.3642 3.0151 4 2.5372 3.2637 2.3865 3.0055 5 2.4416 3.1536 2.3665 3.0121 6 2.4769 3.1922 2.3048 2.9397 7 2.3971 3.1255 2.3753 2.9937 8 2.4214 3.1510 2.3437 2.9761 9 2.4575 3.1626 2.3116 2.9447 10 2.3333 3.0775 2.2611 2.9146 11 2.3780 3.0815 2.3789 3.0064 12 2.4046 3.1340 2.3187 2.9754 13 2.4331 3.1734 2.3216 2.9539 14 2.3398 3.0888 2.2858 2.9250 15 2.3860 3.1230 2.3558 2.9935 16 2.3862 3.1150 2.3470 3.0038 17 2.4243 3.1763 2.3276 2.9498 18 2.3780 3.1165 2.3313 2.9690 19 2.3738 3.1319 2.3171 2.9711 20 2.3725 3.0936 2.3331 2.9742
A graphical representation of the values in ‘without grain hardness’
column of Table 2 is shown in Fig. 3. The variation of error values depending on the number of hidden layer neurons is shown more clearly in Fig. 3.
Fig. 3. Change of the error values in without grain hardness column of Table 2 according to the number of hidden layer neurons
Since the test data is 15% of the total data, the number of data used for the test is 360. The approximate values of estimated values of 360 test data are shown in a graph. The graph for comparing the predicted output and actual values of the best network model, based on the input properties of the hectoliter weight, 2.8 mm + 2.5 mm, 2.5 mm +2.2 mm, subsieve, thousand kernel weight, is shown in Fig. 4. Grain hardness, included in the dataset in Fig. 7 clearly shows the effect of grain hardness on flour yield. For this purpose, grain hardness values were measured and added to the data set for all 2400 data. In the following stage, hectoliter weight, 2.8 mm + 2.5 mm, 2.5 mm + 2.2 mm, subsieve, thousand-kernel weight and grain hardness would be used as input feature. Error values in Table 1 were recalculated according to the new input properties. The number of hidden layer neurons of 10 produced the lowest error value. Based on this model, i.e., when grain hardness was included, the MAE and RMSE values were 2.2611 and 2.9146, respectively. These values in 'with grain hardness' column of Table 2 are graphically shown in Fig. 5. The change in error values depending on the number of hidden layer neurons with the addition of grain hardness can be clearly seen.
Fig. 4. Comparison of the predictions of the best network model with actual values
Fig. 5. Graphical representation of with grain hardness values in Table 2
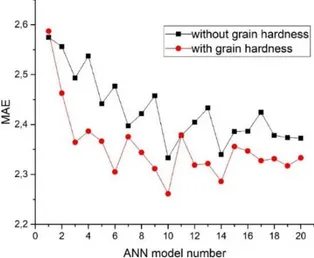
As seen from the tables and graphs, grain hardness has a significant effect on flour yield estimation. The MAE and RMSE values of 2.3333 and 3.0775, respectively, were obtained when the grain hardness data set was not included. When the grain hardness data set is included, the MAE and RMSE values of 2.2611 and 2.9146 were respectively obtained. When the grain hardness is included in ANN, the flour yield estimation approximated to the actual flour yield value. The graphical representation of the MAE values obtained in both cases (without grain hardness, with grain hardness) is shown in Fig. 6. Finally, the approximation of the estimated values of 360 test data to the actual values is shown graphically.
Fig. 6. MAE values obtained in both cases
The graph of the comparison of the predicted output and the actual values of the best network model based on hectoliter weight, 2.8 mm + 2.5 mm, 2.5 mm + 2.2 mm, subsieve, thousand-kernel weight and grain hardness properties are shown in Fig. 7. When grain hardness was included in the data set, the network was trained using the most successful network architecture. Accordingly, a different interface has been created, in which predicted values can be obtained by using the best trained network (see Fig. 8). With this interface, the user can directly estimate flour yield by entering the wheat kernel features.
Fig. 7. Comparison of the predictions of the best network model with actual values (with grain hardness)
Fig. 8. User interface that predicts flour yield depending on the best network model
This study provides a new contribution to the literature. According to our research, no similar study has been found to determine the flour yield by using artificial intelligence. Conventional methods require 500-1500 gr of wheat and milling procedure to determine the flour yield [16].This methods cause time consuming and extra workload. Also, the use of large quantities of wheat samples increases the cost. Our method gives information about the flour yield with high accuracy, fast and costless. Also, it has a user-friendly interface.
4. Conclusion
We attempted to estimate the flour yields of bread wheats using ANN models. By use of physical traits of wheat samples, their flour yields have been calculated automatically by the computer instead of conventional lab-scale milling methods. The work was performed using a GUI in Matlab environment. A total of 2400 data were used for each trait. Of those samples, 2040 were reserved for training data and the remaining for test data. In order to determine the effect of grain hardness on flour yield, ANN trials were conducted with and without hardness data. Learning algorithms, activation functions, and hidden layer neuron numbers have been constantly changed to determine the best ANN architecture. The ANN architecture that produced the best result for flour yield estimation had MAE and RMSE values of 2.3333 and 3.0775, respectively, when grain hardness data were not included. However, when grain hardness data were included, MAE and RMSE values were reduced to 2.2611 and 2.9146,
respectively. This shows that inclusion of grain hardness data in the ANN model improved the estimation of flour yield by use of kernel physical properties. The results of this study proved that flour yield can be satisfactorily estimated using ANN approach that is based on kernel physical properties as opposed to conventional small-scale milling of wheat that requires larger sample size, costly milling equipment and heavier workload.
5. Acknowledgment
This study has been supported by TUBITAK (The Scientific and Technological Research Council of Turkey) under project number 112O135.
References
[1] R. H. Liu, "Whole grain phytochemicals and health," Journal of Cereal
Science, vol. 46, no. 3, pp. 207-219, 2007.
[2] N.Geographic2015). Available: https://media.nationalgeographic.org [3] A.-C. Eliasson and K. Larsson, Cereals in breadmaking: a molecular
colloidal approach (no. 664.6). Marcel Dekker, 1993.
[4] J. A. Delcour and R. C. Hoseney, Principles of Cereal Science and
Technology. AACC International, 2010.
[5] R. W. Summers and P. I. Payne, "International Wheat Quality Conference," in Proceedings, International Wheat Quality Conference: May 18-22, 1997, Holiday Inn-Holidome, Manhattan, Kansas, USA, 1997, p. 185: Grain Industry Alliance.
[6] T. Botwright, A. Condon, G. Rebetzke, and R. Richards, "Field evaluation of early vigour for genetic improvement of grain yield in wheat," Australian Journal of Agricultural Research, vol. 53, no. 10, pp. 1137-1145, 2002.
[7] D. Marshall, F. Ellison, and D. Mares, "Effects of grain shape and size on milling yields in wheat. I. Theoretical analysis based on simple geometric models," Australian journal of agricultural research, vol. 35, no. 5, pp. 619-630, 1984.
[8] D. Marshall, D. Mares, H. Moss, and F. Ellison, "Effects of grain shape and size on milling yields in wheat. II. Experimental studies,"
Australian Journal of Agricultural Research, vol. 37, no. 4, pp.
331-342, 1986.
[9] R. Cheng et al., "Mapping QTLs controlling kernel dimensions in a wheat inter-varietal RIL mapping population," Theoretical and
Applied Genetics, vol. 130, no. 7, pp. 1405-1414, 2017.
[10] R. Alvarez, "Predicting average regional yield and production of wheat in the Argentine Pampas by an artificial neural network approach,"
European Journal of Agronomy, vol. 30, no. 2, pp. 70-77, 2009.
[11] S. E. Jørgensen and G. Bendoricchio, Fundamentals of ecological
modelling. Elsevier, 2001.
[12] N. A. Abdullah and A. M. Quteishat, "Wheat seeds classification using multi-layer perceptron artificial neural network," International
Journal of Electronics Communication and Computer Engineering,
vol. 6, no. 2, pp. 306-309, 2015.
[13] A. Yasar, E. Kaya, and I. Saritas, "Classification of Wheat Types by Artificial Neural Network," International Journal of Intelligent
Systems and Applications in Engineering, vol. 4, no. 1, pp. 12-15,
2016.
[14] M. K. A. Kadir, M. Z. Ayob, and N. Miniappan, "Wheat yield prediction: Artificial neural network based approach," in Engineering
Technology and Technopreneuship (ICE2T), 2014 4th International Conference on, 2014, pp. 161-165: IEEE.
[15] Y. Çakır, M. Kırcı, and E. O. Güneş, "Yield prediction of wheat in south-east region of Turkey by using artificial neural networks," in
Agro-geoinformatics (Agro-geoinformatics 2014), Third International Conference on, 2014, pp. 1-4: IEEE.
[16] K. Kulp, Handbook of Cereal Science and Technology, revised and
expanded. CRC Press, 2000.
[17] G. Zhang and C. Li, Genetics and improvement of barley malt quality. Springer Science & Business Media, 2010.
[18] A. Elgun, Z. Ertugay, M. Certel, and H. Kotancılar, "Tahıl ve Ürünlerinde Analitik Kalite Kontrolü ve Laboratuar Uygulama Kılavuzu.(3. baskı) Atatürk Üniversitesi Yayın No: 867, Ziraat Fakültesi Yayın No: 335, Ders Kitapları Serisi No: 82," Erzurum. s, vol. 245, 2002.
[19] N. Stenvert, "Grinding resistance. A simple measure of wheat hardness," Journal of Flour and Animal Feed Milling, 1974. [20] Y. Wu and T. Nelsen, "A simple, rapid method to measure wheat
hardness by grinding time and speed reduction in a micro hammer-cutter mill," Cereal chemistry, 1991.
[21] A. A. o. C. C. A. M. Committee, Approved Methods of the American
Association of Cereal Chemists (no. 1-2. c.ler). AACC, 2000.
[22] E. Öztemel, Yapay Sinir Ağlari. PapatyaYayincilik, Istanbul, 2003. [23] K. Sabanci, A. Kayabasi, and A. Toktas, "Computer vision‐based
method for classification of wheat grains using artificial neural network," Journal of the Science of Food and Agriculture, vol. 97, no. 8, pp. 2588-2593, 2017.