Evaluation of Validity and Reliability of
the Turkish Version of the E-lifestyle Instrument
E-yaşam Tarzı Ölçeğinin Türkçe Geçerlilik ve Güvenilirliğinin
Değerlendirilmesi
Başak MENDİ , İstanbul Bilim Üniversitesi , Türkiye , [email protected] Onur MENDİ , İstanbul Bilim Üniversitesi , Türkiye , [email protected]
Abstract: The purpose of this study was to translate the e-lifestyle scale developed by Yu (2011) into Turkish and to evaluate the validity of the scale. A sample of 405 participants were enrolled in this study. Data were collected by a socio-demographic questionnaire and the e-lifestyle scale. Following the content validation process, construct validity was assessed through factorial, convergent and discriminant validities. According to the test results, content validity, factorial validity and convergent validity are supported and internal consistency is very good (0.797-0.920). Overall, the Turkish version of the e-lifestyle scale has good content and construct validity and is reliable. This study provides evidence to support the validity and reliability of the Turkish version of the e-lifestyle scale. This is the first methodological study evaluating the validity of the lifestyle instrument translated into another language. This research used the e-lifestyle instrument in Turkish language in order to enable the determination of how ICT affects people’s daily activities, such as performing their jobs, banking, and participating in other social exchanges, and to learn about their opinions of how the use of ICT-enabled services/products affect their lives. The e-lifestyle instrument is a useful tool especially for market researchers, but also for other research areas of the social sciences.
Keywords Internet, Information Communication Technology, Lifestyle, E-lifestyle, Validity
Öz: Bu çalışmanın amacı Yu (2011) tarafından geliştirilen e-yaşam tarzı (e-lifestyle) ölçeğini Türkçe’ye uyarlayarak, ölçeğin geçerliliğini değerlendirmektir. 405 katılımcı ile gerçekleştirilen çalışmada veriler sosyo-demografik soru formu ve e-yaşam tarzı ölçeği kullanılarak elde edilmiştir. Çalışmada, içerik geçerliliği testlerini takiben, kapsam geçerliliği testleri uygulanmış, bu kapsamda doğrulayıcı faktör analizi yapılmıştır. Analiz sonuçlarına göre, ölçek alt boyutları için ölçeğin iç tutarlılık katsayıları 0.797 ile 0.920 arasında bulunmuştur. E-yaşam tarzı ölçeğinin geçerli ve güvenilir bir ölçme aracı olduğu söylenebilir. Bu çalışma, e-yaşam tarzı ölçeğinin başka bir dile çevrildiği ilk metodolojik çalışmadır. Çalışmada kullanılan e-yaşam tarzı ölçeği, bilişim teknolojilerinin bireylerin günlük hayatındaki etkilerini ve bireylerin bu teknolojilerin hayatlarını nasıl etkiledikleri yönündeki görüşlerini ölçmeye yönelik olarak tasarlanmıştır. Özellikle pazarlama alanındaki araştırmalar için yararlı bir araç olan e-yaşam tarzı ölçeği, sosyal bilimler kapsamındaki diğer araştırma alanları için de kullanışlı bir araçtır.
Anahtar Kelimeler Internet, Bilişim Teknolojileri, Yaşam Tarzı, E-yaşam tarzı, Geçerlilik
1. Introduction
Lifestyle is the measure of attitudes, interests and psychological preferences and is defined as the procedure people use to express their understanding of themselves. In the marketing research, lifestyles can be used for niche marketing because they reveal consumers’ needs and desires related to consumption behaviours (Lekakos, 2009; Li, 2013). Lifestyle is defined as “distinctive modes of existence that are accomplished by persons and groups through socially sanctioned and culturally intelligible patterns of action” and has been used for research and advertising in various markets (Lutzenhiser and Gossard, 2000; Sanquist et al., 2012). Lifestyle is a “set of behaviors reflecting individual psychological concerns (internal beliefs) and sociological consequences (external stimuli)” (Yu, 2011).
Information and Communication Technologies (ICT), such as computers, Internet and smart phones are thought to make people’s everyday lives easier. Information sharing, communication, business, shopping, and entertainment have become easier with the use of ICT. ICT-enabled services and products have changed the way and context in which people live in recent years (Yu, 2011). Since most people have very busy working lifestyles with a limited time for family and social activities, sometimes they do not even have time for shopping or meeting with friends outside their homes. The studies of Assael (2005) and Ahmad et al. (2010) suggest that the people who spend the most time on the Internet are the younger ones who work more than 50 hours per week.
The use of ICT has become one of the most popular research areas in recent years. Research has shown that it is a main determinant of performance in developed countries (Kossai and Piget, 2014). Although many studies have been carried out regarding the use and acceptance of ICT, there is still a need for research evaluating the use of ICT among different demographical groups (Kilpelainen and Seppanen, 2014).
According to a survey in the Pew Research Center’s December 2014 report, email (61%) and the Internet (54%) are at the top of the list of important tools in the workplace. Only 7% of online workers feel their productivity has been decreased because of the Internet, email and cell phones, while 46% feel more productive (Purcell and Rainie, 2014). Another report in April 2014 indicates that 59% of Americans feel that technological changes will lead to a future in which people’s lives will be mostly better (Smith, 2014). The Turkish Statistics Institute’s 2013 research findings show that 49.1% of people have access to the Internet in their households, while the proportion was 47.2% in 2012. These results also show that 24.1% of the people
6625
who use the Internet buy services or products online [I].Lifestyle studies first appeared in the 1950s, and were intended to define consumer behaviours (Havinhurst and Feigenbaum, 1959; Yu, 2011), and the concept of lifestyle was used in marketing research in the 1960s (Lazar, 1963; Yu, 2011). The AIO (Activities, Interests, Opinions) scale was developed by Wells and Tigert in 1970s and the VALS (Value, Attitude, Lifestyle) scale developed by Mitchell in 1983 are widely used in lifestyle research (Mitchell, 1983; Yu, 2011). There are different opinions, definitions, and theories related to lifestyle; however, Yu (2011) found in his study that all of these theories suggest that human behaviours can be understood by psychological and sociological variables.
ICT is considered to be the main engine of economic growth in the knowledge society, and has brought about a digital revolution in developed countries. ICT use also affects emerging countries and causes major organizational and managerial changes (Kossai and Piget, 2014; Black and Lynch, 2004). Thus, it is important to examine the use of ICT-enabled services/products in different demographical groups.
Recently, social sciences researchers have been interested in comparing people from different countries and different sociocultural groups on a variety of psychosocial variables (Beckstead et al., 2008) and it is important to determine whether the instruments designed to measure the relevant constructs are cross-culturally invariant for extending theories and their associated constructs to other sociocultural groups (Hui and Triandis, 1985; Beckstead et al., 2008)
Yu (2011) constructed and validated the e-lifestyle scale for use in marketing research. He indicated in his study that cross-cultural validation of the e-lifestyle instrument is necessary for further research. With this concern, this study applied a transcultural adaptation of the e-lifestyle instrument for the Turkish language and assessed the validity and reliability of the Turkish version. An instrument to evaluate the e-lifestyles of the Turkish people was not found in extant literature. The results of this study contribute to an understanding their opinions of and behaviours related to ICT-enabled services/products and validate the e-lifestyle instrument.
2. Materials and Methods
2.1. Instruments
In this study, the e-lifestyle instrument developed in English by Chian-Son Yu in 2011 and a socio-demographic questionnaire were used. The e-lifestyle instrument was developed as a comprehensive evaluation tool to measure the use of ICT-enabled services/products in everyday life, in order to enable marketers understand the main factors influencing e-lifestyles and the related influence of the factors shaping e-lifestyle. It is considered as an improved tool to understand consumers, and thus, enable more effective communication and marketing. Following previous instruments, such as AIO, VALS, ROV and LOV, the questionnaire was developed employing four constructs: e-Activities, e-Interests, e-Opinions, and e-Values. The instrument was developed in English.
The original instrument consists of 39 items, measured using a 5-point Likert scale ranging from 1 (strongly disagree) to 5 (strongly agree). According to the statistical analysis, seven factors from 39 items out of 52 were extracted in the study: Needs-driven e-lifestyle (NDE) (nine items), Interest-driven e-lifestyle (IDE) (six items), Entertainment-driven e-lifestyle (EDE) (five items), Sociability-driven e-lifestyle (SDE) (five items), Perceived importance driven e-lifestyle (PIDE) (five items), Uninterested or
concern-driven e-lifestyle (UCDE) (five items) and, Novelty-concern-driven e-lifestyle (NODE) (four items). These factors
represent the seven principal components that shape and influence people’s e-lifestyles.
NDE, composed of items, such as “I frequently perform my job via ICT-enabled services/products”, “enabled services/products greatly improve my job efficiency” and “The more time with ICT-enabled services/products I spend, the more advantages I take”, points towards performing important tasks using ICT.
IDE includes items, such as “I frequently spend a lot of time involved with ICT-enabled services/products” and “I like gaining knowledge regarding ICT-enabled services/products”. IDE items relate to participants’ interest in ICT.
EDE contains items, such as “I like ICT-enabled services/products involving in my entertainment”, “I frequently play games or listen to music via ICT-enabled services/products”. EDE items relate to involving ICT in entertainment activities.
SDE contains items, such as “ICT-enabled services/products greatly expand my friends circle”, and “I frequently participate in social events via ICT-enabled services/products”. SDE items correspond to social activities and interaction among friends or other people.
PIDE, composed of items, such as “Continued development of ICT-enabled services/products is positive for our society”, “Being able to use the newest ICT-enabled services/products gives me a sense of achievement”, relates to the effects of ICT use and the perceived importance of ICT by participants.
UCDE contains items, such as “The more development of ICT-enabled services/products, the more the pressures on human lives” and “I don’t like my life to involve with too many ICT-enabled
6626
services/products”. UCDE includes items expressing the negative effects ıf ICT use on people, society, education and the interaction between people.
NODE, composed of items, such as “I like to share with people about new knowledge of ICT-enabled services/products”, “Keeping inaugurating new ICT-enabled services/products is very important”, points towards following the latest developments in ICT.
A questionnaire querying demographics, including age, gender, level of education, occupation and monthly income was also used.
2.2. Translation of the E-lifestyle Instrument
Translations carried out by multidisciplinary committees result in better face validity, more accurate content, and better fit indices across CFA models. If more people work on a translation, it will be easier to correct the translation errors. The committee meeting enables members to discuss their views, which helps resolve ambiguities and reach consensus for improvements (Epstein et al., 2013).
The permission to translate and use the e-lifestyle scale was obtained electronically from Chian-Son Yu. Three bilingual (Turkish and English) experts translated the e-lifestyle instrument from English to Turkish independently. Two of them are IT specialists and one is a psychologist. After they compared the three versions, they agreed on a final version. Back-translation of the Turkish version into English was carried out by a professional translator, who had not read the original version. Minor improvements were negotiated in a comprehensive meeting of the expert committee.
The e-lifestyle instrument was piloted with thirty participants to check its clarity and all of the participants indicated that the statements on the scale were clear. The data of these participants was not included in the data of the study.
2.3. Participants
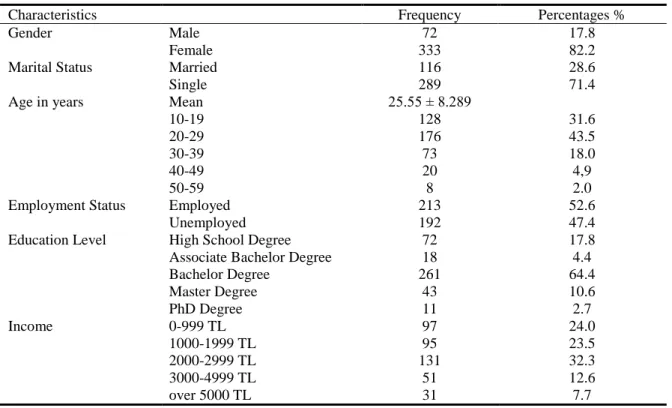
All participants who were willing to participate in the study were enrolled. Study participants were selected by random sampling. During three months, 405 participants had completed the e-lifestyle instrument. Table I shows that 333 respondents (82.2 %) are female, 72 (17.8 %) are male. At the time of the study, the mean age of the participants was 25.55 (± 8.289) years. 52.6 % of the participants were employed and 32.3 % of the participants had moderate monthly incomes. More than half of the participants have a bachelor degree (64.4%).
Table 1. Sociodemographic characteristics of the participants (n = 405)
Characteristics Frequency Percentages %
Gender Male 72 17.8
Female 333 82.2
Marital Status Married 116 28.6
Single 289 71.4
Age in years Mean 25.55 ± 8.289
10-19 128 31.6
20-29 176 43.5
30-39 73 18.0
40-49 20 4,9
50-59 8 2.0
Employment Status Employed 213 52.6
Unemployed 192 47.4
Education Level High School Degree 72 17.8
Associate Bachelor Degree 18 4.4
Bachelor Degree 261 64.4 Master Degree 43 10.6 PhD Degree 11 2.7 Income 0-999 TL 97 24.0 1000-1999 TL 95 23.5 2000-2999 TL 131 32.3 3000-4999 TL 51 12.6 over 5000 TL 31 7.7 2.4. Statistical methods
Data analysis was carried out using the SPSS for Windows (version 16.0; SPSS Inc., Chicago, IL, USA) and AMOS (version 18.0; SPSS Inc., Chicago, IL, USA). Descriptive statistics were used to summarize the
6627
demographic characteristics. Content validity was examined and tested using a panel of ten multidisciplinary experts, including five professors, four ICT experts, and one psychologist. Each expert evaluated the items of the e-lifestyle scale independently and rated the clarity of each item using a 4 point scale (1 = not clear, 2 = somewhat clear, 3 = quite clear, 4 = highly clear). After the evaluation, the content validity index was calculated and classified (CVI) according to Lynn. An item CVI of at least 0.78 for 6-10 experts and a mean CVI of 0.90 are considered to indicate good content validity (Lynn, 1986).
The psychometric sensitivity of the items was evaluated using descriptive statistics (central tendency, variability, and shape). Skewness and kurtosis absolute values lower than 3 and 7, respectively, are considered to indicate sufficient sensitivity (Maroco, 2010).
The construct validity is supported by factorial validity, convergent validity and discriminant validity as explained below.
Confirmatory factor analysis (CFA) was conducted to determine the degree to which the dimensions found satisfy the expected structure. The ratio of Chi-Square to its degree of freedom (X2/df), root mean square error of approximation (RMSEA), Goodness of Fit Index (GFI), Adjusted Goodness of Fit Index (AGFI), comparative fit index (CFI) and Normed Fit Index (NFI) were used, as suggested in the literature (Kline, 1998; Klein et al., 2005).
The average variance extracted (AVE) and the composite reliability (CR) were estimated to determine whether the observed items of the dimensions were strongly correlated between themselves. AVE values greater than acceptable value 0.5 and CR greater than acceptable value 0.7 indicate an adequate convergent validity (Hair et al., 2010).
Discriminant validity tests were conducted to examine whether the items that reflect a dimension are not correlated with any other dimension. There is a discriminant validity between dimension i and j if AVEi and AVEj p2ij (Maroco, 2010).
Internal consistency was evaluated using the standardized Cronbach’s alpha coefficient for each dimension in the scale. A Cronbach’s alpha coefficient of 0.70 or greater is considered statistically applicable.
3. Results
This study was methodologically designed to translate the e-lifestyle scale into the Turkish language and to determine its validity and reliability. First, the CVI of each item was calculated. The item CVI range from a minimum of 0.81to a maximum of 1. The mean CVI for the overall scale is 0.92. The results indicate that all items have a CVI above the significant minimum, so the content validity is supported. An evaluation of psychometric sensitivity on the scale was then carried out.
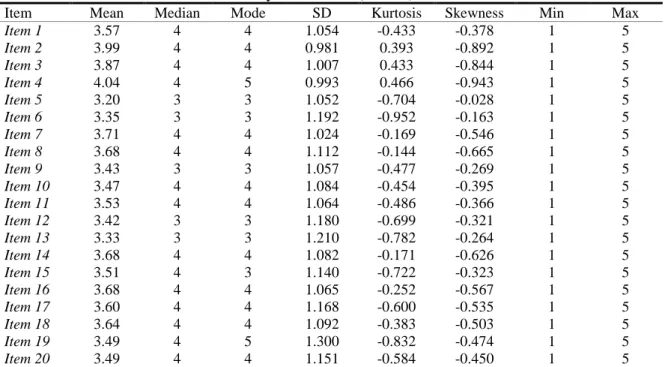
Table 2 shows the descriptive statistics measures of the e-lifestyle scale used to evaluate the psychometric sensitivity of the items. The skewness and kurtosis values indicate no sensitivity problems or significant deviations from normality (Maroco, 2010).
Table 2. Descriptive statistics used to evaluate the psychometric sensitivity of the Turkish version of the
e-lifestyle scale items (n = 405)
Item Mean Median Mode SD Kurtosis Skewness Min Max
Item 1 3.57 4 4 1.054 -0.433 -0.378 1 5 Item 2 3.99 4 4 0.981 0.393 -0.892 1 5 Item 3 3.87 4 4 1.007 0.433 -0.844 1 5 Item 4 4.04 4 5 0.993 0.466 -0.943 1 5 Item 5 3.20 3 3 1.052 -0.704 -0.028 1 5 Item 6 3.35 3 3 1.192 -0.952 -0.163 1 5 Item 7 3.71 4 4 1.024 -0.169 -0.546 1 5 Item 8 3.68 4 4 1.112 -0.144 -0.665 1 5 Item 9 3.43 3 3 1.057 -0.477 -0.269 1 5 Item 10 3.47 4 4 1.084 -0.454 -0.395 1 5 Item 11 3.53 4 4 1.064 -0.486 -0.366 1 5 Item 12 3.42 3 3 1.180 -0.699 -0.321 1 5 Item 13 3.33 3 3 1.210 -0.782 -0.264 1 5 Item 14 3.68 4 4 1.082 -0.171 -0.626 1 5 Item 15 3.51 4 3 1.140 -0.722 -0.323 1 5 Item 16 3.68 4 4 1.065 -0.252 -0.567 1 5 Item 17 3.60 4 4 1.168 -0.600 -0.535 1 5 Item 18 3.64 4 4 1.092 -0.383 -0.503 1 5 Item 19 3.49 4 5 1.300 -0.832 -0.474 1 5 Item 20 3.49 4 4 1.151 -0.584 -0.450 1 5
6628
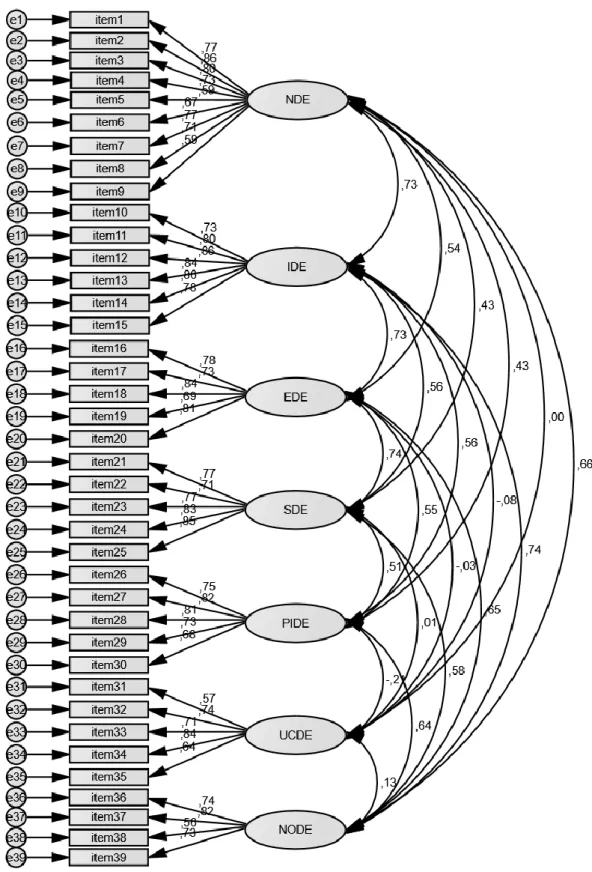
Item 21 3.41 4 4 1.190 -0.871 -0.288 1 5 Item 22 3.38 3 3 1.138 -0.470 -0.379 1 5 Item 23 3.02 3 3 1.218 -0.896 -0.041 1 5 Item 24 3.12 3 3 1.186 -0.868 -0.133 1 5 Item 25 3.18 3 3 1.185 -0.841 -0.133 1 5 Item 26 3.56 4 3 1.053 -0.223 -0.436 1 5 Item 27 3.73 4 4 0.992 -0.218 -0.479 1 5 Item 28 3.94 4 4 0.934 -0.033 -0.623 1 5 Item 29 3.84 4 4 0.938 0.123 -0.609 1 5 Item 30 3.73 4 4 0.986 -0.147 -0.519 1 5 Item 31 3.20 3 3 1.091 -0.558 -0.174 1 5 Item 32 2.74 3 3 1.104 -0.522 0.216 1 5 Item 33 2.81 3 3 1.105 -0.708 0.090 1 5 Item 34 2.87 3 3 1.100 -0.649 0.053 1 5 Item 35 3.53 4 3 1.182 -0.690 -0.399 1 5 Item 36 3.54 4 4 1.061 -0.095 -0.600 1 5 Item 37 3.63 4 4 1.052 -0.333 -0.467 1 5 Item 38 2.76 3 3 1.194 -0.808 0.199 1 5 Item 39 3.75 4 4 1.031 -0.151 -0.581 1 5The confirmatory factor analysis model for the e-lifestyle is given in Figure 1. E-lifestyle items show good standardized factor weights and sufficient item reliability. In the confirmatory factor analysis, the instrument consists of 39 items and seven sub-sales compatible with the original study. The CFA results show the seven-component model comprises 61.02 percent of the variance in the sample, the value of goodness of fit indices
X2/df = 1.992 (<3), RMSEA = 0.050 (<0.08), GFI = 0.861 (>0.8), AGFI = 0.829 (>0.8), CFI = 0.937 (>0.90) and NFI = 0.882 (>0.8). The Turkish version of the scale, consisting seven factors with 39 items, appears to fit the data well and indicates a good model-data fit.
6629
Figure 1. Confirmatory factor analysis for the Turkish version of e-lifestyle questionnaire with correlation
between factors, factorial weights, and R2 for each item
Confirmatory factor analysis results of the e-lifestyle scale are presented in Table 3. The convergent related validity is appropriate for all dimensions of the e-lifestyle scale (AVEi > 0.5; CRi > 0.7) (Hair et al., 2010).
6630
Table 3. CFA results of the e-lifestyle scale (n = 405)
Factor Item Loadings CR AVE
Needs-driven e-lifestyle Item 2 0.856 0.907 0.525 Item 3 0.802 Item 1 0.767 Item 7 0.766 Item 4 0.728 Item 8 0.706 Item 6 0.666 Item 9 0.592 Item 5 0.590 Interest-driven e-lifestyle Item 14 0.863 0.922 0.663 Item 12 0.859 Item 13 0.845 Item 11 0.796 Item 15 0.782 Item 10 0.733 Entertainment-driven e-lifestyle Item 18 0.844 0.881 0.597 Item 20 0.805 Item 16 0.784 Item 17 0.729 Item 19 0.692 Sociability-driven e-lifestyle Item 25 0.850 0.892 0.623 Item 24 0.832 Item 23 0.772 Item 21 0.771 Item 22 0.714 Perceived importance-driven Item 27 0.824 0.872 0.577 Item 28 0.808 Item 26 0.753 Item 29 0.727 Item 30 0.677 Uninterested or concern-driven Item 34 0.842 0.832 0.502 Item 32 0.741 Item 33 0.714 Item 35 0.642 Item 31 0.573 Novelty-driven e-lifestyle Item 37 0.820 0.807 0.516 Item 36 0.745 Item 39 0.727 Item 38 0.556
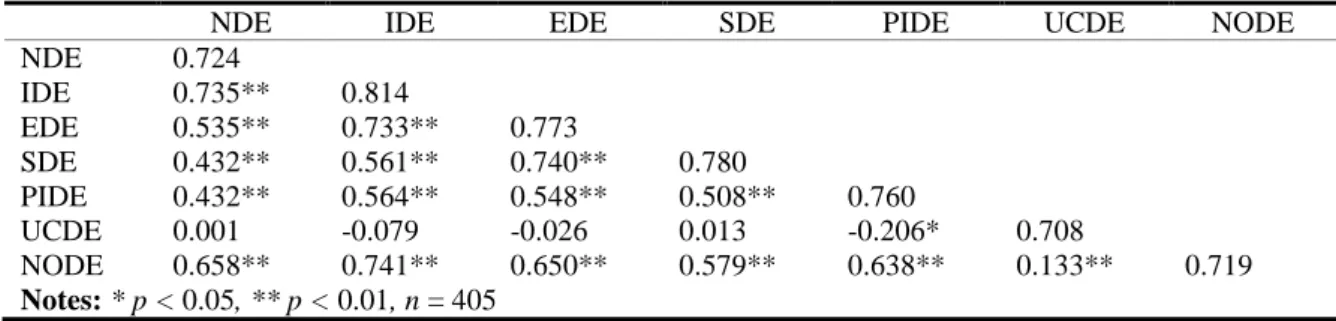
No discriminant-related validity was observed for the two dimensions NDE and NODE (AVENDE e AVENODE < p2). The convergent validity is supported for all dimensions of the e-lifestyle instrument and the discriminant validity is supported for all variables except NDE and NODE (Table 4).
Table 4. Discriminant validity and correlations among the factors
NDE IDE EDE SDE PIDE UCDE NODE
NDE 0.724 IDE 0.735** 0.814 EDE 0.535** 0.733** 0.773 SDE 0.432** 0.561** 0.740** 0.780 PIDE 0.432** 0.564** 0.548** 0.508** 0.760 UCDE 0.001 -0.079 -0.026 0.013 -0.206* 0.708 NODE 0.658** 0.741** 0.650** 0.579** 0.638** 0.133** 0.719 Notes: * p < 0.05, ** p < 0.01, n = 405
The Cronbach’s alpha levels of the seven dimensions range from 0.797 to 0.920 (mean = 0.869, SD = 0.043). The internal consistency of the dimensions is very good (NDE = 0.905, IDE = 0.920, EDE = 0.881, SDE =
6631
0.890, PIDE = 0.867, UCDE = 0.829, NODE = 0.797), and the correlation is high between items of each
dimension (rinteritem_NDE = 0.385-0.706, rinteritem_IDE = 0.575-0.666, rinteritem_EDE = 0.498-0.668, rinteritem_SDE =
0.546-0.643, rinteritem_PIDE = 0.452-0.702, rinteritem_UCDE = 0.349-0.439, rinteritem_NODE = 0.444-0.614). The results
show that they are part of the same conceptual construct and the e-lifestyle instrument is a consistent measurement scale.
4. Discussion
Lifestyle studies are useful in understanding consumer buying behaviour and communicating and marketing to them (Hawkins et al., 2002). Previous study has emphasized the need for a valid instrument measuring lifestyles of consumers. Internet has changed the way people live, work, learn and shop in recent years. Thus, understanding traditional lifestyles is inadequate in explaining electronic lifestyles (Pandey and Chawla, 2014).
Although there are many studies exploring the use of ICT, very little research has been conducted to directly evaluate e-lifestyle. Based on this deficiency, Yu (2011) developed the e-lifestyle instrument to offer an especially useful tool for marketing research. Also no Turkish instrument measuring e-lifestyles could be found in the published literature. The objective of this study was to translate the e-lifestyle instrument into the Turkish language and validate the Turkish version of the scale. The results of the study provide support for the validity and reliability of the scale.
Translation of the scale into Turkish was performed by translation, back-translation, expert review and pilot study. The content validity was carried out by evaluating the ratings of ten experts (mean CVI = 0.92; item CVI = 0.81-1.0). The results show that all items on the scale have a CVI above the significant minimum and are clear.
Descriptive statistics measures were used to evaluate the sensitivity of psychometric items of the scale. For seven dimensions, all of the items have values of skewness and kurtosis indicative of substantial deviations from normal distribution and indicate no sensitivity problems.
The confirmatory factor analysis results show that the seven dimensions in the scale are compatible with the original study. Our findings confirm the seven factors in the instrument. Figure 1 shows that the Turkish version has adequate factorial-related validity. The dimensions of the instrument are: Needs-driven e-lifestyle (NDE) (nine items), Interest-driven e-lifestyle (IDE) (six items), Entertainment-driven e-lifestyle (EDE) (five items), Sociability-driven e-lifestyle (SDE) (five items), Perceived importance driven e-lifestyle (PIDE) (five items), Uninterested or concern-driven e-lifestyle (UCDE) (five items) and, Novelty-driven e-lifestyle (NODE) (four items). These dimensions represent the seven components that shape and influence people’s e-lifestyles.
Composite reliability and the average variance extracted were used to assess the convergent validities. The composite reliability exceeds the acceptable value of 0.7 for all factors and the average variance extracted is greater than 0.5 for all variables. Thus, the translated, Turkish instrument shows adequate convergent validity. However, there is no discriminant validity for two of the seven dimensions. This suggests that the discriminant validity should be reassessed in another sample that has similar characteristics to this study. The Turkish version of the e-lifestyle scale shows acceptable internal consistency, so is a consistent measurement scale. The Cronbach’s alpha coefficients of the seven dimensions in this study are higher than the original study. This may be partly related to the sample size or characteristics of the sample.
Differences in cross-cultural comparisons are sometimes linked to methodological flaws rather than actual differences, but the step-by-step process of validation used reduces that possibility to an acceptable minimum (Sperber et al., 1994).
A comparison of validity of the e-lifestyle scale in this study and in the published literature is difficult because no other studies translating the instrument and giving information on the validity of the instrument could be found.
5. Conclusions
E-lifestyle is a useful instrument developed to gain an understanding how people integrate ICT-enabled services/products into their lifestyles. Yu (2011) suggested that cross-cultural validation should be done to enhance the validity and generalization of the scale.
The results of this study should be viewed in light of its potential limitations, including a smaller number of respondents then the original study, only 17.85% of male respondents, and mostly of a young age group. Future studies should assess the psychometric properties of the instrument with a more diverse sample and a wider age range.
The results of this study indicate high content, factorial, and convergent validity. It suggests that the Turkish version of the e-lifestyle scale is a reliable and useful instrument for understanding the ICT-related behaviours and opinions of the people in Turkey. The instrument is especially useful for marketing research, but is also appropriate for other research in the social sciences.
6632
References
Ahmad, N., Omar, A. and Ramayah, T. (2010). Consumer lifestyles and online shopping continuance intention. Business Strategy Series, 11 (4), 227-243.
Assael, H. (2005). A demographic and psychographic profile of heavy Internet users and users by type of internet usage. Journal of Advertising Research, 45(1), 93-123.
Beckstead, J. W., Yang, C-Y. and Lengacher, C. A. (2008). Assessing cross-cultural validity of scales: A methodological review and illustrative example. Internetional Journal of Nursing Studies, 45, 110-119.
Black, S. and Lynch, L. (2004). What's driving the new economy? The benefits of workplace innovation. The
Economic Journal, 114(493), F97–F116.
Epstein, J., Osborne, R. H., Elsworth, G. R., Beaton, D. E. and Guillemin, F. (2013). Cross-cultural adaptation of the Health Education Impact Questionnaire: experimental study showed expert committee, not back-translation, added value. Journal of Clinical Epidemiology,
doi:10.1016/j.jclinepi.2013.07.013 (In Press).
Hair, J. F., Black, W. C., Babin, B. and Anderson, R. E. (2010). Multivariate Data Analysis, 7th Edition. Upper Saddle River, NJ, USA: Prentice - Hall.
Havinhurst, R. J. and Feigenbaum, K. (1959). Leisure and life style. American Sociologist, 64 (1), 396-404. Hawkins, D. I., Best, R. J. and Coney, K. A. (2002). Consumer Behaviour-Building Marketing Strategy, 8th
ed. New Delhi: Tata McGraw Hill.
Hui, C.H. and Triandis, H.C. (1985). Measurement in cross-cultural psychology: a review and comparison of strategies. Journal of Cross-Cultural Psychology, 16, 131–152.
Kilpelainen, A. and Seppanen, M. (2014). Information technology and everyday life in ageing rural villages.
Journal of Rural Studies, 33, 1-8.
Klein, S., Astrachan, J. and Smyrnios, K. (2005). The F-PEC scale of family influence: Construction, validation and further implication for theory. Entrepreneurship Theory and Practice, 29 (3), 321-39. Kline, R. B. (1998). Principles and practice of structural equation modeling. NY: Guilford Press.
Kossai, M. and Piget, P. (2014). Adoption of information and communication technology and firm profitability: empirical evidence from Tunisian SMEs. Journal of High Technology Management
Research, 25, 9-20.
Lazar, W. (1963). Life style concepts and marketing, in Stephen, A.G. (Ed.), Toward Scientific Marketing, American Marketing Association, Chicago, IL, 143-51.
Lekakos, G. (2009). It’s personal extracting lifestyle indicators in digital television advertising. Journal of
Advertising Research, 49 (4), 404-418.
Li, S-C. S. (2013). Lifestyle orientations and the adoption of Internet-related technologies in Taiwan.
Telecommunications Policy, 37, 639-650.
Luzenhiser, L. and Gossard, M. H. (2000). Lifestyle, status and energy consumption in proceedings of ACEE
Efficiency and Sustainability Summer Study in Pacific Grove, CA, 8, 207-222.
Lynn, M. R. (1986). Determination and quantification of content validity. Nursing Research, 35 (6), 382-385. Maroco, J. Analise de equaçoes estruturais, Lisboa: Report-Number; 2010.
Mitchell, A. (1983). The Nine American Lifestyles, New York: Warner.
Pandeyi S and Chawla, D. (2014). E-lifestyles of Indian online shoppers: A scale validation. Journal of
Retailing and Consumer Services, 21, 1068-1074.
Purcell, K. and Rainie, Lee. (2014). Technology’s Impact on Workers, available at:
http://www.pewinternet.org/2014/12/30/technologys-impact-on-workers/ (accessed 19 January 2014).
Sanquist, T.F., Orr, H., Shui, B. and Bittner, A. C. (2012). Lifestyle factors in U.S. residential electricity consumption. Energy Policy, 42, 354-364.
Smith, A. (2014). U.S. Views of Technology and the Future, available at:
http://www.pewinternet.org/2014/04/17/us-views-of-technology-and-the-future/ (accessed 19 January 2014).
Sperber, A. D., Devellis, R. F. and Boehlecke, B. (1994). Cross-cultural translation methodology and validation. Journal of Cross-Cultural Psychology, 25 (4), 501-524.
TUİK (2013). Hanehalkı Bilişim Teknolojileri Kullanım Araştırması, available at:
http://www.tuik.gov.tr/PreHaberBultenleri.do?id=13569, (accessed 22 January 2014).
Yu, C-S. (2011). Construction and validation of an e-lifestyle instrument. Internet Research, 21 (3), 214-235.
View publication stats View publication stats